Encyclopedia of Finance Part 9 ppsx
Bạn đang xem bản rút gọn của tài liệu. Xem và tải ngay bản đầy đủ của tài liệu tại đây (183.05 KB, 8 trang )
Chapter 15
CHINESE A AND B SHARES
YAN HE, Indiana University Southeast, USA
Abstract
A and B shares exist in the Chinese stock markets.
A shareholders are domestic investors and B share-
holders are foreign investors. During the early-and
mid-1990s, B shares were traded at a discount rela-
tive to A shares, and B-share returns were higher
than A-share returns. It is found that B-share mar-
ket has persistent higher bid-ask spreads than the
A-share market and traders in the B-share market
bear higher informed trading and other transaction
costs. In addition, the higher volatility of B-share
returns can be attributed to the higher market mak-
ing costs in the B-share market.
Keywords: Chinese A shares; Chinese B shares;
stock; return; volatility; asymmetric information;
bid-ask spread; transaction costs; stock ownership;
Shanghai stock exchange; Shenzhen stock ex-
change
The development of equity markets in China
started in early 1990s. Open for business in Decem-
ber 1990, the Shanghai Stock Exchange (SHSE)
and the Shenzhen Stock Exchange (SZSE) are the
two major securities exchanges in China. By 1998,
the SHSE had raised a total of RMB140.814 bil-
lion for listed companies and the SZSE had raised
a total of RMB 128 billion for listed companies.
The two exchanges played an important role in
promoting the restructuring of state-owned enter-
prises.
Stock shares in China are divided into two
broad categories: untradable and tradable. By
the end of 1998, the total untradable equity of
the listed companies was 166.484 billion shares
(i.e. 65.89 percent of the total equity of the listed
companies), allocated as follows: (1) shares owned
by government, 86.551 billion; (2) shares owned by
legal persons, 71.617 billion; (3) shares owned
by employees and others, 8.317 billion. Outstand-
ing tradable shares totaled 86.193 billion shares
(i.e. 34.11 percent of the total equity of the listed
companies), allocated as follows: (1) Class A
shares, 60.803 billion; (2) Class B shares, 13.395
billion; and (3) Class H shares, 11.995 billion.
Class A shares are owned by domestic investors
and traded in the domestic markets. Class B shares
are owned by foreign investors but traded in the
domestic markets. Class H shares are listed on the
Hong Kong Stock Exchange.
China has tightly restricted foreign stock own-
ership throughout the 1990s. The ownership re-
striction creates two distinct groups of investors:
the domestic and foreign investors. Class A shares
are domestic shares and class B shares are foreign
shares. In 1991, the Shanghai Stock Exchange
(SHSE) and Shenzhen Stock Exchange (SZSE)
began to offer B shares, providing foreign investors
with a legal channel to invest in China’s equity
markets. B shares are also known as Renminbi
Special Shares. B shares are issued in the form of
registered shares and they carry a face value de-
nominated in Renminbi. B shares are subscribed
and traded in foreign currencies, but they are
listed and traded in securities exchanges inside
China. The B share market has attracted a consid-
erable amount of foreign investors. The Market
provides an additional channel for foreign capital
to invest in China.
Since March 2001, China has opened its B-share
market – previously reserved for overseas investors –
to Chinese individuals with foreign currency de-
posits. However, the impact of the opening up of
the B-share market to Chinese is limited, because
that market is small compared to the number of
Chinese people and institutions’ foreign currency
holdings. Despite the rising foreign currency de-
posits in China, Chinese people who have foreign
currency holdings still account for a very small
proportion of investors.
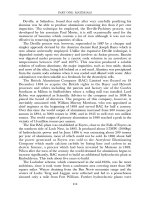
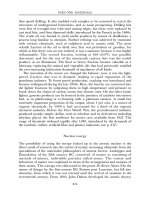
Tables 15.1 to 15.3 are obtained from the China
Securities Regulatory Committee.
During the early- and mid-1990s, B shares were
traded at a discount relative to A shares, and
B-share returns were higher than A-share returns.
Su (1999) explains the return premiums on the
foreign-owned B shares in the Chinese stock mar-
kets by testing a one-period capital asset-price
model (CAPM). He concludes that foreign inves-
tors are more risk-averse than domestic investors.
Sun and Tong (2000) explain the price discount of
the B shares by differential demand elasticity. They
document that when more H shares and red chips
are listed in Hong Kong, the B-share discount
becomes larger. In addition, Chui and Kwok
(1998) show that the returns on B shares lead the
returns on A shares, which induces an asymmetric
positive cross-autocorrelation between the returns
on B and A shares. They argue that A- and B-share
investors have different access to information, and
information often reaches the B-share market be-
fore it reaches the A-share market.
The Chinese stock markets have grown very
rapidly during the late 1990s and early 2000s.
A number of studies investigate the return and
risk in the newly developed markets. For example,
Lee et al. (2001) examine time-series features of
stock returns and volatility, as well as the relation
between return and volatility in four of China’s
stock exchanges. On the one hand, test results
provide strong evidence of time-varying volatility
and show volatility is highly persistent and predict-
able. On the other hand, the results do not show
any relation between expected returns and
expected risk.
Table 15.1. Trading summary of A and B shares during 11=2000–11=2001
A or B share
listed
Total market
capitalization
Stock
turnover
Stock trading
volume
No. of
transactions
No. of companies (100 000 000 Yuan) (100 000 000 Yuan) (100 000 000) (10 000)
2000=11 1063 46061.78 5012.27 365.02 5013
2000=12 1088 48090.94 3737.6 271.35 3719
2001=01 1100 48497.99 3013.63 220.08 3082
2001=02 1110 46228.75 1950.05 151.92 2197
2001=03 1122 50908.44 5095.17 488.33 4335
2001=04 1123 51006.9 5395.87 422.43 4720
2001=05 1129 53205.49 4452.16 328.33 3739
2001=06 1137 53630.58 4917.12 355.5 4449
2001=07 1140 46440.83 3100.68 228.25 2983
2001=08 1151 48054.63 2490.85 221.31 2507
2001=09 1154 45831.36 1766.64 154.67 1858
2001=10 1152 43742.14 1951.5 181.03 1914
2001=11 1153 45431.59 2092.26 200.31 2374
436 ENCYCLOPEDIA OF FINANCE
The development in the Chinese markets may
affect the risk and return of A- and B-share classes.
He and Wu (2003) provide two interesting find-
ings: (1) the daily returns of domestic shares (A
shares) and foreign shares (B shares) were almost
identical in the late 1990s, while the B-share re-
turns were much higher than the A-share returns
during the mid-1990s; (2) the volatility of B-share
daily returns was higher than that of A shares,
while previous studies have often documented
higher return volatility for A shares. (For example,
Su and Fleisher (1999) report that A shares have
higher volatility than B shares based on the data of
mid-1990s.)
Since A and B shares are entitled to the same
cash flows of a firm and have similar returns, the
higher return volatility of B shares is puzzling. The
market microstructure theory suggests that both
volatility and bid-ask spreads are positively related
to asymmetric information (see Kyle, 1985; Easley
et al., 1996). According to this theory, higher vola-
tility is caused by higher degree of information
asymmetry and participation rate of informed
traders in the market, which, in turn, lead to higher
trading costs. Thus, the higher volatility of B
shares may be due to a more severe asymmetric
information problem in the B-share market. If so,
we should observe higher trading costs for B
shares. Furthermore, Easley et al. (1996) show
that spreads and volatility are negatively related
to liquidity. Since the order processing cost is the
cost of providing liquidity and immediacy, lower
liquidity results in higher order processing cost
and higher volatility. A recent study by Green
et al. (2000) on the London Stock Exchange
shows that changes in transaction costs have a
significant effect on share price volatility. More-
over, Chordia et al. (2002) document that return
volatility is significantly related to quoted spreads.
These findings confirm the theoretical prediction
that volatility and trading costs are positively
correlated.
Therefore, the higher volatility in the B-share
market may reflect higher idiosyncratic risk (rather
Table 15.2. A and B shares offering (1987–1998)
87 88 89 90 91 92 93 94 95 96 97 98 Total
Shares issued (100MM) 10 25 7 4 5 21 96 91 32 86 268 102 746
A share 10 25 7 4 5 10 43 11 5 38 106 79 343
H share 40 70 15 32 137 13 307
B share 11 13 10 11 16 25 10 96
Capital raised (RMB 100MM) 10 25 7 4 94 375 327 150 425 1,294 837 3,553
A share 10 25 7 4 50 195 50 23 224 655 440 1,687
H share 61 89 31 84 360 38 763
B share 44 38 38 33 47 81 26 307
Rights offering of A and B shares 82 50 63 70 198 335 797
Table 15.3. Number of listed companies (1990–1998)
Companies 1990 1991 1992 1993 1994 1995 1996 1997 1998
Issuing A share 10 14 35 140 227 242 431 627 727
Issuing B share 0 0 0 6 4 12 16 25 26
Issuing A and B shares 0 0 18 34 54 58 69 76 80
Issuing A and H shares 0 0 0 3 6 11 14 17 18
Total 10 14 53 183 291 323 530 745 851
CHINESE A AND B SHARES 437
than higher systematic risk) of B-share stocks. The
trading risk associated with asymmetric informa-
tion can be diversified away and therefore it is not
systematic risk (see Chordia et al. 2001). Asset-
pricing models (e.g. CAPM and APT) suggest
that expected returns should be determined by
systematic risk. Since higher volatility does not
necessarily imply higher systematic risk, it may
not be accompanied with higher returns. Su
(1999) finds that market risk (measured by market
betas) can explain returns of A and B shares, but
nonmarket risk variables, such as the variance of
returns and firm size, do not systematically
affect returns. Thus, the difference in return vola-
tility between the A- and B-share markets may be
caused by the difference in idiosyncratic risk. Trad-
ing cost, which reflects asymmetric information
and liquidity of trading, may explain the B-share
market anomaly. For example, if B-share investors
incur higher trading costs than A-share investors,
the return volatility of B shares would be higher
than that of A shares, other things being equal. In
line with the above arguments, He and Wu (2003)
examine whether the difference in trading costs (or
market making costs) between the Chinese A and
B shares can explain the difference in return vola-
tility between the two classes of shares. They esti-
mate the end-of-day bid-ask spread and its
informed trading and noninformed trading cost
components for each stock using daily data in the
late 1990s. Their results show that the B-share
market has persistent higher bid-ask spreads than
the A-share market, and traders in the B-share
market bear higher informed trading and other
transaction costs. Furthermore, they find that the
higher volatility of B-share returns can be attrib-
uted to the higher market making costs in the
B-share market.
REFERENCES
Chordia, T., Roll, R., and Subrahmanyam, A. (2002).
‘‘Order imbalance, liquidity, and market returns.’’
Journal of Financial Economics, 65: 111–131.
Chui, A. and Kwok, C. (1998). ‘‘Cross-autocorrelation
between A shares and B shares in the Chinese
Stock Market.’’ Journal of Financial Research, 21:
333–354.
Easley, D., Kiefer, N., O’Hara, M., and Paperman,
J. (1996). ‘‘Liquidity, information, and infrequently
traded stocks.’’ Journal of Finance, 51: 1405–1436.
Green, C.J., Maggioni, P., and Murinde, V. (2000).
‘‘Regulatory lessons for emerging stock markets
from a century of evidence on transactions costs
and share price volatility in the London Stock
Exchange.’’ Journal of Banking and Finance, 24:
577–601.
He, Y., Wu, C., and Chen, Y M. (2003). ‘‘An explan-
ation of the volatility disparity between the domestic
and foreign shares in the Chinese Stock Markets.’’
International Review of Economics and Finance, 12:
171–186.
Kyle, A. (1985). ‘‘Continuous auctions and insider trad-
ing.’’ Econometrica, 53: 1315–1335.
Lee, C.F., Chen, G., and Rui, O.M. (2001). ‘‘Stock
returns and volat ility on China’s stock markets.’’
The Journal of Financial Research, 24: 523–544.
Su, D. (1999). ‘‘Ownership restrictions and stock prices:
evidence from Chinese markets.’’ Financial Review,
34: 37–56.
Su, D. and Fleisher, B.M. (1999). ‘‘Why does return
volatility differ in Chinese stock markets?’’ Pacific-
Basin Finance Journal, 7: 557–586.
Sun, Q. and Tong, W. (2000). ‘‘The effect of market
segmentation on stock prices: the China syndrome.’’
Journal of Banking and Finance, 24: 1875–1902.
438 ENCYCLOPEDIA OF FINANCE
Chapter 16
DECIMAL TRADING IN THE
U.S. STOCK MARKETS
YAN HE, Indiana University Southeast, USA
Abstract
All NYSE-listed stocks were switched from a frac-
tional to a decimal trading system on January 29,
2001 and all NASDAQ stocks followed suit on April
9, 2001. The conversion to decimal trading in the
U.S. markets has significantly reduced bid–ask
spreads. This decline is primarily due to the drop in
market makers’ costs for supplying liquidity. In add-
ition, rounding becomes less salient after the deci-
malization. The decrease in bid–ask spreads can be
ascribed to the decrease in price rounding, when
controlling for the changes in trading variables.
Keywords: decimal trading; decimalization; NYSE;
NASDAQ; clustering; rounding; bid–ask spread;
volatility; fractional trading; price improvement
The minimum increment of trading prices varies
substantially with market and location. For in-
stance, pricing of stock, bond, and options markets
in the U.S. and Canada had traditionally been
denominated in eighths, while in European and
Asian markets decimal prices are more common.
During the later half of 1990s, the U.S. and Can-
adian markets underwent substantial changes.
Canadian stocks switched from fractions to deci-
mals in April 1996. In the U.S. markets, the min-
imum tick size was reduced from one-eighth of a
dollar to one-sixteenth of a dollar in June 1997. At
the beginning of year 2000, the U.S. equity markets
were the only major financial markets in the world
that traded in fractional increments. This frac-
tional trading practice puts U.S. markets at a com-
petitive disadvantage with foreign markets trading
the same securities. In addition, individual inves-
tors may have a difficulty in determining the dif-
ferences between increasingly smaller fractions.
To make the U.S. securities markets more com-
petitive globally and their prices easier to decipher,
the Securities Industry Association and the Secur-
ities and Exchange Commission decided to convert
the U.S. equity and exchange-traded options mar-
kets from fractional to decimal trading. The NYSE
selected seven pilot securities for a decimal pricing
test on August 28, 2000, another 57 securities were
added to the pilot program on September 25, 2000,
and another 94 were added on December 4, 2000.
The NASDAQ market began its decimal test with
14 securities on March 12, 2001, and another 197
securities were added on March 26, 2001. All
NYSE-listed stocks were switched to a decimal
trading system on January 29, 2001 and all NAS-
DAQ stocks followed suit on April 9, 2001.
Recently, a number of studies have generated
interesting findings about the effects of decimaliza-
tion on return volatility and bid–ask spreads. They
report that decimalization affects bid–ask spreads,
volatility, quote size, and price improvement
frequency (or the probability of trades within the
quoted bid–ask spreads). First of all, it was shown
that the recent conversion to decimal trading in the
U.S. markets has significantly reduced bid–ask
spreads (see NYSE, 2001; NASDAQ, 2001; Chak-
ravarty et al., 2001a,b; Chung et al., 2001; Gibson
et al., 2002). These findings coincide with two earl-
ier studies (Ahn et al., 1998; Bacidore, 1997) on the
Toronto Stock Exchange (TSE). Bacidore et al.,
(2001b) examine a wide range of market quality
issues on the NYSE post-decimalization, and find
that an increase in the aggressiveness of limit order
pricing results in narrower bid–ask spreads. Chung
et al. (2004) examine the relationship between
NASDAQ trading costs and the extent of order
preferencing. They document lower order prefer-
encing and a positive relationship between the bid–
ask spread and the proportion of internalized vol-
ume on NASDAQ after decimalization. Second,
Bessembinder (2003) and NASDAQ (2001) show
that intraday return volatility has declined, and
there is no evidence of systematic reversals in
quotation changes. Thus, it appears that the
NYSE and NASDAQ markets are able to supply
sufficient liquidity in the wake of decimalization.
Third, Bessembinder (2003) presents that quote
size decreases after decimalization. Jones and Lip-
son (2001) and Goldstein and Kavajecz (2000) re-
port decreases in limit-order book depth after an
earlier NYSE tick size reduction, and Bacidore
et al. (2001a) report decreases in limit-order book
depth after the decimalization on the NYSE. Fi-
nally, Bacidore et al. (2001b) and Bessembinder
(2003) find evidence that the percentage of orders
experiencing price improvement (i.e. executed
within the quotes) increases on the NYSE after
decimalization, though the dollar amount of price
improvement falls. According to Coughenour and
Harris (2003), decimal trading effectively relaxes
the public order precedence rule and gives special-
ists more price points within the bid–ask spread
on which to quote aggressively. This allows spe-
cialist trading firms of all size to trade more
often inside the current quote and so the probabil-
ity that a trade occurs inside the quotes becomes
higher.
Almost all the above studies document the
changes in ‘‘total’’ return volatility and spreads of
transactions. He and Wu (2004) examine the
composition of return volatility, serial correlation,
and trading costs before and after the decimaliza-
tion on the NYSE. Specifically, they decompose
the variance of price changes into components
associated with public news, rounding errors, and
market-making frictions (asymmetric information
and liquidity costs). First, the test results show that
both variance components due to market-making
frictions (or bid–ask spreads) and rounding errors
decline considerably after decimalization, while the
variance component due to public news shocks
remains unchanged. Second, the serial correlation
of price changes is significantly reduced after deci-
malization, indicating a weakened bid–ask bounce
effect as a result of decimal trading. Finally, bid–
ask spreads decline substantially after decimaliza-
tion and this decline is primarily due to the drop in
market makers’ costs for supplying liquidity.
In addition to volatility and transaction costs,
the recent decimalization also provides an oppor-
tunity to revisit the issue of price rounding. Since
traders often choose to use a larger price increment
than the minimum tick, prices tend to cluster on
certain fractions or decimals even when the tick is
small. (See Ball et al. (1985) for gold trading;
Brown et al. (1991) for silver; Goodhart and Cur-
cio (1992) for foreign exchange; and Aitken, et al.
(1995) for Australian stocks.) Harris (1999) pre-
dicts that the conversion to decimal trading
would lead to lower execution costs. Bessembinder
(2002) shows that bid–ask spreads have declined
after the decimalization.
He and Wu (2003) investigate the pattern of
price rounding before and after decimal trading
and its effect on bid–ask spreads for NYSE stocks
by using the second pilot sample which includes 57
NYSE securities. Prior to September 25, 2000,
these stocks were traded on sixteenths. Since
then, they have been traded on pennies. First,
since decimal trading leads to a finer price grid or
a set of less discrete prices, it is expected to observe
a decline in frequencies of rounding on integers,
halves, and quarters. Second, although frequencies
of rounding on integers, halves, and quarters may
440 ENCYCLOPEDIA OF FINANCE
decline after decimalization, it is expected that
cross-sectionally the relationship between round-
ing and trading variables and the relationship be-
tween execution costs and rounding will stay the
same. That is, the sensitivity of trading variables
to rounding and the sensitivity of execution costs to
rounding should remain unchanged because the
fundamentals of the market do not change as a
result of decimalization. Finally, consistent with
the arguments of Harris (1997, 1999), it is expected
to find a significant relationship between the de-
crease in execution costs and the decrease in
rounding after decimalization, when controlling
for the changes in stock features. If fractional pri-
cing indeed allows market makers to keep bid–ask
spreads artificially high to earn a positive rent, a
conversion to decimal trading should reduce price
rounding, decrease market makers’ rents, and
cause a fall in bid–ask spreads.
The empirical results of He and Wu (2003)
show that although rounding is pervasive in trans-
action prices, bids, and asks in both the pre- and
post-decimalization periods, it has become less sa-
lient after the decimalization. The cross-sectional
relationship between rounding and trading vari-
ables is similar before and after the decimalization,
and so is the relationship between execution costs
and rounding when trading variables are held con-
stant for each stock. More importantly, the quoted
and effective bid–ask spreads decrease after the
decimalization, and this decrease can be ascribed
to the decrease in price rounding when controlling
for the changes in trading variables.
REFERENCES
Ahn, H J., Cao, Q.C., an d Choe, H. (1998). ‘‘Decimal-
ization and competition among stock markets:
Evidence from the Toronto stock exchange cross-
listed securities.’’ Journal of Financial Markets, 1:
51–87.
Aitken, M., Brown, P., Buckland, C., Izan, H.Y., and
Walter, T. (1995). ‘‘Price clustering on the Australian
stock exchange.’’ Working Paper, University of
Western Australia.
Bacidore, J. (1997). ‘‘The impact of decimalization on
market quality: an empirical investigation of the To-
ronto Stock Exchange.’’ Journal of Financial Inter-
mediation, 6: 92–120.
Bacidore, J., Battalio, R., and Jennings, R. (2001a).
‘‘Order submi ssion strategies, liquidity supply, and
trading in pennies on the New York Stock Ex-
change,’’ Working Paper, Indiana University.
Bacidore, J., Battalio, R., Jennings, R., and Farkas, S.
(2001b). ‘‘Changes in order characteristics, displayed
liquidity, and execution quality on the NYSE around
the switch to decimal pricing,’’ Working Paper, The
New York Stock Exchange.
Ball, C.A., Torous, W.N., and Tshoegl, A.E. (1985).
‘‘The degree of price resolution: the case of the gold
market.’’ Journal of Futures Markets, 5: 29–43.
Bessembinder, H. (2003). ‘‘Trade execution costs and
market quality afte r decimalization.’’ Journal of Fi-
nancial and Quantitative Analysis, 13: 19–42.
Brown, S., Laux, P., and Schachter, B. (1991). ‘‘On the
existence of an optimal tick size.’’ Review of Futures
Markets, 10: 50–72.
Chakravarty, S., Harris, S., and Wood, R. (2001a).
‘‘Decimal trading and market impact,’’ Working
Paper, University of Memphis.
Chakravarty, S., Harris, S., and Wood, R. (2001b).
‘‘Decimal trading and market impact: The Nasdaq
experience.’’ Working Paper, University of Memphis.
Chung, K., Van-Ness, B., and Van-Ness, R. (2001).
‘‘Are Nasdaq stocks more costly to trade than
NYSE stocks? Evidence after decimalization.’’
Working Paper, Kansas State University.
Chung, K., Chuwonganant, C., and McCormick, T.
(2004). ‘‘Order preferencing and market quality on
Nasdaq before and after decimalization.’’ Journal of
Financial Economics, 71: 581–612.
Coughenour, J. and Harris, L. (2003). ‘‘Specialist profits
and the minimum price increment.’’ Working Paper.
Gibson, S., Singh, R., and Yerramilli, V. (2002). ‘‘The
effect of decimalization on the components of the bid-
ask spreads.’’ Working Paper, Cornell University.
Goldstein, M. and Kavajecz, K. (2000). ‘‘Eighths, six-
teenths and market depth: Changes in tick size and
liquidity provision on the NYSE.’’ Journal of Finan-
cial Economics, 56: 125–149.
Goodhart, C. and Curcio, R. (1992). ‘‘Asset price dis-
covery and price clustering in the foreign ex-
change market.’’ Working Paper, London School
of Business.
Harris, L. (1997). ‘‘Decimalization: a review of the ar-
guments and evidence.’’ Working Paper, University
of Southern California.
DECIMAL TRADING IN THE U.S. STOCK MARKETS 441
Harris, L. (1999). ‘‘Trading in pennies: A survey of
the issues.’’ Working Paper, University of Sout hern
California.
He, Y. and Wu, C. (2003). ‘‘The effects of decimaliza-
tion on return volatility components, serial correl-
ation, and trading costs.’’ Working Paper.
He, Y. and C. Wu. (2004). ‘‘Price rounding and bid-ask
spreads before and after the decimalization.’’ Inter-
national Review of Economics and Finance, 13:
19–42.
Jones, C. and Lipson, M. (2001). ‘‘Sixteenths: direct
evidence on institutional trading costs.’’ Journal of
Financial Economics, 59: 253–278.
NASDAQ. (2001). ‘‘The impact of decimalization on
the NASDAQ stock market,’’ prepared by NAS-
DAQ Research Department.
NYSE. (2001). ‘‘Comparing bid-ask spreads on the
NYSE and NASDAQ immediately following NAS-
DAQ decimalization,’’ prepared by NYSE Research
Department.
442 ENCYCLOPEDIA OF FINANCE