From Individuals to Ecosystems 4th Edition - Chapter 12 docx
Bạn đang xem bản rút gọn của tài liệu. Xem và tải ngay bản đầy đủ của tài liệu tại đây (705.37 KB, 34 trang )
Chapter 12
Parasitism and Disease
12.1 Introduction: parasites, pathogens,
infection and disease
Previously, in Chapter 9, we defined a parasite as an organism
that obtains its nutrients from one or a very few host individuals,
normally causing harm but not causing death immediately.
We must follow this now with some more definitions, since there
are a number of related terms that are often misused, and it is
important not to do so.
When parasites colonize a host, that host is said to harbor an
infection. Only if that infection gives rise to symptoms that are
clearly harmful to the host should the host be said to have a disease. With many parasites, there is a presumption that the host
can be harmed, but no specific symptoms have as yet been
identified, and hence there is no disease. ‘Pathogen’ is a term that
may be applied to any parasite that gives rise to a disease (i.e.
is ‘pathogenic’). Thus, measles and tuberculosis are infectious
diseases (combinations of symptoms resulting from infections).
Measles is the result of a measles virus infection; tuberculosis is
the result of a bacterial (Mycobacterium tuberculosis) infection. The
measles virus and M. tuberculosis are pathogens. But measles is not
a pathogen, and there is no such thing as a tuberculosis infection.
Parasites are an important group of organisms in the most direct sense. Millions of people are killed each year by various types
of infection, and many millions more are debilitated or deformed
(250 million cases of elephantiasis at present, over 200 million cases
of bilharzia, and the list goes on). When the effects of parasites
on domesticated animals and crops are added to this, the cost in
terms of human misery and economic loss becomes immense. Of
course, humans make things easy for the parasites by living in
dense and aggregated populations and forcing their domesticated
animals and crops to do the same. One of the key questions we
will address in this chapter is: ‘to what extent are animals and plant
populations in general affected by parasitism and disease?’
Parasites are also important numerically. An organism in a natural environment that does not harbor several species of parasite
is a rarity. Moreover, many parasites and pathogens are host-specific
or at least have a limited range of hosts. Thus, the conclusion seems
unavoidable that more than 50% of the species on the earth, and
many more than 50% of individuals, are parasites.
12.2 The diversity of parasites
The language and jargon used by plant pathologists and animal
parasitologists are often very different, and there are important
differences in the ways in which animals and plants serve as
habitats for parasites, and in the way they respond to infection.
But for the ecologist, the differences are less striking than the
resemblances, and we therefore deal with the two together. One
distinction that is useful, though, is that between microparasites
and macroparasites (Figure 12.1) (May & Anderson, 1979).
Microparasites are small and often
micro- and
intracellular, and they multiply directly
macroparasites
within their host where they are often
extremely numerous. Hence, it is generally difficult, and usually inappropriate, to estimate precisely
the number of microparasites in a host. The number of infected
hosts, rather than the number of parasites, is the parameter
usually studied. For example, a study of a measles epidemic will
involve counting the number of cases of the disease, rather than
the number of particles of the measles virus.
Macroparasites have a quite different biology: they grow but do
not multiply in their host, and then produce specialized infective stages (microparasites do not do this) that are released to infect
new hosts. The macroparasites of animals mostly live on the body
or in the body cavities (e.g. the gut), rather than within the host
cells. In plants, they are generally intercellular. It is usually possible to count or at least estimate the numbers of macroparasites
in or on a host (e.g. worms in an intestine or lesions on a leaf ),
and the numbers of parasites as well as the numbers of infected
hosts can be studied by the epidemiologist.
348
CHAPTER 12
(a)
(c)
(b)
(d)
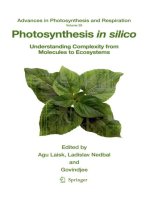
Figure 12.1 Plant and animal micro- and macroparasites.
(a) An animal microparasite: particles of the Plodia interpunctella
granulovirus (each within its protein coat) within a cell of their
insect host. (b) A plant microparasite: ‘club-root disease’ of
crucifers caused by multiplication of Plasmodiophora brassicae. (c)
An animal macroparasite: a tapeworm. (d) A plant macroparasite:
powdery mildew lesions. Reproduced by permission of: (a) Dr
Caroline Griffiths; (b) Holt Studios/Nigel Cattlin; (c) Andrew
Syred/Science Photo Library; and (d) Geoff Kidd/Science Photo
Library.
Cutting across the distinction
between micro- and macroparasites,
parasites can also be subdivided into
those that are transmitted directly from
host to host and those that require a vector or intermediate
host for transmission and therefore have an indirect life cycle.
The term ‘vector’ signifies an animal carrying a parasite from
direct and indirect
life cycles: vectors
host to host, and some vectors play no other role than as a
carrier; but many vectors are also intermediate hosts within
which the parasite grows and/or multiplies. Indeed, parasites
with indirect life cycles may elude the simple micro/macro
distinction. For example, schistosome parasites spend part of
their life cycle in a snail and part in a vertebrate (in some cases
a human). In the snail, the parasite multiplies and so behaves as
PARASITISM AND DISEASE
a microparasite, but in an infected human the parasite grows and
produces eggs but does not itself multiply, and so behaves as a
macroparasite.
12.2.1 Microparasites
Probably the most obvious microparasites are the bacteria and
viruses that infect animals (such as the measles virus and the typhoid
bacterium) and plants (e.g. the yellow net viruses of beet and
tomato and the bacterial crown gall disease). The other major group
of microparasites affecting animals is the protozoa (e.g. the trypanosomes that cause sleeping sickness and the Plasmodium species
that cause malaria). In plant hosts some of the simpler fungi behave
as microparasites.
The transmission of a microparasite from one host to another
can be in some cases almost instantaneous, as in venereal disease
and the short-lived infective agents carried in the water droplets
of coughs and sneezes (influenza, measles, etc.). In other species
the parasite may spend an extended dormant period ‘waiting’ for
its new host. This is the case with the ingestion of food or water
contaminated with the protozoan Entamoeba histolytica, which causes
amoebic dysentery, and with the plant parasite Plasmodiophora
brassicae, which causes ‘club-root disease’ of crucifers.
Alternatively, a microparasite may depend on a vector for
its spread. The two most economically important groups of
vector-transmitted protozoan parasites of animals are the trypanosomes, transmitted by various vectors including tsetse flies
(Glossina spp.) and causing sleeping sickness in humans and
nagana in domesticated (and wild) mammals, and the various
species of Plasmodium, transmitted by anopheline mosquitoes
and causing malaria. In both these cases, the flies act also as intermediate hosts, i.e. the parasite multiplies within them.
Many plant viruses are transmitted by aphids. In some ‘nonpersistent’ species (e.g. cauliflower mosaic virus), the virus is only
viable in the vector for 1 h or so and is often borne only on
the aphid’s mouthparts. In other ‘circulative’ species (e.g. lettuce
necrotic yellow virus), the virus passes from the aphid’s gut to
its circulatory system and thence to its salivary glands. Here, there
is a latent period before the vector becomes infective, but it
then remains infective for an extended period. Finally, there are
‘propagative’ viruses (e.g. the potato leaf roll virus) that multiply
within the aphid. Nematode worms are also widespread vectors
of plant viruses.
12.2.2 Macroparasites
The parasitic helminth worms are major macroparasites of
animals. The intestinal nematodes of humans, for example, all of
which are transmitted directly, are perhaps the most important
human intestinal parasites, both in terms of the number of
349
people infected and their potential for causing ill health. There
are also many types of medically important animal macroparasites
with indirect life cycles. For example, the tapeworms are intestinal parasites as adults, absorbing host nutrients directly across their
body wall and proliferating eggs that are voided in the host’s feces.
The larval stages then proceed through one or two intermediate
hosts before the definitive host (in these cases, the human) is
reinfected. The schistosomes, as we have seen, infect snails and
vertebrates alternately. Human schistosomiasis (bilharzia) affects
the gut wall where eggs become lodged, and also affects the blood
vessels of the liver and lungs when eggs become trapped there
too. Filarial nematodes are another group of long-lived parasites
of humans that all require a period of larval development in a
blood-sucking insect. One, Wucheria bancrofti, does its damage
(Bancroftian filariasis) by the accumulation of adults in the lymphatic
system (classically, but only rarely, leading to elephantiasis). Larvae
(microfilariae) are released into the blood and are ingested by
mosquitoes, which also transmit more developed, infective larvae
back into the host. Another filarial nematode, Onchocerca volvulus,
which causes ‘river blindness’, is transmitted by adult blackflies
(the larvae of which live in rivers, hence the name of the disease).
Here, though, it is the microfilariae that do the major damage
when they are released into the skin tissue and reach the eyes.
In addition, there are lice, fleas, ticks and mites and some fungi
that attack animals. Lice spend all stages of their life cycle on their
host (either a mammal or a bird), and transmission is usually by
direct physical contact between host individuals, often between
mother and offspring. Fleas, by contrast, lay their eggs and spend
their larval lives in the ‘home’ (usually the nest) of their host (again,
a mammal or a bird). The emerging adult then actively locates
a new host individual, often jumping and walking considerable
distances in order to do so.
Plant macroparasites include the higher fungi that give rise
to the mildews, rusts and smuts, as well as the gall-forming and
mining insects, and some flowering plants that are themselves
parasitic on other plants.
Direct transmission is common amongst the fungal macroparasites of plants. For example, in the development of mildew
on a crop of wheat, infection involves contact between a spore
(usually wind dispersed) and a leaf surface, followed by penetration of the fungus into or between the host cells, where it begins
to grow, eventually becoming apparent as a lesion of altered host
tissue. This phase of invasion and colonization precedes an infective stage when the lesion matures and starts to produce spores.
Indirect transmission of plant macroparasites via an intermediate host is common amongst the rust fungi. For example,
in black stem rust, infection is transmitted from an annual
grass host (especially the cultivated cereals such as wheat) to
the barberry shrub (Berberis vulgaris) and from the barberry
back to wheat. Infections on the cereal are polycyclic, i.e. within
a season spores may infect and form lesions that release
spores that infect further cereal plants. It is this phase of intense
350
CHAPTER 12
Figure 12.2 A cuckoo in the nest.
Reproduced by permission of
FLPA/Martin B. Withers.
multiplication by the parasite that is responsible for epidemic outbreaks of disease. On the other hand, the barberry is a long-lived
shrub and the rust is persistent within it. Infected barberry plants
may therefore serve as persistent foci for the spread of the rust
into cereal crops.
Plants in a number of families have
holo- and
become specialized as parasites on other
hemiparasitic plants
flowering plants. These are of two quite
distinct types. Holoparasites, such as
dodder (Cuscuta spp.), lack chlorophyll and are wholly dependent
on the host plant for their supply of water, nutrients and fixed
carbon. Hemiparasites, on the other hand, such as the mistletoes
(Phoraradendron spp.), are photosynthetic but have a poorly
developed root system of their own, or none at all. They form
connections with the roots or stems of other species and draw
most or all of their water and mineral nutrients from the host.
12.2.3 Brood and social parasitism
At first sight the presence of a section about cuckoos might
seem out of place here. Mostly a host and its parasite come from
very distant systematic groups (mammals and bacteria, fish and
tapeworms, plants and viruses). In contrast, brood parasitism
usually occurs between quite closely related species and even
between members of the same species. Yet the phenomenon falls
clearly within the definition of parasitism (a brood parasite
‘obtains its nutrients from one or a few host individuals, normally
causing harm but not causing death immediately’). Brood
parasitism is well developed in social insects (sometimes then
called social parasitism), where the parasites use workers of
another, usually very closely related species to rear their progeny
(Choudhary et al., 1994). The phenomenon is best known, however, amongst birds.
Bird brood parasites lay their eggs
the ecological
in the nests of other birds (Figure 12.2),
importance of brood
which then incubate and rear them.
parasitic birds
They usually depress the nesting success
of the host. Amongst ducks, intraspecific brood parasitism appears
to be most common. Most brood parasitism, however, is interspecific. About 1% of all bird species are brood parasites – including
about 50% of the species of cuckoos, two genera of finches,
five cowbirds and a duck (Payne, 1977). They usually lay only a
single egg in the host’s nest and may adjust the host’s clutch size
by removing one of its eggs. The developing parasite may evict
the host’s eggs or nestlings and harm any survivors by monopolizing parental care. There is therefore the potential for brood
parasites to have profound effects on the population dynamics of
the host species. However, the frequency of parasitized nests is
usually very low (less than 3%), and some time ago Lack (1963)
concluded that ‘the cuckoo is an almost negligible cause of egg
and nestling losses amongst English breeding birds’. None the less,
some impression of the potential importance of brood parasites
is apparent from the fact that magpies (Pica pica) in populations
that coexist with great spotted cuckoos (Clamator glandarius) in
Europe invest their reproductive effort into laying significantly larger
clutches of eggs than those that live free of brood parasitism (Soler
et al., 2001) – but those eggs are smaller in compensation. The presumption that this is an evolutionary response to the losses they
suffer due to the cuckoos is supported by the fact that magpies
that lay larger parasitized clutches do indeed have a higher probability of successfully raising at least some of their own offspring.
PARASITISM AND DISEASE
Highly host-specific, polymorphic
relationships have evolved among
brood parasites. For instance, the
cuckoo Cuculus canorum parasitizes many different host species,
but there are different strains (‘gentes’) within the cuckoo species.
Individual females of one strain favor just one host species and
lay eggs that match quite closely the color and markings of the
eggs of the preferred host. Thus, amongst cuckoo females there
is marked differentiation between strains in their mitochondrial
DNA, which is passed only from female to female, but not at
‘microsatellite’ loci within the nuclear DNA, which contains
material from the male parents, who do not restrict matings
to within their own strain (Gibbs et al., 2000). It has long been
suggested (Punnett, 1933) that this is possible because the genes
controlling egg patterning are situated on the W chromosome,
carried only by females. (In birds, unlike mammals, the females
are the heterogametic sex.) This has now been established –
though in great tits, Parus major, rather than in a species of brood
parasite (Gosler et al., 2000). Females produce eggs that resemble
those of their mothers and maternal grandmothers (from whom
they inherit their W chromosome) but not those of their paternal
grandmothers. Of course, if female cuckoos lay eggs that look like
those of the species with which they were reared, it is also
necessary for them to lay their eggs, inevitably or at least preferentially, in the nests of that species. This is most likely to be
the result of early ‘imprinting’ (i.e. a learned preference) within
the nest (Teuschl et al., 1998).
host-specific
polymorphisms: gentes
351
necrotrophic parasites are really predators, and once the host is
dead they are saprotrophs. But for as long as the host is alive,
necroparasites share many features with other types of parasite.
For a biotrophic parasite, the death of its host spells the end
of its active life. Most parasites are biotrophic. Lucilia cuprina, the
blowfly of sheep, however, is a necroparasite on an animal host.
The fly lays eggs on the living host and the larvae (maggots) eat
into its flesh and may kill it. The maggots continue to exploit the
carcass after death but they are now detritivores rather than
either parasites or predators. Necroparasites on plants include many
that attack the vulnerable seedling stage and cause symptoms
known as ‘damping-off’ of seedlings. Botrytis fabi is a typical
fungal necroparasite of plants. It develops in the leaves of the
bean Vicia faba, and the cells are killed, usually in advance of penetration. Spots and blotches of dead tissues form on the leaves and
the pods. The fungus continues to develop as a decomposer, and
spores are formed and then dispersed from the dead tissue, but
not while the host tissue is still alive.
Most necroparasites can therefore
necroparasites:
be regarded as pioneer saprotrophs.
pioneer saprotrophs
They are one jump ahead of competitors because they can kill the host (or
its parts) and so gain first access to the resources of its dead body.
The response of the host to necroparasites is never very subtle.
Amongst plant hosts, the most common response is to shed
the infected leaves, or to form specialized barriers that isolate the
infection. Potatoes, for example, form corky scabs on the tuber
surface that isolate infections by Actinomyces scabies.
12.3 Hosts as habitats
12.3.2 Host specificity: host ranges and zoonoses
The essential difference between the ecology of parasites and
that of free-living organisms is that the habitats of parasites
are themselves alive. A living habitat is capable of growth (in
numbers and/or size); it is potentially reactive, i.e. it can respond
actively to the presence of a parasite by changing its nature,
developing immune reactions to the parasite, digesting it, isolating or imprisoning it; it is able to evolve; and in the case of many
animal parasites, it is mobile and has patterns of movement that
dramatically affect dispersal (transmission) from one habitable host
to another.
12.3.1 Biotrophic and necrotrophic parasites
The most obvious response of a host to a parasite is for the whole
host to die. Indeed, we can draw a distinction between parasites
that kill and then continue life on the dead host (necrotrophic
parasites) and those for which the host must be alive (biotrophic
parasites). Necrotrophic parasites blur the tidy distinctions between
parasites, predators and saprotrophs (see Section 11.1). Insofar
as host death is often inevitable and sometimes quite rapid,
We saw in the chapters on the interactions between predators
and their prey that there is often a high degree of specialization of a particular predator species on a particular species of
prey (monophagy). The specialization of parasites on one or a
restricted range of host species is even more striking. For any
species of parasite (be it tapeworm, virus, protozoan or fungus)
the potential hosts are a tiny subset of the available flora and fauna.
The overwhelming majority of other organisms are quite unable
to serve as hosts: often, we do not know why.
There are, though, some patterns to this specificity. It seems,
for example, that the more intimate a parasite’s association with
a particular host individual, the more likely it is to be restricted
to a particular species of host. Thus, for example, most species
of bird lice, which spend their entire lives on one host, exploit
only one host species, whereas louse flies, which move actively
from one host individual to another, can use several species of
host (Table 12.1).
The delineation of a parasite’s
natural and
host range, however, is not always as
accidental hosts
straightforward as one might imagine.
352
CHAPTER 12
Table 12.1
Specialization in ectoparasites that feed on birds and mammals. (After Price, 1980.)
Percentage of species restricted to:
Scientific name
Common name and lifestyle
Philopteridae
Streblidae
Oestridae
Hystrichopsyllidae
Hippoboscidae
Bird lice (spend whole life on one host)
Blood-sucking flies (parasitize bats)
Botflies (females fly between hosts)
Fleas (jump between hosts)
Louse flies (are highly mobile)
Species outside the host range are relatively easily characterized:
the parasite cannot establish an infection within them. But for
those inside the host range, the response may range from a
serious pathology and certain death to an infection with no overt
symptoms. What is more, it is often the ‘natural’ host of a parasite, i.e. the one with which it has coevolved, in which infection
is asymptomatic. It is often ‘accidental’ hosts in which infection
gives rise to a frequently fatal pathology. (‘Accidental’ is an
appropriate word here, since these are often dead-end hosts,
that die too quickly to pass on the infection, within which the
pathogen cannot therefore evolve – and to which it cannot therefore be adapted.)
These issues take on not just parasitological but also medical importance
plague: a zoonotic
in the case of zoonotic infections: infecinfection with
tions that circulate naturally, and have
humans as
coevolved, in one or more species of
accidental hosts
wildlife but also have a pathological
effect on humans. A good example is bubonic and pneumonic
plague: the human diseases caused by the bacterium Yersinia
pestis. Y. pestis circulates naturally within populations of a number of species of wild rodent: for example, in the great gerbil,
Rhombomys opimus, in the deserts of Central Asia, and probably
in populations of kangaroo rats, Dipodomys spp., in similar habitats in southwestern USA. (Remarkably, little is known about the
ecology of Y. pestis in the USA, despite its widespread nature and
potential threat (see Biggins & Kosoy, 2001).) In these species, there
are few if any symptoms in most cases of infection. There are,
however, other species where Y. pestis infection is devastating. Some
of these are closely related to the natural hosts. In the USA, populations of prairie dogs, Cynomys spp., also rodents, are regularly
annihilated by epidemics of plague, and the disease is an important conservation issue. But there are also other species, only very
distantly related to the natural hosts, where untreated plague is
usually, and rapidly, fatal. Amongst these are humans. Why
such a pattern of differential virulence so often occurs – low
virulence in the coevolved host, high virulence in some unrelated
hosts, but unable even to cause an infection in others – is an important unanswered question in host–pathogen biology. The issue of
host–pathogen coevolution is taken up again in Section 12.8.
Number of species
1 host
2 or 3 hosts
More than 3 hosts
122
135
53
172
46
87
56
49
37
17
11
35
26
29
24
2
9
25
34
59
12.3.4 Habitat specificity within hosts
Most parasites are also specialized to live only in particular
parts of their host. Malarial parasites live in the red blood cells of
vertebrates. Theileria parasites of cattle, sheep and goats live in
the lymphocytes of the mammal, and in the epithelial cells, and
later in the salivary gland cells, of the tick that is the disease vector, and so on.
By transplanting parasites experiparasites may search
mentally from one part of the host’s
for habitats within
body to another, it can be shown that
their hosts
many home in on target habitats.
When nematode worms (Nippostrongylus brasiliensis) were transplanted from the jejunum into the anterior and posterior parts of the small intestine of rats, they migrated back to their
original habitat (Alphey, 1970). In other cases, habitat search
may involve growth rather than bodily movement. For instance,
loose smut of wheat, the fungus Ustilago tritici, infects the exposed stigmas of wheat flowers and then grows as an extending
filamentous system into the young embryo. Growth continues
in the seedling, and the fungus mycelium keeps pace with the
growth of the shoot. Ultimately, the fungus grows rapidly into
the developing flowers and converts them into masses of spores.
12.3.5 Hosts as reactive environments: resistance,
recovery and immunity
Any reaction by an organism to the
invertebrates
presence of another depends on it
recognizing a difference between what is ‘self’ and what is
‘not self’. In invertebrates, populations of phagocytic cells are
responsible for much of a host’s response to invaders, even to
inanimate particles. In insects, hemocytes (cells in the hemolymph) isolate infective material by a variety of routes, especially
encapsulation – responses that are accompanied by the production of a number of soluble compounds in the humoral system
that recognize and respond to nonself material, some of which
also operate at the midgut barrier in the absence of hemocytes
(Siva-Jothy et al., 2001).
PARASITISM AND DISEASE
Entry block
neutralization (toxin)
Block
Lysis (bacteria)
Interferon
Lysozyme
Complement
Some
bacteria
Healing
Activation
Ad
Acute
inflammation
Injury
Tissue
damage
Mast
cell
B
s
Pr e
PMN
Some
bacteria
Chronic
inflammation
h
Antibody
nce
ere
ati
ent
on
T
A c ti v at i on
MAC
Specific
antigens
lp
Viruses
(all bacteria
viruses, etc.)
NK
Cytotoxicity (virus)
Phagocytosis
Tissues
In vertebrates there is also a phagocytic response to material that is not
self, but their armory is considerably
extended by a much more elaborate
process: the immune response (Figure 12.3). For the ecology of
parasites, an immune response has two vital features: (i) it may
enable a host to recover from an infection; and (ii) it can give
a once-infected host a ‘memory’ that changes its reaction if
the parasite strikes again, i.e. the host has become immune to
reinfection. In mammals, the transmission of immunoglobulins
to the offspring can sometimes even extend protection to the next
generation.
For most viral and bacterial infections of vertebrates, the
colonization of the host is a brief and transient episode in the
host’s life. The parasites multiply within the host and elicit a strong
immunological response. By contrast, the immune responses elicited by many of the macroparasites and protozoan microparasites tend to be weaker. The infections themselves, therefore, tend
to be persistent, and hosts may be subject to repeated reinfection.
Indeed, responses to microparasites and helminths seem often to be
contrasting responses
dominated by different pathways within
to micro- and
the immune system (MacDonald et al.,
macroparasites
2002), and these pathways can downregulate each other: helminth infection may therefore increase
the likelihood of microparasitic infection and vice versa (Behnke
et al., 2001). Thus, for example, successful treatment of worm
infections in patients that were also infected with HIV led to a
significant drop in their HIV viral load (Wolday et al., 2002).
vertebrates: the
immune response
Adaptive
Natural (‘nonspecific’)
He
Figure 12.3 The immune response.
The mechanisms mediating resistance to
infection can be divided into ‘natural’ or
‘nonspecific’ (left) and ‘adaptive’ (right),
each composed of both cellular elements
(lower half ) and humoral elements (i.e.
free in the serum or body fluids; upper
half ). The adaptive response begins when
the immune system is stimulated by an
antigen that is taken up and processed by a
macrophage (MAC). The antigen is a part
of the parasite, such as a surface molecule.
The processed antigen is presented to T
and B lymphocytes. T lymphocytes respond
by stimulating various clones of cells, some
of which are cytotoxic (NK, natural killer
cells), as others stimulate B lymphocytes to
produce antibodies. The parasite that bears
the antigen can now be attacked in a
variety of ways. PMN, polymorphonuclear
neutrophil. (After Playfair, 1996.)
353
Cytotoxicity
Myeloid cells
Lymphocytes
The modular structure of plants, the
plants
presence of cell walls and the absence
of a true circulating system (such as
blood or lymph) all make any form of immunological response
an inefficient protection. There is no migratory population of phagocytes in plants that can be mobilized to deal with invaders. There
is, however, growing evidence that higher plants possess complex
systems of defense against parasites. These defenses may be constitutive – physical or biological barriers against invading organisms that are present whether the parasite is present or not – or
inducible, arising in response to pathogenic attack (Ryan &
Jagendorf, 1995; Ryan et al., 1995). After a plant has survived a
pathogenic attack, ‘systematic acquired resistance’ to subsequent
attacks may be elicited from the host. For example, tobacco
plants infected on one leaf with tobacco mosaic virus can produce local lesions that restrict the virus infection locally, but the
plants then also become resistant to new infections not only by
the same virus but to other parasites as well. In some cases the
process involves the production of ‘elicitins’, which have been
purified and shown to induce vigorous defense responses by the
host (Yu, 1995).
Central to our understanding of all
the costliness of host
host defensive responses to parasites
defense
is the belief that these responses are
costly – that energy and material
invested in the response must be diverted away from other
important bodily functions – and that there must therefore be
a trade-off between the response and other aspects of the life
history: the more that is invested in one, the less can be invested
354
CHAPTER 12
Table 12.2 Estimated energetic costs (percentage increase in
resting metabolic rate relative to controls) made by various
vertebrate hosts when mounting an immune response to a range
of ‘challenges’ that induce such a response. (After Lochmiller &
Derenberg, 2000.)
Species
Immune challenge
Cost (%)
Human
Sepsis
Sepsis and injury
Typhoid vaccination
30
57
16
Laboratory rat
Interleukin-1 infusion
Inflammation
18
28
Laboratory mouse
Keyhole limpet hemocyanin injection
30
Sheep
Endotoxin
10–49
in the others. Evidence for this in vertebrates is reviewed by
Lochmiller and Derenberg (2000), who illustrate, for example, the
energetic price (in terms of an increase in resting metabolic rate)
paid by a number of vertebrates when mounting an immune
response (Table 12.2).
12.3.6 The consequences of host reaction: S-I-R
The variations in mechanisms used by different types of organism to fight infection are clearly interesting and important to
parasitologists, medics and veterinarians. They are also important to ecologists working on particular systems, where an
understanding of the overall biology is essential. But from the
perspective of an ecological overview, the consequences for the
hosts of these responses are more important, both at the whole
organism and the population levels. First, these responses
determine where individuals are on the spectrum from ‘wholly
susceptible’ to ‘wholly resistant’ to infection – and if they
become infected, where they are on the spectrum from being
killed by infection to being asymptomatic. Second, in the case
of vertebrates, the responses determine whether an individual
still expresses a naive susceptibility or has acquired an immunity
to infection.
These individual differences then determine, for a population,
the structure of that population in terms of the numbers of
individuals in the different classes. Many mathematical models
of host–pathogen dynamics, for example, are referred to as S-I-R
models, because they follow the changing numbers of susceptible, infectious and recovered (and immune) individuals in the population. The variations at the population level are then crucial
in molding the features at the heart of ecology: the distributions
and abundances of the organism concerned. We return to these
questions of epidemic behavior in Section 12.4.2 and thereafter
in this chapter.
12.3.7 Parasite-induced changes in growth and behavior
Some parasites induce a new programed change in the development of the host. The agromyzid flies and cecidomyid and cynipid
wasps that form galls on higher plants are remarkable examples.
The insects lay eggs in host tissue, which responds by renewed
growth. The galls that are produced are the result of a morphogenetic response that is quite different from any structure that
the plant normally produces. Just the presence, for a time, of
the parasite egg may be sufficient to start the host tissue into a
morphogenetic sequence that can continue even if the developing larva is removed. Amongst the gall-formers that attack oaks
(Quercus spp.), each elicits a unique morphogenetic response
from the host (Figure 12.4).
Fungal and nematode parasites of
galls
plants can also induce morphogenetic
responses, such as enormous cell
enlargement and the formation of nodules and other ‘deformations’. After infection by the bacterium Agrobacterium tumefaciens,
gall tissue can be recovered from the host plant that lacks the
parasite but has now been set in its new morphogenetic pattern
of behavior; it continues to produce gall tissue. In this case, the
parasite has induced a genetic transformation of the host cells.
Some parasitic fungi also ‘take control’ of their host plant and castrate or sterilize it. The fungus Epichloe typhina, which parasitizes
grasses, prevents them from flowering and setting seed – the grass
remains a vegetatively vigorous eunuch, leaving descendant
parasites but no descendants of its own.
Most of the responses of modular
(sometimes dramatic)
organisms to parasites (and indeed
changes in host
other environmental stimuli) involve
behavior
changes in growth and form, but in
unitary organisms the response of hosts
to infection more often involves a change in behavior: this often
increases the chance of transmission of the parasite. In worminfected hosts, irritation of the anus stimulates scratching, and
parasite eggs are then carried from the fingers or claws to the
mouth. Sometimes, the behavior of infected hosts seems to
maximize the chance of the parasite reaching a secondary host
or vector. Praying mantises have been observed walking to the
edge of a river and apparently throwing themselves in, whereupon, within a minute of entering the water, a gordian worm
(Gordius) emerges from the anus. This worm is a parasite of
terrestrial insects but depends on an aquatic host for part of its
life cycle. It seems that an infected host develops a hydrophilia
that ensures that the parasite reaches a watery habitat. Suicidal
mantises that are rescued will return to the riverbank and throw
themselves in again.
PARASITISM AND DISEASE
(a)
(h)
(m)
(b)
(c)
(d)
(i)
(j)
(n)
(o)
(e)
(f)
(k)
(p)
(q)
355
(g)
(l)
(r)
(s)
Figure 12.4 Galls formed by wasps of the genus Andricus on oaks (Quercus petraea, Q. robur, Q. pubescens or Q. cerris). Each figure shows
a section through a gall induced by a different species of Andricus. The dark colored areas are the gall tissue and the central lighter areas
are the cavities containing the insect larva. (From Stone & Cook, 1998.)
12.3.8 Competition within hosts
Since hosts are the habitat patches for
their parasites, it is not surprising that
intra- and interspecific competition,
observed in other species in other habitats, can also be observed
in parasites within their hosts. There are many examples of
the fitness of individual parasites decreasing within a host with
increasing overall parasite abundance (Figure 12.5a), and of the
overall output of parasites from a host reaching a saturation level
(Figure 12.5b) reminiscent of the ‘constant final yield’ found in
many plant monocultures subject to intraspecific competition (see
Section 5.5.1).
However, in vertebrates at least,
we need to be cautious in interpreting
competition or the
such results simply as a consequence of
immune response?
intraspecific competition for limited
resources, since the intensity of the immune reaction elicited from
a host itself typically depends on the abundance of parasites.
A rare attempt to disentangle these two effects utilized the availability of mutant rats lacking an effective immune response
(Paterson & Viney, 2002). These and normal, control rats were
subjected to experimental infection with a nematode, Strongyloides
constant final yield?
ratti, at a range of doses. Any reduction in parasite fitness with
dose in the normal rats could be due to intraspecific competition
and/or an immune response that itself increases with dose;
but clearly, in the mutant rats only the first of these is possible.
In fact, there was no observable response in the mutant rats
(Figure 12.6), indicating that at these doses, which were themselves similar to those observed naturally, there was no evidence
of intraspecific competition, and that the pattern observed in the
normal rats is entirely the result of a density-dependent immune
response. Of course, this does not mean that there is never
intraspecific competition amongst parasites within hosts, but it
does emphasize the particular subtleties that arise when an
organism’s habitat is its reactive host.
We know from Chapter 8 that niche differentiation, and especially species having more effect on their own populations than
on those of potential competitors, lies at the heart of our understanding of competitor coexistence. We noted earlier that parasites typically specialize on particular sites or tissues within their
hosts, suggesting ample opportunity for niche differentiation.
And in vertebrates at least, the specificity of the immune
response also means that each parasite tends to have its greatest
adverse effect on its own population. On the other hand, many
parasites do have host tissues and resources in common; and it
CHAPTER 12
(a)
(a)
Number of offspring per flea
300
6 founders
250
200
150
20 founders
100
10,000
Reproductive output
356
1000
100
10
50 founders
50
0
1
Hatching
Midnesting
End of nesting
10
100
Dose (worms)
1000
10
100
Dose (worms)
1000
(b)
1
500
400
300
Survivorship
Mean wet weight of worms (mg)
(b)
200
100
0
1 2
4
8
Size of infection
0.1
16
0.01
Figure 12.5 Density-dependent responses of parasites within
their hosts. (a) The relationship between the number of fleas
Ceratophyllus gallinae (‘founders’) added to the nests of blue tits
and the number of offspring per flea (mean ± SE). The greater
the density, the lower the reproductive rate of the fleas. This
differential increased from an initial assessment at blue tit egg
hatching, through to the end of the nestling period. (After Tripet
& Richner, 1999.) (b) The mean weight of worms per infected
mouse reaches a ‘constant final yield’ after deliberate infection
at a range of levels with the tapeworm Hymenolepis microstoma.
(After Moss, 1971.)
is easy to see that the presence of one parasite species may make
a host less vulnerable to attack by a second species (for example,
as a result of inducible responses in plants), or more vulnerable
(simply because of the host’s weakened state). All in all, it is no
surprise that the ecology of parasite competition within hosts is
a subject with no shortage of unanswered questions.
None the less, some evidence
for interspecific competition amongst
interspecific
parasites comes from a study of two
competition
species of nematode, Howardula aoronyamongst parasites
mphium and Parasitylenchus nearcticus,
that infect the fruit-fly Drosophila recens (Perlman & Jaenike, 2001).
Of these, P. nearcticus is a specialist, being found only in D. recens,
whereas H. aoronymphium is more of a generalist, capable of infect-
Figure 12.6 Host immune responses are necessary for density
dependence in infections of the rat with the nematode Strongyloides
ratti. (a) Overall reproductive output increases in line with the initial
dose in mutant rats without an immune response (᭹; slope not
significantly different from 1), but with an immune response (4) it
is roughly independent of initial dose, i.e. it is regulated (slope = 0.15,
significantly less than 1, P < 0.001). (b) Survivorship is independent
of the initial dose in mutant rats without an immune response
(᭹; slope not significantly different from 0), but with an immune
response (4) it declines (slope = −0.62, significantly less than 0,
P < 0.001). (After Paterson & Viney, 2002.)
ing a range of Drosophila species. In addition, P. nearcticus has the
more profound effect on its host, typically sterilizing females,
whereas H. aoronymphium seems to reduce host fecundity by only
around 25% (though this itself represents a drastic reduction in
host fitness). It is also apparent that whereas H. aoronymphium is
profoundly affected by P. nearcticus when the two coexist within
the same host in experimental infections (Figure 12.7a), this
effect is not reciprocated (Figure 12.7b). Overall, therefore, competition is strongly asymmetric between the two parasites (as
interspecific competition frequently is; see Section 8.3.3): the
specialist P. nearcticus is both a more powerful exploiter of its host
PARASITISM AND DISEASE
(b)
0.4
29
4
13
21
11
70
10
1
0.3
0.2
0.1
Offspring numbers
Motherworm size (mm2)
(a)
357
60
40
50
11
40
30
46
17
83
20
10
0
1
2
Motherworms per fly
3
0
200
400
Treatment
800
Figure 12.7 (a) Mean size ± SE (mm2, longitudinal section area) of Howardula aoronymphium motherworms in 1-week-old hosts,
Drosophila recens, in single and mixed infections. Size is a good index of fecundity in H. aoronymphium. The hosts contained either one,
two or three H. aoronymphium motherworms, having been reared on a diet contaminated with either H. aoronymphium (dark bars) or
mixed infections (H. aoronymphium and Parasitylenchus nearcticus; light bars). Size (fecundity) was consistently lower in mixed infections.
(b) Number of P. nearcticus offspring (i.e. fecundity) ± SE, in single (dark bars) and mixed (light bars) infections. Numbers above the bars
indicate sample sizes of flies; treatment numbers refer to the numbers of nematodes added to the diet. Fecundity was not reduced in
mixed infections. (After Perlman & Jaenike, 2001.)
(reducing it to lower densities through its effect on fecundity) and
stronger in interference competition. Coexistence between the
species occurs, presumably, because the fly host provides the whole
of both the fundamental and the realized niche of P. nearcticus,
whereas it is only part of the realized niche of H. aoronymphium.
12.4 Dispersal (transmission) and dispersion
of parasites amongst hosts
12.4.1 Transmission
Janzen (1968) pointed out that we
could usefully think of hosts as islands
that are colonized by parasites. By using the same vocabulary,
this brought host–parasite relationships into the same arena as
MacArthur and Wilson’s (1967) study of island biogeography
(see Section 21.5). A human colonized by the malarial parasite is
in a sense an inhabited island or patch. The chances of a mosquito
vector carrying the parasite from one host to another correspond
to the varying distances between different islands. Populations of
parasites are thus maintained by the continual colonization of
new host patches as old infected patches (hosts) die or become
immune to new infection. The whole parasite population is then
a ‘metapopulation’ (see Section 6.9),
with each host supporting a subpopudirect and indirect
lation of the whole.
transmission; shortDifferent species of parasite are, of
and long-lived agents
course, transmitted in different ways
hosts as islands
between hosts. The most fundamental distinction, perhaps, is
that between parasites that are transmitted directly from host
to host and those that require a vector or intermediate host for
transmission. Amongst the former, we should also distinguish
between those where infection is by physical contact between hosts
or by a very short-lived infective agent (borne, for example, in
coughs and sneezes), and those where hosts are infected by longlived infective agents (e.g. dormant and persistent spores).
We are largely familiar, through our own experience, with the
nature of these distinctions amongst animal pathogens; but
essentially the same patterns apply in plants. For example, many
soil-borne fungal diseases are spread from one host plant to
another by root contacts, or by the growth of the fungus
through the soil from a base established on one plant, which
gives it the resources from which to attack another. The honey
fungus Armillaria mellea spreads through the soil as a bootlacelike ‘rhizomorph’ and can infect another host (usually a woody
tree or shrub) where it meets their roots. In naturally diverse
communities, such spread is relatively slow, but when plants
occur as ‘continents’ of continuous interplant contacts, there are
greatly increased opportunities for infection to spread. For diseases that are spread by wind, the foci of infection may become
established at great distances from the origin; but the rate at which
an epidemic develops locally is strongly dependent on the distance
between individuals. It is characteristic of wind-dispersed propagules (spores, but also pollen and seeds) that the distribution
achieved by dispersal is usually strongly ‘leptokurtic’: a few
propagules go a very long way but the majority are deposited close
to the origin.
358
CHAPTER 12
12.4.2 Transmission dynamics
12.4.3 Contact rates: density- and frequency-dependent
transmission
Transmission dynamics are in a very real sense the driving force
behind the overall population dynamics of pathogens, but they
are often the aspect about which we have least data (compared,
say, to the fecundity of parasites or the death rate of infected hosts).
We can, none the less, build a picture of the principles behind
transmission dynamics (Begon et al., 2002).
The rate of production of new infections in a population, as
a result of transmission, depends on the per capita transmission
rate (the rate of transmission per susceptible host ‘target’) and the
number of susceptible hosts there are (which we can call S).
In turn, per capita transmission rate is usually proportional, first,
to the contact rate, k, between susceptible hosts and whatever
it is that carries the infection. It also depends on the probability,
p, that a contact that might transmit infection actually does so.
Clearly, this probability depends on the infectiousness of the
parasite, the susceptibility of the host, and so on. Putting these
three components together we can say:
the rate of production of new infections = k · p · S.
the contact rate
(12.1)
The details of the contact rate, k,
are different for different types of
transmission.
• For parasites transmitted directly from host to host, we deal
with the rate of contact between infected hosts and susceptible (uninfected) hosts.
• For hosts infected by long-lived infective agents that are
isolated from hosts, it is the rate of contact between these and
susceptible hosts.
• With vector-transmitted parasites we deal with the contact rate
between host and vector (the ‘host-biting rate’), and this goes
to determine two key transmission rates: from infected hosts
to susceptible vectors and from infected vectors to susceptible
hosts.
But what is it that determines the per capita contact rate
between susceptibles and infecteds? For long-lived infective
agents, it is usually assumed that the contact rate is determined
essentially by the density of these agents. For direct and vectorborne transmission, however, the contact rate needs to be broken
down further into two components. The first is the contact rate
between a susceptible individual and all other hosts (direct transmission) or all vectors; we can call this c. The second is then the
proportion of those hosts or vectors that are infectious; we call
this I/N, where I is the number of infecteds and N the total number of hosts (or vectors). Our expanded equation is now:
the rate of production of new infections
= c · p · S · (I/N ).
We need to try to understand c and I/N in turn.
(12.2)
For most infections, it has often been assumed that the contact
rate c increases in proportion to the density of the population,
N/A, where A is the area occupied by the population, i.e. the denser
the population, the more hosts come into contact with one
another (or vectors contact hosts). Assuming for simplicity that
A remains constant, the Ns in the equation then cancel, all the
other constants can be combined into
density-dependent
a single constant β, the ‘transmission
transmission
coefficient’, and the equation becomes:
the rate of production of new infections = β · S · I.
(12.3)
This, unsurprisingly, is known as density-dependent transmission.
On the other hand, it has long been asserted that for sexually
transmitted diseases, the contact rate is constant: the frequency
of sexual contacts is independent of
frequency-dependent
population density. This time the
transmission
equation becomes:
the rate of production of new infections
= β′ · S · (I/N),
(12.4)
where the transmission coefficient again combines all the other
constants but this time acquires a ‘prime’, β′, because the combination of constants is slightly different. This is known as frequencydependent transmission.
Increasingly, however, it has become apparent that the
assumed simple correspondence between sexual transmission
and frequency dependence on the one hand, and all other types
of infection and density dependence on the other, is incorrect. For
example, when density and frequency dependence were compared
as descriptors of the transmission dynamics of cowpox virus, which
is not sexually transmitted, in natural populations of bank voles
(Clethrionomys glareolus), frequency dependence appeared, if anything, to be superior (Begon et al., 1998). Frequency dependence
appears to be a better descriptor than density dependence, too, for
a number of (nonsexually transmitted) infections of insects (Fenton
et al., 2002). One likely explanation in such cases is that sexual
contact is not the only aspect of behavior for which the contact
rate varies little with population density: many social contacts,
territory defense for instance, may come into the same category.
Secondly, β · S · I and β′ · S · I/N
are themselves increasingly recognized
ends of a spectrum
(e.g. McCallum et al., 2001) as, at best,
benchmarks against which real examples of transmission might
be measured, rather than exact descriptors of the dynamics; or
perhaps as ends of a spectrum along which real transmission terms
could be assembled. For example, fitting the term βS xI y to the
transmission dynamics of granulovirus infection in larvae of the
moth Plodia interpunctella revealed that the best fit was not to ‘pure’
density-dependent transmission, βSI, but to β′S1.12I 0.14 (Figure 12.8).
PARASITISM AND DISEASE
(a)
(b)
0.5
Transmission coefficient
359
y = 0.253 + 0.007x
0.5
0.4
0.4
0.3
0.3
0.2
0.2
0.1
0.1
y = 0.661 x (–0.867)
0.0
5
10
15
20
0.0
1
Host density
2
3
4
Density of infectious cadavers
Figure 12.8 Estimating the transmission coefficient at various densities of (a) susceptible hosts and (b) infectious cadavers during the
transmission of a granulovirus amongst moths, Plodia interpunctella, showed that the coefficient appeared to increase with the former and
decrease with the latter. This is contrary to the expectations from density-dependent transmission (an apparently constant coefficient in
both cases). (After Knell et al., 1998.)
Day 6
Day 10
Day 14
Figure 12.9 The spatial spread of damping-off disease in a population of radish plants, Raphanus sativus, caused by the fungus Rhizoctonia
solani. Following initiation of the disease at isolated plants (light squares), the epidemic spreads rapidly to neighboring plants (dark
squares), resulting in patches of damped-off plants (picture on the right). (Courtesy of W. Otten and C.A. Gilligan, Cambridge University.)
In other words, transmission was greater than expected (exponent
greater than 1) at higher densities of susceptible hosts, probably
because hosts at higher densities were short of food, moved more,
and consumed more infectious material. But it was lower than
expected (exponent less than 1) at higher densities of infectious
host cadavers, probably because of strongly differential susceptibility amongst the hosts, such that the most susceptible become
infected even at low cadaver densities, but the least susceptible
remain uninfected even as cadaver density increases.
Turning from the contact rate, c, to
the I/N term, there has usually been
local hot spots
a simplifying assumption that this can
be based on numbers from the whole of a population. In reality,
however, transmission typically occurs locally, between nearby
individuals. In other words, use of such a term assumes either
that all individuals in a population are intermingling freely with
one another, or, slightly more realistically, that individuals are
distributed approximately evenly across the population, so that all
susceptibles are subject to roughly the same probability of a contact being with an infectious individual, I/N. The reality, however,
is that there are likely to be hot spots of infection in a population,
where I/N is high, and corresponding cool zones. Transmission,
therefore, often gives rise to spatial waves of infection passing
through a population (e.g. Figure 12.9), rather than simply the
CHAPTER 12
overall rise in infection implied by a global transmission term like
βSI. This illustrates a very general point in modeling: that is, the
price paid in diminished realism when a complex process is
boiled down into a simple term (such as βSI). None the less,
as we shall see (and have seen previously in other contexts)
without such simple terms to help us, progress in understanding
complex processes would be impossible.
12.4.4 Host diversity and the spatial spread of disease
The further that hosts are isolated from one another, the more
remote are the chances that a parasite will spread between them.
It is perhaps no surprise, then, that the major disease epidemics
known amongst plants have occurred in crops that are not
islands in a sea of other vegetation, but ‘continents’ – large areas
of land occupied by one single species (and often by one single
variety of that species). Conversely, the spatial spread of an infection can be slowed down or even stopped by mixtures of susceptible
and resistant species or varieties (Figure 12.10). A rather similar
effect is described in Section 22.3.1.1, for Lyme disease in the United
States, where a variety of host species that are incompetent in
transmitting the spirochete pathogen ‘dilute’ transmission between
members of the most competent species.
In agricultural practice, resistant cultivars offer a challenge to
evolving parasites: mutants that can attack the resistant strain have
an immediate gain in fitness. New, disease-resistant crop varieties
therefore tend to be widely adopted into commercial practice; but
they then often succumb, rather suddenly, to a different race of
the pathogen. A new resistant strain of crop is then used, and in
due course a new race of pathogen emerges. This ‘boom and bust’
cycle is repeated endlessly and keeps the pathogen in a continually
evolving condition, and plant breeders in continual employment.
An escape from the cycle can be gained by the deliberate mixing
of varieties so that the crop is dominated neither by one virulent
race of the pathogen nor by one susceptible form of the crop itself.
In nature there may be a particular
risk of disease spreading from perennial
the Janzen–Connell
plants to seedlings of the same species
effect
growing close to them. If this were
commonly the case, it could contribute to the species richness of
communities by preventing the development of monocultures.
This has been called the Janzen–Connell effect. In an especially
complete test for the effect, Packer and Clay (2000) showed for
black cherry, Prunus serotina, trees in a woodland in Indiana, first,
that seedlings were indeed less likely to survive close to their
parents (Figure 12.11a). Second, they showed that it was
something in the soil close to the parents that reduced survival
(Figure 12.11b), though this was only apparent at high seedling
density, and the effect could be removed by sterilizing the soil.
This suggests a pathogen, which high densities of seedlings, close
to the parent, amplify and transmit to other seedlings. In fact, dying
(a)
400
Infected individuals
360
300
200
100
0
4
6
8
10
12
14
16
Time (days)
(b)
Figure 12.10 The effect of resistant forms in slowing down
the spread of damping-off epidemics caused by the fungus
Rhizoctonia solani. (a) Progress of epidemics in populations
following the introduction of R. solani into a susceptible
population (radish, Raphanus sativus: 7), a partially resistant
population (mustard, Sinapsis alba: ᭹) or a 50 : 50 mixture of the
two (᭡). (b) A simulation showing that when 40% of the plants in
a population are of a resistant variety, the spread of a damping-off
epidemic following its introduction can be prevented. White
squares are resistant plants, black squares are infected, and gray
squares susceptible. Infection can only be transmitted to an
adjacent plant (sharing a ‘side’). Here, the epidemic can spread
no further. (Courtesy of W. Otten, J. Ludlam and C.A. Gilligan,
Cambridge University.)
PARASITISM AND DISEASE
(a)
(b)
361
(c)
300
0.6
200
0.4
100
0.2
0–
5– 10– 15– 20– 25–
4.99 9.99 14.99 19.99 24.99 30
Distance to parent (m)
0.0
90
80
70
60
Low density
High density
Sterilized
Unsterilized
50
40
30
20
Close
Far
Distance to parent
Seedling survival (%)
0.8
Seedling survival (%)
400
0
100
1.0
500
Probability of seedling
survival
Number of germinating seedlings
100
80
60
40
20
0
C1 C2 P1 P2 P3
Treatment
Figure 12.11 (a) The relationship between distance to parent, initial seedling germination (᭡) and probability of seedling survival over
time (dashed lines: 7, after 4 months; ᭹, after 16 months); n = 974 seedlings from beneath six trees. (b) The effect of distance from parent,
seedling density and soil sterilization on seedling survival when seedlings were grown in pots containing soil collected close to or far
from their parents. In high-density treatments, survival was significantly greater after the soil collected close to the tree was sterilized.
(P < 0.0001). (c) Seedling survival in control and pathogen inoculation treatments (n = 40 per treatment). Control 1, potting mix only;
control 2, 5 ml of sterile nutrient-rich fungal growth medium plus potting mix; P1, P2 and P3, three 5 ml replicates of pathogen
inoculum plus potting mix. Survival was significantly lower in pathogen treatments compared with controls after 19 days
(X2 = 13.8, d.f. = 4, P < 0.05). (After Packer & Clay, 2000.)
seedlings were observed with the symptoms of ‘damping off’,
and the damping-off fungus, Pythium sp., was isolated from dying
seedlings and itself caused a significant reduction in seedling
survival (Figure 12.11c).
12.4.5 The distribution of parasites within host
populations: aggregation
Transmission naturally gives rise to an ever-changing dispersion
of parasites within a population of hosts. But if we freeze the frame
(or more correctly, carry out a cross-sectional survey of a population at one point in time), then we generate a distribution of
parasites within the host population. Such distributions are
rarely random. For any particular species of parasite it is usual
for many hosts to harbor few or no parasites, and a few hosts
to harbor many, i.e. the distributions are usually aggregated or
clumped (Figure 12.12).
In such populations, the mean
prevalence, intensity
density of parasites (mean number per
and mean intensity
host) may have little meaning. In a
human population in which only one
person is infected with anthrax, the mean density of Bacillus
anthracis is a particularly useless piece of information. A more
useful statistic, especially for microparasites, is the prevalence of
infection: the proportion or percentage of a host population that
is infected. On the other hand, infection may often vary in severity between individuals and is often clearly related to the number
of parasites that they harbor. The number of parasites in or on a
particular host is referred to as the intensity of infection. The mean
intensity of infection is then the mean number of parasites per host
in a population (including those hosts that are not infected).
Aggregations of parasites within hosts may arise because individual hosts vary in their susceptibility to infection (whether due
to genetic, behavioral or environmental factors), or because
individuals vary in their exposure to parasites (Wilson et al.,
2002). The latter is especially likely to arise because of the local
nature of transmission, and especially when hosts are relatively
immobile. Infection then tends to be concentrated, at least initially,
close to an original source of infection, and to be absent in individuals in areas that infection has yet to reach, or where it was
previously but the hosts have recovered. It is clear, for example,
even without explicit data on the distribution of parasites amongst
hosts, that the parasites in Figure 12.9, at any one point in time,
were aggregated at high intensities around the wave front – but
absent ahead of and after it.
12.5 Effects of parasites on the survivorship,
growth and fecundity of hosts
According to strict definition, parasites cause harm to their host.
But it is not always easy to demonstrate this harm, which may
be detectable only at some peculiarly sensitive stage of the host’s
life history or under particular circumstances (Toft & Karter, 1990).
Indeed, there are examples of ‘parasites’ that feed on a host but
362
CHAPTER 12
(a)
(b)
300
100
Cumulative frequency (%)
Poisson
Negative binomial
Frequency
Observed
200
100
Hypoendemic
80
Mesoendemic
60
40
Hyperendemic
20
0
0
2
4
6
8
10
≥12
Number of parasites per host
0
0
1
10
100
1000
Number of worms per mg skin-snip
Figure 12.12 Examples of aggregated distributions of parasite numbers per host. (a) Crayfish, Orconectes rusticus, infected with the
flatworm Paragonimus kellicotti. The distribution is significantly different from Poisson (random) (X2 = 723, P < 0.001) but conforms well
with a ‘negative binomial’, which is good at describing aggregated distributions: X2 = 12, P ≈ 0.4. (After Stromberg et al., 1978; Shaw
& Dobson, 1995.) (b) Distribution of Onchocerca vulvulus worms, which cause onchocerciasis or ‘river blindness’, in human Yanomami
communities in southern Venezuela. Again the distributions, plotted as cumulative frequencies (black lines), conform well to a negative
binomial distribution (colored lines), whether the typical intensity of infection is low (hypoendemic), moderate (mesoendemic) or high
(hyperendemic). (After Vivas-Martinez et al., 2000.)
appear to do it no harm. For example, in natural populations of
Australia’s sleepy lizard, Tiliqua rugosa, longevity was either not
correlated or was positively associated with their load of ectoparasitic ticks (Aponomma hydrosauri and Amblyomma limbatum).
There was no evidence that the ticks reduced host fitness (Bull
& Burzacott, 1993).
There are of course, none the less, examples in which a
detrimental effect of a parasite on host fitness has been demonstrated. Table 12.3, for example, shows one particular compilation
of studies in which experimental manipulation of the loads of animal parasites revealed effects on either host fecundity or survival.
(And while an effect on fecundity may seem less drastic than one
on mortality, this seems less to be the case if one thinks of it as
the death of potentially large numbers of offspring.)
On the other hand, the effects of
parasites are often more subtle than a
effects are often
simple reduction in survival or fecunsubtle . . .
dity. For example, the pied flycatcher
Table 12.3 The impact of various parasites on the fecundity and survival of wild animals, as demonstrated through the experimental
manipulation of parasite loads. (After Tompkins & Begon, 1999, where the original references may be found.)
Host
Parasite
Impact
Anderson’s gerbil (Gerbillus andersoni)
Barn swallow (Hirundo rustica)
Cliff swallow (Hirundo pyrrhonota)
European starling (Sturnus vulgaris)
Synoternus cleopatrae (flea)
Ornithonyssus bursa (mite)
Oeciacus vicarius (bug)
Dermanyssus gallinae (mite)
Ornithonyssus sylvarium (mite)
Ceratophyllus gallinae (flea)
Oeciacus hirundinis (bug)
Philinus deceptivus (fly)
Dermanyssus prognephilus (mite)
Trichostrongylus tenuis (nematode)
Obeliscoides cuniculi (nematode)
Teladorsagia circumcincta (nematode)
Reduced
Reduced
Reduced
Reduced
Reduced
Reduced
Reduced
Reduced
Reduced
Reduced
Reduced
Reduced
Great tit (Parus major)
House martin (Delichon urbica)
Pearly-eyed thrasher (Margarops fuscatus)
Purple martin (Progne subis)
Red grouse (Lagopus lagopus)
Snowshoe hare (Lepus americanus)
Soay sheep (Ovis aries)
survival
fecundity
fecundity
fecundity
fecundity
fecundity
fecundity
fecundity
fecundity
fecundity
survival
survival
PARASITISM AND DISEASE
(b) 1990
25
(c)
0.5
10
33
20
20
15
10
Arrival time
Arrival time
25
8
3
15
10
8
23
37
10
5
5
Noninfected
Infected
0
Noninfected
Infected
Proportion of males infected
with Trypanosoma
(a) 1989
30
363
31
0.4
35
0.3
0.2
0.1
34
32
Early
Late
Standardized arrival time
Figure 12.13 The mean date of arrival (1 = May 1) in Finland of male pied flycatchers (Fidecula hypoleuca) infected and uninfected with
Trypanosoma: (a) 1989 and (b) 1990. ᭹, adult males; 7, yearling males. Sample sizes are indicated near the standard deviation bars. (c) The
proportion of males infected with Trypanosoma amongst groups of migrants arriving in Finland at different times. (After Rätti et al., 1993.)
(Ficedula hypoleuca) migrates from tropical West Africa to Finland
to breed, and males that arrive early are particularly successful in
finding mates. Males infected with the blood parasite Trypanosoma
have shorter tails, tend to have shorter wings and arrive in Finland
late and so presumably mate less often (Figure 12.13). Another
example is provided by lice that feed on the feathers of birds and
are commonly regarded as ‘benign’ parasites, with little or no effects
on the fitness of their hosts. However, a long-term comparison
of the effects of lice on feral rock doves (Columba livia) showed
that the lice reduced the thermal protection given by the feathers
and, in consequence, heavily infected birds incurred the costs of
requiring higher metabolic rates to maintain their body temperatures (Booth et al., 1993) and in the time that the birds spent in
preening to keep the lice population under control.
In a similar vein, infection may make hosts more susceptible
to predation. For example, postmortem examination of red grouse
(Lagopus lagopus scoticus) showed that birds killed by predators
carried significantly greater burdens of the parasitic nematode
Trichostrongylus tenuis than the presumably far more random
sample of birds that were shot (Hudson et al., 1992a). Alternatively, the effect of parasitism may be to weaken an aggressive
competitor and so allow weaker associated species to persist. For
example, of two Anolis lizards that live on the Caribbean island
of St Maarten, A. gingivinus is the stronger competitor and appears
to exclude A. wattsi from most of the island. But the malarial
parasite Plasmodium azurophilum very commonly affects A. gingivinus
but rarely affects A. wattsi. Wherever the parasite infects A.
gingivinus, A. wattsi is present; wherever the parasite is absent, only
A. gingivinus occurs (Schall, 1992). Similarly, the holoparasitic
plant, dodder (Cuscuta salina), which has a strong preference for
Salicornia in a southern Californian salt marsh, is highly instrumental in determining the outcome of competition between
Salicornia and other plant species within several zones of the marsh
(Figure 12.14).
. . . affecting an
These latter examples make an
interaction
important point. Parasites often affect
their hosts not in isolation, but through
an interaction with some other factor: infection may make a host
more vulnerable to competition or predation; or competition or
shortage of food may make a host more vulnerable to infection
or to the effects of infection. This does not mean, however, that
the parasites play only a supporting role. Both partners in the interaction may be crucial in determining not only the overall strength
of the effect but also which particular hosts are affected.
Organisms that are resistant to parasites avoid the costs of
parasitism, but, as with resistance to other natural enemies, resistance itself may carry a cost. This was tested with two cultivars
of lettuce (Lactuca sativa), resistant or susceptible by virtue of
two tightly linked genes to leaf root aphid (Pemphigus bursarius)
and downy mildew (Bremia lactucae). The parasites were controlled
by weekly applications of insecticides and fungicides. Resistant forms
of lettuce bore fewer axillary buds than susceptibles (Figure 12.15),
and this cost of resistance was most marked when the plants were
making poor growth because of nutrient deficiency. In nature, hosts
must always be caught between the costs of susceptibility and the
costs of resistance.
Establishing that parasites have a detrimental effect on host
characteristics of demographic importance is a critical first step
in establishing that parasites influence the population and community dynamics of their hosts. But it is only a first step. A parasite may increase mortality, directly or indirectly, or decrease
fecundity, without this affecting levels or patterns of abundance.
The effect may simply be too trivial to have a measurable effect
at the population level, or other factors and processes may act in
(a)
Arthrocnemum–Salicornia border
Strong parasite impact
Strong parasite preference
Strong symmetric competition
Strong indirect positive effect
High Salicornia zone
Strong parasite impact
Strong parasite preference
Strong asymmetric competition
Strong indirect positive effect
Cuscuta
–
Cuscuta
+
–
–
–
Salicornia
(b)
Uninfected
Infected
Salicornia
(c)
Limonium
Frankenia
Limonium
Frankenia
25
Salicornia
Arthrocnemum
80
20
Plant mass (g)
Cover (%)
–
Salicornia
100
60
40
20
0
+
Arthrocnemum
15
10
5
1994
1995
1994
1995
0
Uninfected
Infected
Figure 12.14 The effect of dodder, Cascuta salina, on competition between Salicornia and other species in a southern Californian
salt marsh. (a) A schematic representation of the main plants in the community in the upper and middle zones of the marsh and the
interactions between them (solid lines: direct effects; dashed lines: indirect effects). Salicornia (the relatively low-growing plant in the figure)
is most attacked by, and most affected by, dodder (which is not itself shown in the figure). When uninfected, Salicornia competes strongly
and symmetrically with Arthrocnemum at the Arthrocnemum–Salicornia border, and is a dominant competitor over Limonium and Frankenia
in the middle (high Salicornia) zone. However, dodder significantly shifts the competitive balances. (b) Over time, Salicornia decreased and
Arthrocnemum increased in plots infected with dodder. (c) Large patches of dodder suppress Salicornia and favor Limonium and Frankenia.
(After Pennings & Callaway, 2002.)
(a)
(b)
800
1400
Number of buds
1200
600
1000
800
400
600
400
200
200
0
Resistant
Susceptible
Genotype
0
Susceptible
Resistant
Genotype
Figure 12.15 The number of buds
produced by resistant and susceptible
genotypes of two cultivars of lettuce,
(a) and (b). Error bars are ±2 SE.
(After Bergelson, 1994.)
PARASITISM AND DISEASE
a compensatory fashion – for example, loss to parasites may lead
to a weakening of density-dependent mortality at a later stage in
the life cycle. The effects of rare, devastating epidemics, whether
in humans, other animals or plants, are easy to see; but for more
typical, endemic parasites and pathogens, moving from the hostindividual to the host-population level offers an immense challenge.
12.6 The population dynamics of infection
In principle, the sorts of conclusions that were drawn in Chapter 10 regarding the population dynamics of predator–prey and
herbivore–plant interactions can be extended to parasites and
hosts. Parasites harm individual hosts, which they use as a
resource. The way in which this affects their populations varies
with the densities of both parasites and hosts and with the details
of the interaction. In particular, infected and uninfected hosts
can exhibit compensatory reactions that may greatly reduce the
effects on the host population as a whole. Theoretically, a range
of outcomes can be predicted: varying degrees of reduction in
host-population density, varying levels of parasite prevalence
and various fluctuations in abundance.
With parasites, however, there are
effects on health or
particular problems. One difficulty is
morbidity
that parasites often cause a reduction in
the ‘health’ or ‘morbidity’ of their host
rather than its immediate death, and it is therefore usually difficult
to disentangle the effects of the parasites from those of other
factors with which they interact (see Section 12.5). Another
problem is that even when parasites cause a death, this may not
be obvious without a detailed postmortem examination (especially
in the case of microparasites). Also, the biologists who describe
themselves as parasitologists have in the past tended to study the
biology of their chosen parasite without much consideration of
the effects on whole host populations; while ecologists have
tended to ignore parasites. Plant pathologists and medical and veterinary parasitologists, for their part, generally study parasites with
known severe effects that live typically in dense and aggregated
populations of hosts, paying little attention to the more typical
effects of parasites in populations of ‘wildlife’ hosts. Elucidation
of the role of parasites in host-population dynamics is one of the
major challenges facing ecology.
Here, we begin by looking at the dynamics of infection
within host populations without considering any possible effects
on the total abundance of hosts. This ‘epidemiological’ approach
(Anderson, 1991) has especially dominated the study of human
disease, where total abundance is usually considered to be determined by a whole spectrum of factors and is thus effectively independent of the prevalence of any one infection. Infection only affects
the partitioning of this population into susceptible (uninfected),
infected and other classes. We then take a more ‘ecological’
approach by considering the effects of parasites on host abundance
365
in a manner much more akin to conventional predator–prey
dynamics.
12.6.1 The basic reproductive rate and the transmission
threshold
In all studies of the dynamics of paraR0, the basic
site populations or the spread of infecreproductive rate
tion, there are a number of particularly
key concepts. The first is the basic reproductive rate, R0. For
microparasites, because infected hosts are the unit of study, this
is defined as the average number of new infections that would
arise from a single infectious host introduced into a population
of susceptible hosts. For macroparasites, it is the average number
of established, reproductively mature offspring produced by a
mature parasite throughout its life in a population of uninfected
hosts.
the transmission
The transmission threshold, which
threshold
must be crossed if an infection is to
spread, is then given by the condition
R0 = 1. An infection will eventually die out for R0 < 1 (each
present infection or parasite leads to less than one infection or
parasite in the future), but an infection will spread for R0 > 1.
Insights into the dynamics of infection can be gained by considering the various determinants of the basic reproductive rate.
We do this in some detail for directly transmitted microparasites,
and then deal more briefly with related issues for indirectly
transmitted microparasites, and directly and indirectly transmitted macroparasites.
12.6.2 Directly transmitted microparasites: R0 and
the critical population size
For microparasites with direct, density-dependent transmission (see
Section 12.4.3), R0 can be said to increase with: (i) the average
period of time over which an infected host remains infectious, L;
(ii) the number of susceptible individuals in the host population,
S, because greater numbers offer more opportunities for transmission of the parasite; and (iii) the transmission coefficient, β (see
Section 12.4.3). Thus, overall:
R0 = SβL.
(12.5)
Note immediately that by this definition, the greater the number
of susceptible hosts, the higher the basic reproductive rate of the
infection (Anderson, 1982).
The transmission threshold can
now be expressed in terms of a critical
the critical
population size, ST, where, because R0 = 1
population size . . .
at that threshold:
366
CHAPTER 12
ST = 1/(βL).
L), and they often induce lasting immunity. Thus, for example,
a disease like measles has a critical population size of around 300,000
individuals, and is unlikely to have been of great importance until
quite recently in human biology. However, it generated major
epidemics in the growing cities of the industrialized world in the
18th and 19th centuries, and in the growing concentrations of population in the developing world in the 20th century. Around 900,000
deaths occur each year from measles infection in the developing
world (Walsh, 1983).
(12.6)
In populations with numbers of susceptibles less than this, the infection will die out (R0 < 1). With numbers greater than this the infection will spread (R0 > 1). (ST is often referred to as the critical
community size because it has mostly been applied to human ‘communities’, but this is potentially confusing in a wider ecological
context.) These simple considerations allow us to make sense of
some very basic patterns in the dynamics of infection (Anderson,
1982; Anderson & May, 1991).
Consider first the kinds of population
. . . for different types
in which we might expect to find difof parasite
ferent sorts of infection. If microparasites
are highly infectious (large βs), or give
rise to long periods of infectiousness (large Ls), then they will have
relatively high R0 values even in small populations and will
therefore be able to persist there (ST is small). Conversely, if parasites are of low infectivity or have short periods of infectiousness, they will have relatively small R0 values and will only be
able to persist in large populations. Many protozoan infections
of vertebrates, and also some viruses such as herpes, are persistent within individual hosts (large L), often because the immune
response to them is either ineffective or short lived. A number
of plant diseases, too, like club-root, have very long periods of
infectiousness. In each case, the critical population size is therefore small, explaining why they can and do survive endemically
even in small host populations.
On the other hand, the immune responses to many other
human viral and bacterial infections are powerful enough to
ensure that they are only very transient in individual hosts (small
(a)
12.6.3 Directly transmitted microparasites:
the epidemic curve
The value of R0 itself is also related to the nature of the epidemic
curve of an infection. This is the time series of new cases following the introduction of the parasite into a population of hosts.
Assuming there are sufficient susceptible hosts present for the parasite to invade (i.e. the critical population size, ST, is exceeded),
the initial growth of the epidemic will be rapid as the parasite
sweeps through the population of susceptibles. But as these
susceptibles either die or recover to immunity, their number, S,
will decline, and so too therefore will R0 (Equation 12.5). Hence,
the rate of appearance of new cases will slow down and then
decline. And if S falls below ST and stays there, the infection will
disappear – the epidemic will have ended. Two examples of
epidemic curves, for Legionnaires’ disease in Spain and for footand-mouth disease in the UK, are shown in Figure 12.16.
Not surprisingly, the higher the initial value of R0, the more
rapid will be the rise in the epidemic curve. But this will also lead
(b)
80
Number of cases
60
50
40
30
20
Number of premises
70
60
50
40
30
20
0
0
Fe
Fe b 1
b
1
M 5
a
M r1
ar
M 15
ar
Ap 29
r
Ap 12
r
M 26
ay
M 10
ay
2
Ju 4
Ju n 7
n
21
Ju
Ju l 6
l1
Au 9
Au g 2
g
Au 16
g
Se 30
p
Se 13
p
27
10
Ju
n
Ju 26
n
Ju 28
n
30
Ju
l2
Ju
l4
Ju
l6
Ju
l
Ju 8
l1
Ju 0
l1
Ju 2
l1
Ju 4
l1
Ju 6
l1
Ju 8
l1
9
10
Week commencing
Figure 12.16 (a) An epidemic curve for an outbreak of Legionnaires’ disease in Murcia, a municipality in southeastern Spain, in 2001.
(After García-Fulgueiras et al., 2003.) (b) An epidemic curve for an outbreak of foot-and-mouth disease (mostly affecting cattle and sheep)
in the United Kingdom in 2001. Infected premises (farms) are shown, since infection was transmitted from farm to farm, and once infected,
all the stock on that farm were destroyed. (After Gibbens & Wilesmith, 2002.)
PARASITISM AND DISEASE
(b)
45
40
35
30
25
20
15
10
5
0
1948 50 52 54 56 58 60 62 64 66 68
to the more rapid removal of susceptibles from the population and hence to an earlier end to the epidemic: higher values
of R0 tend to give rise to shorter, sharper epidemic curves. Also,
whether the infection disappears altogether (i.e. the epidemic
simply ends) depends very largely on the rate at which new
susceptibles either move into or are born into the population,
since this determines how long the population remains below ST.
If this rate is too low, then the epidemic will indeed simply end.
But a sufficiently rapid input of new susceptibles should prolong
the epidemic, or even allow the infection to establish endemically
in the population after the initial epidemic has passed.
12.6.4 Directly transmitted microparasites:
cycles of infection
This leads us naturally to consider the
longer term patterns in the dynamics of
different types of endemic infection. As
described above, the immunity induced
by many bacterial and viral infections reduces S, which reduces
R0, which therefore tends to lead to a decline in the incidence of
the infection itself. However, in due course, and before the infection disappears altogether from the population, there is likely to
be an influx of new susceptibles into the population, a subsequent
increase in S and R0, and so on. There is thus a marked tendency
with such infections to generate a sequence from ‘many susceptibles (R0 high)’, to ‘high incidence’, to ‘few susceptibles (R0 low)’,
to ‘low incidence’, to ‘many susceptibles’, etc. – just like any other
predator–prey cycle. This undoubtedly underlies the observed cyclic
incidence of many human diseases, with the differing lengths
of cycle reflecting the differing characteristics of the diseases:
measles with peaks every 1 or 2 years (Figure 12.17a), pertussis
(whooping cough) every 3–4 years (Figure 12.17b), diphtheria every
4–6 years, and so on (Anderson & May, 1991).
dynamic patterns
of different types
of parasite
Year
6500
5500
Cases
Figure 12.17 (a) Reported cases of
measles in England and Wales from 1948
to 1968, prior to the introduction of mass
vaccination. (b) Reported cases of pertussis
(whooping cough) in England and Wales
from 1948 to 1982. Mass vaccination was
introduced in 1956. (After Anderson &
May, 1991.)
Weekly cases of measles (1000s)
(a)
367
4500
3500
2500
1500
500
0
1948 52 56 60 64 68 72 76 80 84
Year
By contrast, infections that do not induce an effective immune
response tend to be longer lasting within individual hosts, but also
tend not to give rise to the same sort of fluctuations in S and R0.
Thus, for example, protozoan infections tend to be much less variable (less cyclic) in their prevalence.
12.6.5 Directly transmitted microparasites:
immunization programs
Recognizing the importance of critical population sizes also
throws light on immunization programs, in which susceptible hosts
are rendered nonsusceptible without ever becoming diseased
(showing clinical symptoms), usually through exposure to a
killed or attenuated pathogen. The direct effects here are obvious: the immunized individual is protected. But, by reducing the
number of susceptibles, such programs also have the indirect effect
of reducing R0. Indeed, seen in these terms, the fundamental aim
of an immunization program is clear – to hold the number of susceptibles below ST so that R0 remains less than 1. To do so is said
to provide ‘herd immunity’.
In fact, a simple manipulation of Equation 12.5 gives rise to a
formula for the critical proportion of the population, pc, that needs
to be immunized in order to provide herd immunity (reducing
R0 to a maximum of 1, at most). If we define S0 as the typical
number of susceptibles prior to any immunization and note
that ST is the number still susceptible (not immunized) once the
program to achieve R0 = 1 has become fully established, then
the proportion immunized is:
pc = 1 − (ST/S0).
(12.7)
The formula for ST is given in Equation 12.6, whilst that for S0,
from Equation 12.5, is simply R0/βL, where R0 is the basic reproductive rate of the infection prior to immunization. Hence:
368
CHAPTER 12
12.6.7 Crop pathogens: macroparasites viewed as
microparasites
1.0
Eradication
0.8
Measles
Rubella
0.6
Smallpox
pc
0.4
Persistence
0.2
0
0
5
10
15
20
25
30
35
40
R0
Figure 12.18 The dependence of the critical level of vaccination
coverage required to halt transmission, pc, on the basic
reproductive rate, R0, with values for some common human
diseases indicated. (After Anderson & May, 1991.)
pc = 1 − (1/R0).
Most of plant pathology has been concerned with the dynamics
of diseases within crops, and hence with the spread of a disease
within a generation. Moreover, although most commonly studied
plant pathogens are macroparasites in the sense we have defined
them, they are typically treated like microparasites in that disease
is monitored on the basis of some measure of disease severity –
often, the proportion of the population infected (i.e. prevalence).
We refer to yt as the proportion affected by lesions at time t, and
hence (1 − yt) is the proportion of the population without lesions
and thus susceptible to infection. It is also usually necessary with
plant pathogens to take explicit account of the latent period, length
p, between the time when a lesion is initiated and the time when
it becomes infectious (spore-forming) itself, in which state it
remains for a further period l. Hence, the proportion of the population affected by infectious lesions at time t is ( yt−p − yt−p−l). The
rate of increase in the proportion of a plant population affected
by lesions (Vanderplank, 1963; Zadoks & Schein, 1979; Gilligan,
1990) may thus be given by:
(12.8)
dyt/dt = D(1 − yt )(yt−p − yt−p−l),
This reiterates the point that in order to eradicate a disease,
it is not necessary to immunize the whole population – just a
proportion sufficient to bring R0 below 1. It also shows that this
proportion will be higher the greater the ‘natural’ basic reproductive
rate of the disease (without immunization). This general dependence of pc on R0 is illustrated in Figure 12.18, with the estimated
values for a number of human diseases indicated on it. Note
that smallpox, the only disease where in practice immunization
seems to have led to eradication, has unusually low values of R0
and pc.
(12.10)
which is essentially a βSI formulation, with D the plant pathologists’ version of a transmission coefficient. This gives rise to
S-shaped curves for the progress of a disease within a crop
that broadly match the data derived from many crop–pathogen
systems (Figure 12.19).
In the progress of such infections, plant pathologists recognize
three phases.
(12.9)
1 The ‘exponential’ phase, when, although the disease is rarely
detectable, rapid acceleration of parasite prevalence occurs. This
is therefore the phase in which chemical control would be most
effective, but in practice it is usually applied in phase 2. The
exponential phase is usually considered arbitrarily to end at
y = 0.05; about the level of infection at which a nonspecialist
might detect that an epidemic was developing (the perception
threshold).
2 The second phase, which extends to y = 0.5. (This is sometimes
confusingly called the ‘logistic’ phase, although the whole
curve is logistic.)
3 The terminal phase, which continues until y approaches 1.0.
In this phase chemical treatment is virtually useless – yet it is
at this stage that the greatest damage is done to the yield of
a crop.
Here, there is apparently no threshold population size and such
infections can therefore persist even in extremely small populations (where, to a first approximation, the chances of sexual contact for an infected host are the same as in large populations).
On the other hand, some crop diseases are not simply transmitted by the passive spread of infective particles from one host
to another. For example, the anther smut fungus, Ustilago violacea,
is spread between host plants of white campion, Silene alba, by
12.6.6 Directly transmitted microparasites: frequencydependent transmission
Suppose, however, that transmission is frequency dependent
(see Section 12.4.3), as it is likely to be, for example, with sexually transmitted diseases, where transmission occurs after an
infected individual ‘seeks out’ (or is sought out by) a susceptible
individual. Then there is no longer the same dependence on the
number of susceptibles, and the basic reproductive rate is simply
given by:
R0 = β′L.
PARASITISM AND DISEASE
(a)
100
1983
Wheat
Triticale
80
Disease severity (%)
100
1984
Wheat
Triticale
80
60
60
40
40
20
369
20
0
0
10
5
15
20
25
0
0
10
5
15
20
25
Days after heating
(b)
100
100
Untreated
Solarized
80
Diseased plants (%)
Figure 12.19 ‘S-shaped’ curves of the
progress of diseases through crops from
an initial inoculum to an asymptotic
proportion of the total population infected.
(a) Puccinia recondita attacking wheat
(cultivar Morocco) and triticale (a crop
derived from the hybridization of wheat
and rye) in 1983 and 1984. (b) Fusarium
oxysporum attacking tomatoes in
experiments comparing untreated and
sterilized soil and untreated and artificially
heated soil. (After Gilligan, 1990, in which
the original data sources and methods of
curve-fitting may be found.)
60
60
40
40
20
20
0
0
4
8
pollinating insects that adjust their flight distances to compensate
for changes in plant density, such that the rate of transmission is
effectively independent of host density (Figure 12.20a). However,
this rate decreases significantly with the proportion of the population that is susceptible: transmission is frequency dependent
(Figure 12.20b), favoring, as we have seen, persistence of the disease even in low-density populations. Of course, this is really just
another case of frequency-dependent transmission in a sexually
transmitted disease – except that sexual contact here is indirect
rather than intimate.
12.6.8 Other classes of parasite
For microparasites that are spread from
one host to another by a vector more
generally (where the vector does not
compensate for changes in host density as in the above example),
the life cycle characteristics of both the host and vector enter into
the calculation of R0. In particular, the transmission threshold
vector-borne
infections
Untreated
Artificially heated
80
12
16
20
24
28
32
0
0
4
8
12
16
20
24
28
Days after heating
(R0 = 1) is dependent on a ratio of vector : host numbers. For a
disease to establish itself and spread, that ratio must exceed a
critical level – hence, disease control measures are usually aimed
directly at reducing the numbers of vectors, and are aimed only
indirectly at the parasite. Many virus diseases of crops, and vectortransmitted diseases of humans and their livestock (malaria,
onchocerciasis, etc.), are controlled by insecticides rather than chemicals directed at the parasite; and the control of all such diseases
is of course crucially dependent on a thorough understanding of
the vector’s ecology.
directly transmitted
The effective reproductive rate of a
macroparasites
directly transmitted macroparasite (no
intermediate host) is directly related to
the length of its reproductive period within the host (i.e. again, to
L) and to its rate of reproduction (rate of production of infective
stages). Both of these are subject to density-dependent constraints that can arise either because of competition between the
parasites, or commonly because of the host’s immune response
(see Section 12.3.8). Their intensity varies with the distribution
of the parasite population between its hosts and, as we have seen,
370
CHAPTER 12
Number of spores
(a)
(b)
0.5
0.5
0.4
0.4
0.3
0.3
0.2
10
0.2
20
30
40
50
Density of susceptible flowers
per experimental plot
60
0.2 0.3 0.4 0.5 0.6 0.7 0.8 0.9
1
Frequency of susceptible flowers
Figure 12.20 Frequency-dependent transmission of a sexually transmitted disease. The number of spores of Ustilago violacea deposited per
flower of Silene alba (log10(x + 1) transformed) where spores are transferred by pollinating insects. (a) The number is independent of the
density of susceptible (healthy) flowers in experimental plots (P > 0.05) (and shows signs of decreasing rather than increasing with density,
perhaps as the number of pollinators becomes limiting). (b) However, the number decreases with the frequency of susceptibles (P = 0.015).
(After Antonovics & Alexander, 1992.)
aggregation of the parasites is the most common condition. This
means that a very large proportion of the parasites exist at high
densities where the constraints are most intense, and this tightly
controlled density dependence undoubtedly goes a long way
towards explaining the observed stability in prevalence of many
helminth infections (such as hookworms and roundworms) even
in the face of perturbations induced by climatic change or human
intervention (Anderson, 1982).
Most directly transmitted helminths have an enormous
reproductive capability. For instance, the female of the human
hookworm Necator produces roughly 15,000 eggs per worm per
day, whilst the roundworm Ascaris can produce in excess of
200,000 eggs per worm per day. The critical threshold densities
for these parasites are therefore very low, and they occur and
persist endemically in low-density human populations, such as
hunter–gatherer communities.
Density dependence within hosts also
indirectly transmitted
plays a crucial role in the epidemiology
macroparasites
of indirectly transmitted macroparasites,
such as schistosomes. In this case, however, the regulatory constraints can occur in either or both of the
hosts: adult worm survival and egg production are influenced
in a density-dependent manner in the human host; but also,
production of infective stages by the snail (intermediate host) is
virtually independent of the number of (different) infective stages
that penetrate the snail. Thus, levels of schistosome prevalence
tend to be stable and resistant to perturbations from outside
influences.
The threshold for the spread of infection depends directly
on the abundance of both humans and snails (i.e. a product as
opposed to the ratio that was appropriate for vector-transmitted
microparasites). This is because transmission in both directions
is by means of free-living infective stages. Thus, since it is inappropriate to reduce human abundance, schistosomiasis is often
controlled by reducing snail numbers with molluscicides in an
attempt to depress R0 below unity (the transmission threshold).
The difficulty with this approach, however, is that the snails have
an enormous reproductive capacity, and they rapidly recolonize
aquatic habitats once molluscicide treatment ceases. The limitations imposed by low snail numbers, moreover, are offset to an
important extent by the long lifespan of the parasite in humans
(L is large): the disease can remain endemic despite wide fluctuations in snail abundance.
12.6.9 Parasites in metapopulations: measles
With host–parasite dynamics, as with other areas of ecology, there
is increasing recognition that populations cannot be seen as either
homogeneous or isolated. Rather, hosts are usually distributed
amongst a series of subpopulations, linked by dispersal between
them, and which together comprise a ‘metapopulation’ (see Section 6.9). Thus, since the argument has already been made (see
Section 12.4.1) that each host supports a subpopulation and a host
population supports a metapopulation of parasites, host–parasite
systems are typically metapopulations of metapopulations.
Such a perspective immediately changes our view of what
is required of a host population if it is to support a persistent
population of parasites. This is apparent from an analysis of
the dynamics of measles in 60 towns and cities in England and
Wales from 1944 to 1994: 60 subpopulations comprising an overall metapopulation (Figure 12.21) (Grenfell & Harwood, 1997).
Taken as a whole, the metapopulation displayed regular cycles
in the number of measles cases and measles was ever-present
(Figure 12.21a), at least before widespread vaccination (c. 1968).
But amongst the individual subpopulations, only the very largest
were not liable to frequent ‘stochastic fade-out’ (disappearance of
the disease when a few remaining infectious individuals fail to pass
PARASITISM AND DISEASE
371
(a)
1000
City size (1000s)
800
600
400
Cases (1000s)
200
12
6
2
1960
1950
1970
1980
1990
Year
(b)
3.0
2.5
Fadeouts per year
Figure 12.21 (a) The weekly measles
notifications for 60 towns and cities in
England and Wales, combined, are shown
below for the period 1944–94. The vertical
line indicates the start of mass vaccination
around 1968. The data for the individual
towns (town size on the vertical axis)
are displayed above as a dot for each
week without a measles notification.
(b) Persistence of measles in these
towns and cities in the prevaccination era
(1944–67) as a function of population size.
Persistence is measured inversely as the
number of ‘fade-outs’ per year, where a
fade-out here is defined as a period of three
or more weeks without notification, to
allow for the underreporting of cases.
(After Grenfell & Harwood, 1997.)
2.0
1.5
1.0
0.5
0.0
0
it on), especially during the cycle troughs: the idea of a critical
population size of around 300,000–500,000 is therefore well
supported (Figure 12.21b). Thus, patterns of dynamics may be
apparent, and persistence may be predictable, in a metapopulation taken as a whole. But in the individual subpopulations, especially if they are small, the patterns of dynamics and persistence
are likely to be far less clear. The measles data set is unusual in
that we have information both for the metapopulation and individual subpopulations. In many other cases, it is almost certain
that the principle is similar but we have data only for the
metapopulation (and do not appreciate the number of fade-outs
in smaller parts of it), or we have data only for a subpopulation
(and do not appreciate its links to other subpopulations within
the larger metapopulation).
100
200
300
400
500
Community size (1000s)
12.7 Parasites and the population dynamics
of hosts
A key and largely unanswered question in population ecology is
what role, if any, do parasites and pathogens play in the dynamics of their hosts? There are data (see Section 12.5) showing that
parasites may affect host characteristics of demographic importance (birth and death rates), though even these data are relatively
uncommon; and there are mathematical models showing that
parasites have the potential to have a major impact on the
dynamics of their hosts. But the point was also made earlier that
it is a big step further to establish that dynamics are actually affected.
There are certainly cases where a parasite or pathogen seems,
by implication, to reduce the population size of its host. The