Stephens & Foraging - Behavior and Ecology - Chapter 8 doc
Bạn đang xem bản rút gọn của tài liệu. Xem và tải ngay bản đầy đủ của tài liệu tại đây (835.77 KB, 34 trang )
Part III
Modern Foraging Theory8
Provisioning
Ronald C. Ydenberg
8.1 Prologue
A honeybee(Apismellifera)colony contains thousands of foragers that
collect large amounts of nectar, pollen, propolis, and water and deliver
them to the hive. The colony’s activities and, ultimately, reproduction
depend on these resources. Millions of years of honeybee evolution and
thousands of years of domesticationhave selectedfor proficientresource
provisioning.
Bees divide the labor of resource acquisition and provisioning. Scout
bees specialize in finding ephemeral resources and recruiting foragers
to good locations. Foragers fuel up on the communal honey supply and
leave the colony knowing where to go and what to expect. En route,
they regulate their flight speed, micromanage their body temperature,
and carefully collect a load for transport back to the hive. In the hive, a
system of feedbacks involving behaviors, odors, and pheromones reg-
ulates the quantity and quality of future resource deliveries. Using this
system, the colony can quickly refocus its activities on the commodities
it needs most.
Many predators, including bears, honey badgers, honeyguides, honey
buzzards, and hornets,covet the contentsof ahive, and thebees must de-
fend it. Outside the hive, bee wolves and other predatory insects, as well
as a suite of birds such as bee-eaters, make a forager’s life hazardous. If
she eludes all these dangers, she faces a routine of grueling work: after
274 Ronald C. Ydenberg
only 20 days or so, her wings are tattered and her body pile worn. Soon all
internal systems fail. When she dies, her comrades unceremoniously dump
her body onto a pile of other spent workers outside the hive. Selection has
not built workers to last, but to provision.
8.2 Introduction
This chapter considers provisioning: the collection and delivery of materials
such as food, nesting material, or water. The quintessential feature of pro-
visioning is that provisioning animals deliver material to a site where they ei-
ther feed it to others or store it for later use (Ydenberg 1998). The earliest pro-
visioning studies considereda parent birdworking ashard as possibleto deliver
prey items to its altricial offspring. This chapter will show that provisioning
raises important questions and issues that go far beyond the problems of a
parent bird feeding its young.
The “parent bird” paradigm focuses attention on only a few key features
of animal provisioning. Many other animal taxa provision, using a wide range
of behaviors (table 8.1), and the realm of interesting provisioning phenomena
includes aspects other than foraging theory’s classic problems of prey choice
and patch exploitation (Stephens and Krebs 1986; see chap. 1 in this volume).
The extensive literature on diverse provisioning systems makes it clear that
we must consider selective benefits beyond simple energy acquisition to un-
derstand the diversity of provisioning behavior.
Like the rest of behavioral ecology, provisioning models emphasize costs
and benefits, and they ask how costs and benefits select for certain types of be-
havior. Fundamentally, these models assume, often implicitly, that selection
(natural, sexual, or artificial) has acted on the structure and function of “deci-
sion mechanisms” (Ydenberg 1998). Physiological processes and morpholog-
ical structures inside the provisioner control these decision mechanisms. The
models do not require cognitive functions such as memory, consciousness, or
forethought, butthey donot precludethem either.Decision mechanismsinte-
grate information from sensory organs and internal indicators of state, such as
hunger or weariness, to produce behavior. For example, seabirds such as thin-
billed prions (see table 8.1) decide whether their next provisioning trip will be
a shortouting ofa fewdays tothe edgeof thecontinental shelfor along pelagic
excursion (apparently evaluating their nestling’s condition, their own condition,
their recent provisioning history, and the availability of prey). Chapters 3, 4,
and 5 consider some of the mechanisms animals use to integrate this informa-
tion (see also Dukas 1998a).
Forselection to actonprovisioning behavior, decisionmechanismsmustaf-
fect the provisioner’s reproduction or survival. This could happen in a variety
Table 8.1 Selected examples of provisioning tactics documented in free-living animals
Selection of prey for self-feeding
Sonerud (1989) describes how a kestrel (Falco tinnunculus) and a shrike (Lanius excubitor)
direct small, medium, and large prey to self-feeding versus delivery.
Foraging destination
In thin-billed prions (Pachyptila belcheri), parents deliver undigested meals after short
trips, and lose condition themselves, evidently because they power the excursion from
body reserves. After long trips, parent prions deliver prey (partially) concentrated into
energy-rich stomach oil; parental condition improves (Duriez et al. 2000).
Foraging mode
Bumblebees may fly or walk between flowers.
Travel speed
On the outbound flight from hive to feeder, honeybees fly faster when the sucrose
concentration at their destination is greater (von Frisch and Lindauer 1955). They fly
more slowly on the return trip, and speed does not vary with concentration. Load size
increases with concentration.
Body temperature
Honeybee workers have higher body temperatures and cool more slowly after landing
on higher-concentration sucrose solutions (Schmaranzer and Stabenheiner 1988).
Prey processing into parts
Rands et al. (2000) describe models and observations of prey dismemberment for
transport by a provisioning merlin (Falco columbarius).
Prey processing into partially digested material, or nutritious secretions
Carnivores may carry whole prey to the den or regurgitate partially digested prey. Of
course, female mammals also lactate (Holekamp and Smale 1990).
Time devoted to provisioning
Spotted hyenas (Crocuta crocuta) vary attendance times at the den depending on prey
availability (Hofer and East 1993).
Adjusting brood location
Lapland longspurs (Calcarius lapponicus) divide broods evenly into two units after nest
departure, each tended by one parent (McLaughlin and Montgomerie 1989).
Body weight or constitution alteration and metabolic rate adjustment
The wet body mass of a worker honeybee drops 40%, and maximal thorax-specific
oxygen consumption increases 10%, during the transition from hive bee to forager
(Harrison 1986).
Adjustment of participation in brood rearing or helping
Adult pied kingfishers (Ceryle rudis) facing high demand recruit helpers (Reyer and
Westerterp 1985).
Egg size, brooding, or delivery
Birds can supply materials to the nest in the egg itself, by brooding offspring, and by
provisioning nestlings. These alternatives have different costs and benefits, and birds can
adjust them accordingly (Hipfner et al. 2001).
276 Ronald C. Ydenberg
Table 8.1 (continued)
Workload
Honeybees in large colonies work harder than those in small colonies (Wolf and
Schmid-Hempel 1990; Eckert et al. 1994).
Offspring gender ratio
In many mass-provisioning hymenopterans, provisioners adjust the gender ratio of the
brood (Rosenheim et al. 1996) between small males and large females. Ovipositing
females can also adjust the sequence and position of offspring sexes within the nest.
Trophic eggs
Many animal taxa provision young with trophic eggs (eggs used as food). In the poison
arrow frog Dendrobates pumilio, mothers deliver trophic eggs to tadpoles secreted in
phytotelmata (tiny pools of water up in trees; Brust 1993). In other poison arrow frog
species, parents supply water to these pools to prevent them from drying.
of ways. Most often, investigatorshave considereddirect effectsof theamount
of food provisioned on the quantity or quality of offspring. However, sexual
selection could also act on decision mechanisms through their effects on the
number or quality of mates attracted. For example, stickleback (Gasterosteus
aculeatus) nests are built by males from material delivered to the assembly point
and may advertise a male’s qualities (Barber et al. 2001; see also Soler et al.
1996). Provisions placed in hoards can enhance survival when resources are
scarce (see chap. 7), and in some species the size or quality of structures built
from delivered material affects reproductive success (e.g., stone ramparts;
Leader and Yom-Tov 1998).
In addition to evaluating benefits, researchers must carefully characterize
the fitness costs of provisioning. Provisioning always involves work because
provisioners must expend time and energy to collect and deliver materials.
Whether provisioners deliver food, water, stones, or mud, the provisioner’s
metabolism generates the necessary power, and the provisioner must feed
itself to provide the fuel for provisioning. Provisioning models pay careful
attention to the relationships between self-feeding, metabolism, and delivery
capacity, but they must also recognize the importance of factors other than
energetics. Collecting materials or the extra food needed to fuel their delivery
may expose the provisioner to danger or distract it from important tasks such
as offspring care or the management of stored food.
This chapter outlines the structure of provisioning models and their rela-
tionship to traditional foraging models,investigates therate of work and itsre-
lation to metabolism, considers how provisioners should respond to demand,
and discusses provisioning in a life history context. It focuses throughout
on the underlying ecological selective factors that shape the morphology,
physiology, and life history of provisioning behavior.
Provisioning 277
8.3 Basic Models of Provisioning Behavior
This section outlines the history of provisioning models, focusing on how
foraging models provided a framework for ideas about provisioning. It devel-
ops the most basic provisioning model and touches on the issues that connect
provisioning and foraging models.
Central Place Foraging
Great tits (Parus major) are small songbirds living in European woodlands.
Each spring a pair raises a brood of about eight nestlings in a tree cavity or
nest box. While provisioning the nestlings, each parent spends almost all of its
time searching through the trees in its territory for insect prey, especially
caterpillars, which are fed to the brood. Each parent makes hundreds of back-
and-forth trips each day, delivering prey to fuel the growth of the nestlings.
Better-fed broods grow faster and survive better.
Orians and Pearson (1979) invented the term “central place foraging” to
describe this and similar situations in which animals make repeated foraging
excursions from a central location. Their model introduced the basic concepts
of central place foraging, developed the idea of “loading” prey, and distin-
guished “single-prey” and “multiple-prey” loaders, appreciating the different
nature of the decisions that these foragers face. The simplicity, novelty, and
applicability of this model inspired many field and experimental studies. Its
simple framework can be applied to a variety of situations: box 8.1 considers
as an example the effect of social interactions on central place foraging.
Central place foraging models consider the amount or type of prey that
foragers should deliver to their central place. “Single-prey loaders” deliver a
single prey item from a capture site on each trip, and the decision they face is
theminimumsize of preyacceptablefordelivery.This decision implies atrade-
off, because low selectivity (capture any prey) means that the forager may
spend too much time in transit with small prey, while high selectivity (cap-
ture only large prey) means that the forager may spend too much time at the
capture site searching for suitable items. The selectivity giving the highest
rate of energy gain depends on the size (energy content) distribution of prey,
prey density, and travel time. Single-prey loader models predict that foragers
should set a higher minimum prey size when prey are more abundant and
when they must travel greater distances to capture sites.
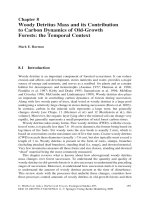
Krebs and Avery’s (1985) studies of bee-eaters (Meriops apiaster) provision-
ing their broodsprovide afield example. Bee-eaterparents capturedbothsmall
(mostly bees and wasps) and large (mostly dragonflies) prey, but delivered a lower
percentage of small prey when returning from more distant capture sites.
BOX 8.1 Effects of Social Interactions at Resource Points on
Provisioning Tactics
Social interactions at resource collection points often affect the tactics that
provisioners use. Eastern chipmunks (Tamias striatus) defend territories and
usually avoid one another. They compete aggressively at rich resource
points, and even the mere proximity of a conspecific can reduce the rate at
which they load seeds into their cheek pouches. Ydenberg et al. (1986) in-
corporated this interference effect into a central place foraging framework
to explain Giraldeau and Kramer’s (1982) observation that chipmunks
collected smaller loads and spent more time exploiting experimentally
provided seed piles as interference increased over repeated visits to the
experimental patches (fig. 8.1.1; see Lair et al. 1994).
Patch time
Load size (# seeds)
increasing
interference
Figure 8.1.1. Interference among chipmunks slows loading, and so reduces load size, but in-
creases patch residence time. The star indicates the predicted rate-maximizing load size at each
level of interference.
Other creatures cooperate rather than compete in resource collection.
Leaf-cutter ants, for example, travel along trails to particular bushes and
trees, where they cut semi-discs from leaves,often strippingentire branches
in the process. Trails to collection sites bustle with two-way traffic as ants
transport leaf fragments to their large underground colonies, where they
are processed into mulch. The ants grow fungus on the mulch and feed this
fungus to the brood.
Foraging ants cut semi-discs from the leaf margin. Larger pieces are
more profitable because cutting time increases linearly with the radius,
while mass rises as the square of the radius. However, it takes more time
to cut large pieces, so workers looking for cutting sites along the leaf mar-
gin may have to wait in a queue for the next available cutting site. So,
(Box 8.1 continued)
while cutting large leaf fragments may increase the delivery rate for an
individual, it can reduce the overall delivery rate. Students of social insects
must frequently address similar conflicts between benefits at the individual
and colony levels (e.g., Ydenberg and Schmid-Hempel 1994).
Burd et al. (2002) analyzed how this conflict affects delivery in the leaf-
cutter ant Atta cephalotes. For an individual worker, the expression load
mass/(outbound time + queuing time + cutting time + inbound time)
gives the rate of delivery of leaf material. The size of the leaf fragment
influences every term of this expression except outbound time. (Ant size
influences all of the terms, because larger individuals travel and cut faster,
and load mass affects larger individuals less.) Individual workers could
theoretically diminish the effect of queuing by cutting smaller pieces, ef-
fectively reducing their own delivery rate to reduce the waiting time of
their nestmates and so boost their delivery potential. Figure 8.1.2 displays
Burd et al.’s measurements of leaf fragment sizes in relation to these predic-
tions. Workers cut smaller leaf fragments than predicted by individual rate
maximization, and the observed fragment sizes more closely matched the
predictions of colony rate maximization. Ydenberg and Schmid-Hempel
(1994), Kacelnik (1993), and Roces and Nu
˜
nez (1993) provide more dis-
cussion of load size in leaf-cutter ants.
Figure 8.1.2. Load masses of leaf fragments cut by leaf-cutter ants (Atta colombica)fromthe
tree Tocoyena pittieri. The line labeled “individual maximum” shows predictions based on maxi-
mization of individual delivery rates in the absence of queuing. The lines labeled “whole colony
rate” show predicted load masses if ants maximize delivery to the colony taking queuing into
account, the magnitude of which is given by the parameter λ. The “whole colony” lines lie below
the “individual maximum” line and better match the data. (After Burd et al. 2002.)
280 Ronald C. Ydenberg
(Box 8.1 continued)
In these two examples, interference and cooperation at resource collection
sites both result in a tactical reduction of load size by provisioners. In other
early studies, Martindale (1982) and Ydenberg and Krebs (1987) considered
how territorial intruders affected provisioning tactics andfound theoretical
and empirical support for the idea that intruders cause a reduction in load size
and patch residence time. Central place foraging models provide a simple
framework for investigating the effects of social interactions on provisioning.
Bee-eaters feeding themselves or fledged young at these same sites (i.e., with
no travel to the nest involved) ate many small prey, confirming that they must
have been rejecting opportunities to deliver small prey in favor of waiting for
larger items. Krebs and Avery used their field measurements to predict the crit-
ical travel times beyond which delivery of small items was no longer worth-
while and compared their predictions with their observational data (fig. 8.1).
“Multiple-prey loaders” face a different problem: they must decide how
many prey items to collect before they return to the central place. Larger loads
require increasingly long loading times, so multiple-prey models predict that
foragers shouldcollect largeloads onlywhen theymust travela longway from
the central place. Kacelnik (1984) studied European starling (Sturnus vulgaris)
Figure 8.1. Measured and predicted composition (percentage of small prey) of prey collected for delivery
by bee-eaters from capture sites distant from the nest in two different years. The dashed line shows the
diet predicted by an energy gain–maximizing central place foraging model, which below the critical travel
time should contain small and large prey in proportion to availability, and above it only large prey. The
shaded bar shows the location of the best-fitting threshold, plus standard error, estimated from the data.
(After Krebs and Avery 1985.)
Provisioning 281
parents collecting mealworms according to an experimentally controlled
schedule and at manipulated travel times. Individual starlings clearly upheld
the basic prediction that larger loads are a consequence of longer travel times
(fig. 8.2).
Readers should understand that central place foraging is not synonymous
withprovisioning. Theformerusesthe structureofrepeatedexcursions froma
central place to a site where some resource is collected. The essential feature of
provisioning is the collection of a resource that does not fuel the provisioner’s
energy supply (e.g., nesting material or food for another). Many central place
problems involve provisioning, but others, such as diving by air-breathing
animals (Ydenberg 1988) or surface breathing by aquatic animals (Kramer
1988) clearly do not.
Currencies
What should central place foragers maximize? Kacelnik (1984) compared the
load sizes that his European starlings collected with the predictions of four ob-
jective functions, or “currencies.” The currency he called delivery is the total
delivery of prey energy to the nest on each trip, divided by round-trip time.
The currency called yield subtracts from the total delivery the amount of ener-
gy spent by the parent on each trip, all divided by round-trip time; while that
called family gain further subtracts the energy spent by the young during each
trip. These three closely related measures are all rates and are all expressed in
units of watts (joules per second). The fourth currency is somewhat different:
it takes the total delivery and divides by the energy expended by the parent.
We call this currency efficiency (joules delivered to the nest per joule expended
by the parent), and it has no units. Statistically, the family gain currency
matched Kacelnik’s observations best, but all four currencies made similar
predictions, and he could not discriminate among them unambiguously.
Houston (1987) pointed out that all of these currencies combine the energy
budgets of the parents and young in ways that do not accurately reflect who
receives and who pays for the delivered energy. For example, yield subtracts
the energy the parent expends from the energy delivered to the young, even
though parents do not consume the prey they deliver to the nest. Field studies
show that parents regularly consume prey items at the collection site, but
always before beginning to collect a load for delivery (Brooke 1981; Kacelnik
1984; Krebs and Avery 1985). Central place foraging models simply ignore
this self-feeding, and none of these studies accounted for it in making model
predictions.
282 Ronald C. Ydenberg
Figure 8.2. Number of prey (mealworms) collected for delivery to a nest by parent starlings from a feeding
table at which the experimenter made prey available on a controlled schedule. The graphs show data
(open circles) for two birds (Y and W) in relation to the predictions (solid line) of the four central place
foraging currencies described in the text. Note that the data represented in the four panels for each bird
are the same, but the prediction changes slightly. (After Kacelnik 1984.)
Provisioning Models
In a key step of the development of provisioning models from central place
foraging models, modelers slowly recognized that they should account sepa-
rately for the energy delivered to nestlings and the energy parents consume
and expend (Ydenberg and Schmid-Hempel 1994). Only one central place
foraging study published before Houston’s (1987) paper recognized this key
Provisioning 283
distinction. In a model of flight speed for parent birds delivering food to off-
spring, Norberg (1981) separated parent and offspring accounts by requiring
that provisioners spend some time acquiring the food needed to cover the
costs of the trip. We can measure delivery as the amount of energy or ma-
terial delivered (e.g., to offspring) over some period without confusing this
with theprovisioner’s ownenergetics. So,a conceptually correct provisioning
model must find the tactic that maximizes delivery, subject to the require-
ment that the provisioner (in this case, the parent bird) spend enough time
to meet its own energy requirements. As Houston (1987, 255) says of the
parent bird example, “the strategy that maximizes fitness is the strategy that
maximizes the conversion of the parent’s time and energy into energy for the
young.”
I call models with this explicit treatment of self-feeding “provisioning”
models to distinguish them from central place foraging models. The differ-
ences are small but significant. Provisioning models keep the parent’s energy
budget separate from the energy delivered to the brood by measuring the
parent’s energy budget not in joules, but as the time the parent needs to find
the food to balance its own books. This distinction means that we do not have
to measure delivery in units of energy. We can consider the delivery of water
to cool a wasp nest (e.g., Kasuya 1982), sticks to build a nest (e.g., McGinley
1984; Nores and Nores 1994), or any other material.
The Basic Provisioning Model
After delivering one prey item, a great tit must immediately turn around and
fly back to find another. How fast should it fly to the foraging site? Faster
flight, of course, reduces travel time, but it also increases the time that must
be spent in collecting fuel for the trip. As Norberg (1981) noted in his original
paper on the topic, the delivery-maximizing flight speed depends on the
time that the provisioner must spend in feeding itself. The basic provisioning
model analyzes this problem.
To find the solution, we assume that the provisioner can choose from a
list of n behavioral tactics i = 1,2,3, ,n. The tactics could be successively
higher travel speeds, successively shorter patch residence times, successively
smaller minimum prey sizes, or variations on any of the other tactics listed
in table 8.1. When the provisioner uses delivery tactic i, it expends energy at
rate c
i
and delivers food at rate d
i
. By convention, we arrange the provisioner’s
options in order of energy expenditure, so using option 1 costs the least per
unit time, and using option n costs the most. The provisioning model finds
the tactic (choice of i) that maximizes the total delivery over some time period
284 Ronald C. Ydenberg
(usually a day), called D
i
. Typically the provisioner faces a trade-off because
options that deliver food at higher rate also cost more to implement, and so
require more self-feeding time.
Next, we divide a provisioner’s time budget into time spent in delivery,
self-feeding, and resting, so that total time T = t
d
+ t
s
+ t
r
. The provisioner
must allocate enough time to self-feeding, t
s
, to maintain a positive energy
balance. During self-feeding the provisioner obtains energy at rate b
s
and
expends energy at rate c
s
(obtaining a net self-feeding rate of b
s
− c
s
). When
at rest, the provisioner expends energy at rate r.
With estimates of the basic cost and delivery parameters, we can easily
calculate how muchdelivery timeeachoption allows,and so computethe total
daily delivery. The provisioner must maintain a positive energy balance, and
so the energetic gain while self-feeding must equal the energetic expenditure
on all activities. To begin, we assume that nothing limits the provisioner’s
total energy expenditure, which means that the provisioner doesn’t need to
spend time resting. (We consider this assumption further below.) With this
simplification, self-feeding at rate b
s
for time t
s
recovers the day’s energy
expenditure, so that b
s
· t
s
= t
d
· c
i
+ t
s
· c
s
. Solving for t
d
yields the time
available for delivery after accounting for the time that the provisioner must
spend self-feeding:
t
d
=
t
s
(b
s
− c
s
)
c
i
. (8.1)
To find the total daily delivery for option i, we multiply the time available
for delivery [eq. (8.1)] by the rate of delivery (d
i
):
D
i
=
d
i
t
s
(b
s
− c
s
)
c
i
. (8.2)
Equation (8.2) summarizes the relationships between the net self-feeding
rate (b
s
−c
s
) and the provisioning tactics available. A heightened net self-feed-
ing rate increases the time available for delivery. However, it may at the same
time allow a higher-workload tactic (higher c
i
) to increase the total delivery.
Generally speaking, higher self-feeding rates permit the provisioner to sustain
harder work,and the tactic that maximizestotal daily delivery intensifies from
lower-delivery to higher-delivery tactics (increasingly higher c
i
)astheself-
feeding rate rises. Figure 8.3 gives a worked example.
The role of the self-feeding rate in these predictions helps us resolve a puz-
zle in foraging theory. Central place foraging models generally use perfor-
mance criteria such as “maximize the net rate of energy gain,” but studies have
sometimes found that efficiency maximization gives a better fit to the data
Provisioning 285
Figure 8.3. The dependence of total daily delivery on the self-feeding rate and the tactical options avail-
able, as described in equations (8.1) and (8.2). The three lines labeled i = 1, 2, 3 represent three succes-
sively higher-workload delivery tactics. For each tactic, open circles indicate the delivery time attainable
if the provisioner adopts a low self-feeding rate; solid circles, an intermediate self-feeding rate; crosses,
a high self-feeding rate. Along the line representing any tactical option, delivery time, and hence total
delivery, increases with self-feeding rate, but at any self-feeding rate, working harder reduces the attain-
able delivery time. A shift to higher workloads with increasing self-feeding rates maximizes the total daily
delivery.
(Ydenberg 1998). Provisioning models can explain this, because the predicted
behavior depends on the self-feeding rate. The term d
i
/c
i
in equation (8.2)
represents theefficiency ofoption i:at low self-feeding rates, the total delivery
is determined largely by its value, and behavior (i.e., choice of i) should match
that predicted by an efficiency (or efficiency-like)currency. Asthe self-feeding
rate increases, it becomes possible to sustain a higher workload, and the mea-
sured behavior should approach the predictions of the three rate-maximizing
currencies. McNamara and Houston (1997) give a general derivation and dis-
cussion of this important point. Thus, a provisioning model can accommodate
rate-maximizing and efficiency-maximizing behavior within a single frame-
work.
Few studies have tested this critical prediction. (Figures 8.1 and 8.2 show
measured behavior as well as predictions about behavior based on central
place foraging currencies, but provisioning predictions require an estimate of
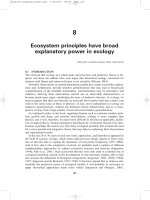
the self-feeding rate, which we do not yet have.) Waite and Ydenberg (1994a,
1994b) measured the deliveries of Canada gray jays (Perisoruscanadensis) hoard-
ing raisins. Birds came to a feeder where they could have one raisin immedi-
ately and obtain two more if they waited an experimentally controlled time.
(Waiting at the feeder for the larger load is a lower-workload tactic because
waiting is an inexpensive activity relative to flying and hoarding.) Obviously,
jays can do better with three-raisin loads when the waiting time is short.
286 Ronald C. Ydenberg
Waite and Ydenberg (1994b) showed that birds shifted abruptly from three-
raisin to one-raisin loads as they increased the experimental waiting time.
More importantly, each individual shifted to lower-workload tactics during
the winter, when the self-feeding rate presumably falls (Waite and Ydenberg
1994a). Figure 8.4A summarizes these results.
A direct experimental test would manipulate the self-feeding rate and
predict the effect on provisioning behavior. Palestinian sunbirds (Nectarina
osea) feed insects to their nestlings (Markman et al. 1999), but feed them-
selves largely on nectar. Few bird species show such a marked difference in
parental and nestling foods (but see Davoren and Burger 1999), so Palestinian
sunbirds provide an opportunity to manipulate the provisioner’s self-feeding
rate. Markman et al. (2002) randomly assigned sunbird territories to low,
medium, or high self-feeding rate groups, which they manipulated by vary-
ing the sugar concentration in feeders placed in the territory. Changes in sugar
concentration caused a variety of behavioral changes. Parents worked harder
when high sugar concentrations produced high self-feeding rates: they visited
the nest more (fig. 8.4B) and reared larger nestlings. Although not designed to
test a provisioning model (Markman placed his work in a life history frame-
work), these results agree with the expectations of the provisioning frame-
work.
Markman et al. controlled the self-feeding rate in their experiment, but
in nature, provisioners can often make decisions about their self-feeding rate.
For example, parent bee-eaters feed themselves on prey caught at the same
sites where they capture prey for their nestlings. As each potential prey item
flies by, they must decide whether to ignore it, catch and eat it, or deliver it to
their nestlings. This decision process affects the self-feeding rate, and hence
the achievable delivery rate. In general, a change in the self-feeding options
alters provisioning behavior, even if the provisioning options do not change
(Houston and McNamara 1999).
This central feature of provisioning models has wide-ranging implications.
For example, students of avian breeding systems have assumed that the brood
size of territorial birds increases with prey density because birds can find and
deliver prey more easily. High prey densities could also mean that parents
can achieve higher self-feeding rates, so that they can work harder at food
delivery. We will need imaginative experimental work controlling both de-
livery and self-feeding opportunities to resolve this issue (e.g., Kay 2004).
The possibility that different locations provide opportunities for self-feeding
and food for delivery has interesting implications for provisioning; box 8.2
gives an example.
Provisioning 287
Sucrose concentration
Parental visits per nestling
0
4
6
low highmed
8
10
2
low highmed
brood size = 2 brood size = 3
Waiting time (multiple of T*
R
)
Individual
f
d
c
b
a
e
g
h
i
j
k
l
0 3.02.52.01.51.00.5
summer
winter
1
st
time winter
A.
B.
Figure 8.4. Harder work with higher self-feeding by (A) Canada gray jays hoarding raisins and (B) Pales-
tinian sunbirds. (A) Measured threshold waiting times (plus 95% CI) relative to a standard for nine in-
dividual jays (a–i) measured in summer (solid circles) and again in winter (solid squares), when the
self-feeding rate was lower. Individuals worked harder (waiting time was shorter) in summer when
the self-feeding rate was higher. The waiting times for three jays measured for the first time in winter
( j–l, open squares) indicate that an order effect cannot explain the observed difference. (After Waite and
Ydenberg 1994a). (B) The number (with SE) of parental nest visits per nestling for Palestinian sunbirds
with broods of two or three nestlings receiving low (0.25 M), medium (0.75 M), or high (1.25 M) sucrose
concentrations in feeders on their territories.
8.4 Energy Metabolism and Provisioning Capacity
Davidson (1997; see also Kay 2004) found that tropical rainforest canopy
ecosystems are dominated in both numbers and biomass by several hard-
working ant species. These “high-tempo” species all feed on plant or homop-
BOX 8.2 Provisioning and Spatial Patterns of Resource
Exploitation
Provisioning masonbees (Osmialignaria) feed themselves nectar,but deliver
both pollen and nectar to their nests. Williams and Tepedino (2003) placed
nest boxes so that bees could fly in one direction to a patch of flowers
with a high nectar content, but little pollen (Heterophyllum capitatum), or in
the opposite direction to a patch with high-pollen but low-nectar flowers
(Salix spp.). By examining pollen loads on returning bees, they concluded
that the bees must have visited patches of both types of flowers on virtually
every provisioning trip, in spite of the fact that this must have involved a
lot of extra travel. How could this happen?
To model this situation, consider a provisioner with a central place
located midway between two food patches. Patch 1 provides food for self-
feeding and for delivery to the central place, while patch 2 provides food
only for self-feeding. Are there any conditions under which a delivery-
maximizing provisioner should visit both patches?
Each time the provisioner visits patch 1, it collects a load of size L
for delivery, which requires time t
p
. Round-trip travel to either patch
requires time t
t
. On each visit to patch 1, the provisioner must spend time
t
s1
self-feeding to cover the energetic costs of the trip. Alternatively, the
provisioner couldcover its costs by traveling occasionally to patch 2, where
it can achieve a higher self-feeding rate, and spending time t
s2
self-feeding.
To balance its energy budget using this two-patch tactic, the provisioner
must make x (x < 1) trips to patch 2 (on average) for each trip to patch 1.
When using onlypatch 1, theprovisioner achieves adeliveryrate of d
1
=
L/(t
t
+t
s1
+t
p
). When ituses both patches, it candeliver at rated
2
=L/[(1 +
x)t
t
+ x (t
s1
+ t
p
)]. The provisioner should use both patches if d
2
> d
1
.
Substituting our delivery rate expressions and simplifying gives
x(t
t
+t
s
2
)< t
s
1
In words, it makes sense to use both patches when the time that the pro-
visioner must commit to self-feeding from patch 2 (which includes the trav-
el time there and back) is less than the self-feeding time at patch 1. One can
easily find combinationsof parametervalues for whichthis conditionholds.
Although they do not use this modeling format, Williams and Tepedino
(2003) propose essentially this explanation for the puzzling provisioning
behavior of mason bees.
Provisioning 289
teran exudates (honeydew)—substances that provide lots of energy but little
protein. Workers consume these high-energy foods while they feed protein-
rich prey (mostly arthropods) to the brood. The provisioning framework
developed in section 8.3 emphasizes the relationship between a provisioner’s
energy metabolism (expressed as c
i
, the energy expenditure rate of delivery
tactic i), fueled by self-feeding at rate b
s
−c
s
, and the consequent delivery rate
(called d
i
). These parameters summarize many aspects of an organism’s phys-
iological ecology. This section explores some features of energy metabolism
relevant to provisioning models and provides a framework for understanding
how it is that some species can be so hard-working.
Consider again our stereotypical avian central place forager that works as
hard as possible delivering prey to its offspring. Over the past three decades,
many studies have sought to characterize energetic capabilities by measuring
and comparing energetics in the field. Drent and Daan (1980) argued that
free-living birds could not expend more than four times their basal metabolic
rate (BMR). Kirkwood (1983) reached a similar value by comparing records
of maximum food intake for various species. More recently, Hammond and
Diamond (1997) compiled information on the maximum sustained metabolic
scope (SMS), measured as the ratio of mass-adjusted sustainable metabolic rate
(SusMR; kJ/gd) to resting metabolic rate (RMR; kJ/gd), and found that it
ranges widely among species, but has a median value of about four. Similarly,
there is great interspecific variation among social insect species in the speed
and energetic cost of worker task performance (called “tempo” by Oster and
Wilson 1978).
In the most comprehensive review of the avian literature, Williams and
V
´
ezina (2001) listed more than fifty field studies that measured the energetic
expenditureof birdsduringreproduction, and concludedthatour understand-
ing of intraspecific variation remains rudimentary. The fact that two con-
generic seabirds, the masked booby (Sula sula) and the gannet (Sula bassanus),
show strikingly different work rates (1.6 BMR for boobies and 6.6 BMR for
gannets) illustrates the depth of our ignorance. How does this variation arise?
Why don’t all provisioners work hard? Ecologists usually turn to life history
theory to explain this variation, but this subsection considers purely energetic
possibilities.
The development of equation (8.2) assumed no limit on the amount of
energy that a provisioner can expend, but some sort of limit probably exists.
Several things might limit daily energy expenditure, including access to food,
the rate at which muscles can generate power to do work, or the rate at
which fuel or oxygen can be assimilated or distributed to the musculature
(Hammond and Diamond 1997). These limitations could influence provision-
ers in several ways. If access to food limited the rate of energy expenditure,
290 Ronald C. Ydenberg
then a provisioner’s time would all be occupied either by self-feeding or
by delivering prey. When food is abundant, in contrast, self-feeding would
allow a high rate of energy intake, but limitations on muscular activity or
assimilation might limit the provisioner’s energetic output. In the face of
these processing limitations, a provisioner could either spend some of the day
resting in order to avoid exceeding the maximum sustainable expenditure (as
in some seabirds; Houston et al. 1996) or (if assimilation limits the conversion
of input to energetic output) use reserves to increase the total daily energetic
expenditure.
If the objective is to maximize total daily delivery, a time-limited provi-
sioner should maximize delivery per unit time, and an observer would record
performance matching the predictions of a rate-maximizing currency. How-
ever, when energy expenditure limits total daily delivery, a rate-maximizing
provisioner would reach the expenditure ceiling before the end of the avail-
able time, and would have to spend the remainder of its time resting. In this
scenario, it makes sense to maximize delivery per unit energy expenditure
(i.e., maximize efficiency), and models show that less expensive options that
deliver at a lower rate can achieve a higher overall rate of delivery in these
situations. In this case, an observer would record behavior that matches the
predictions of efficiency or modified efficiency currencies. These issues are
treated more fully by Hedenstr
¨
om and Alerstam (1995), Ydenberg (1998),
Houston and McNamara (1999), and Nolet and Klaassen (2005). Thus, provi-
sioning behavior operates within an envelope bounded at one extreme by rate
maximization and bounded at the other extreme by efficiency maximization.
Self-feeding rates determine the predicted behavior: high self-feeding rates
should shift provisioners toward higher workloads, while low self-feeding
should have the opposite effect.
Why should some provisioners have high energy capacities while others
have low energy capacities? Hammond and Diamond (1997) suggest that
animals with high energy capacities need expensive metabolic machinery,
including organswith high metabolic rates suchas the liver, heart, andkidneys
(Daan et al. 1990; see also section 5.3). Enhanced metabolic performance (e.g.,
Suarez 1996, 1998) can evolve under selection or develop on a physiological
time scale within individuals, but it always comes at the cost of a metabolic
machine that is more expensive to run. So why does it make sense for some
animals to maintain this expensive machinery while others do not?
In the framework developed here, potential delivery depends not only on
prey availability but also on the provisioner’s capacity for hard work, which
in turn requires fuel from self-feeding. If high delivery rates enhance fitness,
then better self-feeding opportunities also allow increased metabolic capacity.
For example, dominant individuals probably have better access to food (e.g.,
Hogstad 1988),and socan supporthigher metabolicrates. Bryantand Newton
Provisioning 291
Daily energy expenditure
Daily self-feeding
Total daily delivery
down-regulated
metabolism
up-regulated
metabolism
r
down
k
up
r
up
k
down
s*
Figure 8.5. Hypothetical scheme of relationships between total daily delivery (on y-axis), resting
metabolic rate (r), self-feeding rate, daily energy expenditure, and maximum daily energy expenditure
(k)(allonx-axis). Total daily self-feeding and total daily energy expenditure must balance. As self-feeding
increases, the provisioner can expend and deliver more. The lower curve shows the relationship for a
“down-regulated” metabolism, and the upper curve for an “up-regulated” metabolism. Up-regulation
gives higher deliver capacity, but also generates a higher resting metabolic rate, and so is more expen-
sive to maintain. In the example shown, the provisioner benefits from up-regulated metabolism when the
attainable self-feeding rate exceeds the rate labeled s
∗
.
(1994; see also Hogstad 1987) interpret the higher BMR of dippers (Cinclus
cinclus) as a cost of dominance, but if high BMR translates into better provi-
sioning, the chain of causation could be reversed: the higher BMR may be a
benefit of dominance. Figure 8.5 shows these relationships diagrammatically.
Davidson (1997) suggests that some ant species dominate rainforest cano-
pies because they can easily obtain high-energy exudates that favor the evolu-
tion of hightempos.These high-tempoantspecies candeliverprotein resources at
a high rate and can vigorously defend territories, traits that in turn lead to the
high reproductive rates that give these species their dominance. This example
shows the broader ecological consequences of provisioning behavior.
Other social insect studies suggest similar relationships. Four honeybee
species in the genus Apis show marked differences in worker mass-specific
metabolic rate, colony metabolism, and the intensity of provisioning. The high-
tempo species (A. mellifera and A. cerana) deliver more resources than the low-
tempo species (A. dorsata and A. florea) and produce offspring at a greater rate,
but have higher worker mortality (Dyer and Seeley 1991). We can examine
the great interspecific variation in metabolic expenditure documented among
birdsin the sameway.Infact, some investigatorshypothesizethatendothermy
itself—a particularly expensive metabolic mechanism—has evolved to en-
hance aerobic capacity and support the vigorous exercise required in many
forms of provisioning and parental care (Farmer 2000).
As these examples imply, close ecological relationships connect the ener-
getically expensive activities of animals (such as provisioning), the foraging
292 Ronald C. Ydenberg
behavior that obtains the fuel, and the metabolism that powers the activity.
Nonetheless, few studies have as yet considered these ideas and their implica-
tions.
8.5 Demand and Provisioning
An increase inbrood size or an approaching period of shortage can increase the
demand for delivered food. None of the provisioning models described so far
consider variations in demand. Their assumptions and equations incorporate
only “supply-side” parameters such as encounter rate (e.g., waiting time),
travel distance, self-feeding rate, and the energetic cost of delivery. This section
considers how demand may affect provisioning. What properties should we
expect provisioning strategies to have for responding to demand?
A large number of excellent studies on birds and social insects demonstrate
that provisioners respond to natural variation in demand, increasing the deliv-
ery of materials when demand rises and vice versa. We expect this, of course;
demand varies in nature. Demand can vary predictably (e.g., nestlings grow),
or unpredictably (e.g., bad weather). Experimentalists have used a variety of
methods to manipulate demand. In studies of birds, the most common exper-
imental technique manipulates clutch or brood size. Interest has been concen-
trated on the fitness consequences for parents and offspring, with little atten-
tion given to the tactics parents use to increase delivery. Social insect studies have
usually focused on how colonies recover their populations and stored reserves
after an experimentally imposed demand. A few studies have considered the
behavior of individual workers (Cartar 1991; Schmid-Hempel et al. 1993).
Provisioners mightuse severalbasic tacticsto meetincreased demand.First,
provisioners could simply spend more time provisioning. The longer hours of
work willnecessarily increasetheir dailyenergy expenditure.Second, aprovi-
sioner can work harder—for example, by flying faster. When experimenters
remove pollen stores from a beehive, more workers collect pollen, and each
individual worker works harder at the task (Eckert et al. 1994). Third, provi-
sioners can use energy from body reserves to fuel extra delivery effort. And
finally, provisioners can alter the selection of prey for delivery. I discuss fuel-
ing of delivery from reserves and prey selection in the next few paragraphs.
Powering Delivery from Stored Reserves
Provisioners can overcome the limits imposed by self-feeding on energetic
expenditure by using reserves to fuel activity (Houston 1993). Many studies
have reported reductions in the body mass of parent birds during periods of
Provisioning 293
intenseprovisioning activity (e.g.,Moreno1989). Most researcherstakethisto
indicate that energy expenditures exceed energy intake during provisioning.
A parallel body of results describes the responses of social insect colonies,
especially honeybees, to the challenges of imposed parasite loads ( Janmaat
et al. 2000) or removal of pollen (Fewell and Winston 1992). These studies
commonly show that colonies reduce their reserves as they react to the manip-
ulation and recover to their former state.
In analyzing whether provisioners should “dip into” theirreservesto ad-
dress an unexpected demand, most models assume that reduction of the provi-
sioner’s stores has life history costs, such as an increased risk of starvation. The
provisioner must balance these costs against the advantages of increased deliv-
ery capacity. Nur’s (1987) model provides a paradigmatic example. It seeks to
explain patterns in the provisioning responses of songbird parents to (manip-
ulations of ) brood size. The model assumes that increased feeding frequency
increases nestling weight and survival, but reduces parental weight and sur-
vival. Nur concludes that parents feed larger broods more frequently because
the greater fitness value of the brood makes increased effort worthwhile (see
also Beauchamp et al. 1991).
Swifts (Apus apus) delivered more food to experimentally enlarged broods,
but each nestling received less, resulting in a lower mean chick mass (at age
12 days; Martins and Wright 1993b). In addition, Martins and Wright found
that parents lost mass during the provisioning period, and they assumed that
a reduction in self-feeding caused this weight loss. They argued that this weight
loss imposes a risk on parental survival, but others have suggested that provi-
sioning swifts may lower their body weights to reduce flight costs. Neither
idea seems complete. Why is mass loss risky, given that parents can recover
quickly? On the other hand, if lowering mass lowers flight costs, why don’t
all parents lose weight?
Thinking about the relationship between the use of a fat reserve and self-
feeding suggests a slightly different explanation. A small reserve of fat could
boost a parent’s delivery rate, either by providing the power for a period of
energetic expenditure above the sustainable limit or by reducing the need for
self-feeding for a brief period. A provisioner could expend this fat reserve
slowly and steadily on a programmed schedule to meet a predictable increase
in demand (e.g., growing nestlings), or it could expend its reserve all at once to
meet demand during unpredictably poor conditions (e.g., cold, rain). Under
many circumstances, the provisioner would be able to “restock” its reserve
when conditions improve. The key idea here is that expending the reserve
need not endanger the provisioner’s survival. The provisioner maintains the
reserve (presumably at a small ongoing cost to provisioning capacity) in order
to buffer provisioning capacity against fluctuations in prey availability.
294 Ronald C. Ydenberg
Prey Selection
Provisioners can alter their selection of prey for delivery, and this gives them
another way to address the problems of increased demand. Scores of papers,
including many good experimental studies, reveal that provisioners change
the size or type of prey delivered when the demand at the delivery point
changes (e.g., Siikam
¨
aki et al. 1998; see Moore 2002 for a review). In some
cases, parents deliver larger prey to larger offspring; this could occur for the
simple reason that small offspring cannot swallow large prey. A more so-
phisticated hypothesis holds that parents change prey selection to boost the
energy delivery rate. For example, when experimenters increase brood size,
European starling parents deliver poorer but more easily obtained prey, in-
creasing the delivery of energy at the expense of other nutrients (Wright et
al. 1998).
A third possible hypothesis involves variance sensitivity (Stephens and
Krebs 1986). (The ecological literature usually calls this concept “risk sensi-
tivity,” a term borrowed from economics, where it refers to variable returns
on invested capital. Unfortunately, ecologists also use the term “risk” in other
ways, as in “risk of predation.” Substituting the terms “variance” or “danger,”
as appropriate, eliminates any potential confusion.) From their beginnings, cen-
tralplace foragingmodelsfocused on howchangesin provisioning tactics(e.g.,
selectivity in a single-prey loader) affect the mean delivery rate. If there is any
stochasticity in components of the provisioning process (e.g., capture time,
handling time, prey size), there will also be variance about the mean delivery
rate. The variance itself will also be affected by the tactic chosen. So, in the
most general case, provisioning tactics affect both the mean and variance of
delivery rates.
Variance becomes important when deviations above and below the mean
delivery rate have different effects on fitness. The original development of
variance sensitivity theory focused on starvation avoidance (Stephens and
Krebs 1986). In these “shortfall-avoidance” models, falling below a require-
ment results in a different fitness outcome (starvation) than exceeding it
(survival). However, the basic idea applies whenever the cost of falling below
the mean differs from the benefit of exceeding the mean. Thus, we expect that
provisioners will show variance-sensitive behavior when fitness increments
resulting from delivery above and below the mean are unequal (Ydenberg
1994). This asymmetry could arise via falling short, as the early model imag-
ined, but it could also arise if the growth (and hence fitness) of offspring shows
diminishing returns with delivery.
Figure 8.6 gives a worked example to show how variance sensitivity can
Provisioning 295
shape provisioning tactics. A parent common tern (Sterna hirundo) flies from
its breeding colony to a lake, where it searches for a fish. Fish vary in size, and
the tern encounters them sequentially as it flies over the lake. When highly
selective, a tern spends more time searching for a suitable fish, but delivers
larger fish than when it is less selective. As the tern becomes increasingly
selective, the total daily delivery initially rises because it delivers larger fish,
but the delivery rate falls if the tern becomes too selective, because it then
spends too much time searching for a suitable fish. Selectivity also affects
the variance in daily delivery: at low selectivities, the tern spends little time
catching prey and most of its time ferrying small prey to the nest. This tactic
leads to a total daily delivery rate with little variation. For a selective tern, on
the other hand, the time to capture an acceptable item varies greatly, and the
variation in total daily delivery rises.
Moore (2002) calculated the total daily delivery resulting from each possi-
ble prey selection tactic usinga computersimulation. Moore’s simulation created
stochasticity by randomly drawing prey items from a given size distribution.
Each timethe simulated provisioner encountered a prey item, the computer
applied a minimum acceptable prey size rule. When the item exceeded the
minimum size, the provisioner delivered it to the nest; otherwise, the provi-
sioner continued searching. The program computed total daily delivery for
1,000 simulated days, then calculated the mean and standard deviation of total
daily deliveryfrom this distribution. Moore (2002)used the “z-score” method
of Stephens andCharnov (1982)to show thatwhen thedemand at thenest rises
above the expected delivery, provisioners should adopt more variance-prone
tactics, which in this case means becoming more selective (i.e., delivering
larger prey). In field experiments, he manipulated the brood size of common
terns and found that, as predicted, the mean size of prey delivered increased
with brood size (see fig. 8.3.1). Moreover, natural variation in brood size and
interannual variation in prey availability led to changes in prey selection that
Moore couldexplain in the same way.Moore’sstudy suggests that common
tern parental provisioning repertoires regularly include variance-sensitive re-
sponses. Box 8.3 explores this idea further.
So far, I have illustrated how any one of several basic tactics can influ-
ence the delivery that a provisioner can attain, but this one-at-a-time analysis
probably does not reflect reality. In nature, real provisioners must simulta-
neously decide what kind of prey to deliver, how fast to fly, and where to
search. The empirical studies by Moore (2002) and Wright et al. (1998) on the
common tern and starling provide the most complete pictures to date. Both
studies found that in response to experimentally manipulated brood sizes,
parents changed the amount of time they spent delivering and altered their