Stephens & Foraging - Behavior and Ecology - Chapter 10 pps
Bạn đang xem bản rút gọn của tài liệu. Xem và tải ngay bản đầy đủ của tài liệu tại đây (242.41 KB, 32 trang )
10
Foraging with Others:
Games Social Foragers Play
Thomas A. Waite and Kristin L. Field
10.1 Prologue
On a bone-chilling winter night in the far north, a lone wolf travels
through theboreal forestlooking forhis nextmeal. Thehalf-dozen pack
members in the adjacent home range howl periodically throughout the
night. With each chorus, he resists the urge to howl in return. With
each chorus, he feels the pull to cross over the ridge, descend into the
cedar swamp below, and attempt to join the pack—to give up the soli-
tary life. Suddenly, just before daybreak, he happens upon an ancient,
arthritic moose. The chase begins. The moose flounders in the deep
snow. Within minutes, the wolf subdues the moose, his tenth such suc-
cess of the winter. He feeds beyond satiation and then rolls into a ball
and sleeps. At first light, ravens arrive, gather around the carcass, and
begin to feed. By midday, several dozen ravens are busily engaged in
converting the carcass into hundreds of scattered hoards.
Later that winter, the same wolf travels through the adjacent home
range, having recentlybecome a member of the pack. Again, he happens
upon a vulnerable moose. The chase begins. Within minutes, he and his
new packmates manage to bring down the moose. As the newcomer in
the pack, he must wait for his turn to feed. At first light, ravens begin
to gather nearby and wait for their turn at the carcass. At midday, the
ravens are still biding their time.
332 Thomas A. Waite and Kristin L. Field
10.2 Embracing the Complexity of Social Foraging
The vast majority of carnivores live solitarily. Why, then, do wolves (Canis
lupus) live in social groups? Surely, you might think, the advantages of social
foraging must favor group living (sociality) in wolves. But the data suggest
that wolves live in packs despite suffering reduced foraging payoffs (Vucetich
et al. 2004). The data suggest that an individual wolf would often achieve a
higher food intake rate if it foraged alone rather than as a member of a pack.
So it appears that sociality persists despite negative foraging consequences.
Why? Perhaps parents accept a reduction in their own intake rates if the be-
neficiaries are their own offspring (Ekman and Rosander 1992). But why
would any individual stay in a pack if it could do better on its own?
In this chapter, we illustrate some theoretical approaches to analyzing such
problems. We show that packs may form through retention of nutritionally
dependent offspring, but we cannot readily explain why individuals with de-
veloped hunting skills belong to groups. This failure of nepotism as a general
explanation prompts further analysis of the foraging payoffs. We incorporate
a previously overlookedfeature of wolf foraging ecology, the cost of scaveng-
ing by ravens. And voila! Predicted group size increases dramatically. Thus,
it appears that benefits of social foraging favor sociality in wolves after all.
Throughout this chapter, we describe situations in which foraging payoffs
depend not solely on an individual’s own actions, but also on the actions of
others. Thiseconomic interdependencemeans that thestudy ofsocial foraging
requires game theory(Giraldeau andLivoreil1998). Italso impliesthatanimals
may forage socially even if they never interact. Conventional foraging theory
(Stephens and Krebs 1986) in effect assumes that foragers are economically
independent entities. Until recently, the study of social foraging proceeded
without aunified theoretical framework.Fortunately, Giraldeau andCaraco’s
(2000) recent book provides a synthesis of game theoretical models of social
foraging that remedies this situation. The basic principle of such models is
that the best tactic for a forager depends on the tactics used by others.
According to the classic patch model from conventional foraging theory
(Charnov 1976b; see chap. 1 in this volume), a forager should depart for
another patch when its instantaneous rate of gain drops to the habitat-at-large
level. To illustrate the difference between conventional and social foraging,
we examine how this patch departure threshold differs for solitary versus
social foragers. Consider the following scenario (Beauchamp and Giraldeau
1997; Rita et al. 1997): An individual (producer) finds a patch, and forages
alone initially, but then other individuals (scroungers) join the producer, ar-
riving one at a time (cf. Livoreil and Giraldeau 1997; Sjerps and Haccou 1994).
Each scrounger depresses the producer’s intake rate by interfering with the
Foraging with Others: Games Social Foragers Play 333
producer’s foraging. If interference is strong, the producer may leave im-
mediately when the first scrounger arrives, even if it must spend a long time
traveling to the next patch. Thus,a scrounger’s arrival can lead a social forager
to leave a patch much sooner than a solitary forager would. This scenario (see
also box 10.1) emphasizes the basic theme that the economic interdependence
of foraging payoffs shapes the decision making of social foragers.
BOX 10.1 The Ideal Free Distribution
Ian M. Hamilton
The Ideal Free Distribution (IFD; Fretwell and Lucas 1969) predicts the
effects of competition for resources on the distribution of foragers between
patchesdiffering inquality,assuming that foragersare“ideal” (able togauge
perfectly the quality of all patches) and “free” (able to move among patches
at no cost). The original IFD model assumed continuous input of prey and
scramble competition. Undercontinuous input, resourcescontinuously arrive
and are instantlyremoved by foragers.Assuming equalcompetitiveabilities
and no foraging costs, the payoff of foraging in patch i is the rate of renewal
of the resource, Q
i
, shared among N
i
foragers in the patch. At equilibrium,
foragers will be distributed so that none can improve its payoff by unilater-
ally switching patches. In the original model, the ratio of forager densities
between two patches at equilibrium matches that of the rates of resource
input intothe patches(i.e., N
i
/N
j
=Q
i
/Q
j
). Thismatch inratios isknown
as the input matching rule. At equilibrium, the fitness payoff to foragers is
also equal in all patches. The input matching rule holds even for predators
that do not immediately consume prey upon its arrival, so long as the only
source of prey mortality is consumption by the predators (Lessells 1995).
There have been numerous modifications of the original model. Re-
laxing the ideal and free assumptions of the original model can result in
undermatching, or lower use of high-quality patches than expected based on
resource distribution (Fretwell 1972; Abrahams 1986). Undermatching is
a common finding in tests of the IFD (Kennedy and Gray 1993; but see
Earn and Johnstone 1997). Other modifications include changing the form
of competition and the currency assumed in the model. In this box I briefly
review these ideas. Extensive reviews of IFD models and empirical tests
can be found in Parker and Sutherland (1986), Milinski and Parker (1991),
Kennedy and Gray (1993), Tregenza (1995), Tregenza et al. (1996), van
der Meer and Ens (1997), and Giraldeau and Caraco (2000).
(Box 10.1 continued)
Continuous Input, Unequal Competitors
If forager phenotypesdifferin theirabilitiesto compete forprey,and iftheir
relative abilities remain the same in all patches, then there are an infinite
number of stable distributions of phenotypes between patches (Sutherland
and Parker 1985). However, all of these distributions are consistent with
competitive-weight matching. If each individual is weighted by its competitive
ability, the ratio of the summed competitive weights in each patch matches
the ratio of resource input rates. At equilibrium, the mean intake rates are
equal across patches.
If relative competitive abilities differ among patches, a truncated pheno-
type distribution is predicted (Sutherland and Parker 1985). Foragers with
the highest competitive abilities aggregate in patches where competitive
differences have the greatest effect on fitness payoffs, and those with the
lowest competitive abilities are found where competitive differences have
the smallest effect. Average intake rate is higher for better competitors.
Interference
Continuous input prey dynamics are rare in nature (Tregenza 1995). Inter-
ference models applywhen preydensities areconstantor graduallydecrease
over time and when the quality of patches to foragers reversibly decreases
with increasing competitor density. There are several ways to model in-
terference, which lead to different predicted distributions (reviewed in
Tregenza 1995; van der Meer and Ens 1997). The simplest of these is the
addition of an “interference constant,” m (Hassell and Varley 1969), to the
effects of forager density on patch quality, so that the payoff for choos-
ing patch i is Q
i
/N
i
m
(Sutherland and Parker 1985). When m < 1, more
competitors use the high-quality patch than expected based on the ratio of
patch qualities. When m> 1, the opposite is predicted. When phenotypes
differ in competitive ability, this model predicts a truncated phenotype
distribution.
Kleptoparasitism
One form of interference that has been extensively investigated is klep-
toparasitism, in which some individuals steal resources acquired by others.
If kleptoparasitism does not change the average intake rate, but simply
reallocates food from subordinates to dominants, no stable distribution is
predicted (Parker and Sutherland 1986).
(Box 10.1 continued)
Models based onthe transition of foragers among behavioral states,such
as searching, handling, and fighting, have also been used to investigate the
influence of kleptoparasitism on forager distributions (Holmgren 1995;
Moody and Houston 1995; Ruxton and Moody 1997; Hamilton 2002).
These models reach stable equilibria and predict greater than expected use
of high-quality patches by all foragers when competitors are equal (Moody
and Houston 1995; Ruxton and Moody 1997) and by dominant foragers
(Holmgren 1995) or kleptoparasites (Hamilton 2002) when competitors
are not equal.
Changing Currencies
The previous models all use net intake rate as the currency on which de-
cisions are based. The IFD has also provided fertile ground for models ex-
ploring how animals balance energetic gain and safety (Moody et al. 1996;
Grand and Dill 1999) and for empirical studies seeking to measure the
energetic equivalence of predation risk (Abrahams and Dill 1989; Grand
and Dill 1997; but see Moody et al. 1996). Hugie and Grand (2003) have
shownhow such “non-IFD”considerationsasavoidingpredators or search-
ing for mates affect the distribution of unequal competitors (see above),
resulting in a unique, stable equilibrium.
Some authors have also used IFD models to examine the interaction
between predatordistributions and those of theirprey whenboth can move
(Hugie and Dill 1994; Sih 1998; Heithaus 2001). These models predict that
predators tend to aggregate in patches that are rich in resources used by
their prey. If patches also differ in safety, prey tend to aggregate in safer
patches, even when these patches are relatively poor in resources.
A recent model by Hughes and Grand (2000) used growth rate, rather
than intakerate, asthe fitnesscurrency inan unequal-competitors, continu-
ous-input model of the distribution of fish. In fish, like other ectotherms,
growth rate isstrongly influencedby temperature, andthis model predicted
temperature-based segregation ofcompetitive types(bodysizes) whenpatches
differed in temperature.
This scenario also shows how social foraging can have both positive and
negative consequences.Individuals may benefitfrom foragingsocially because
groups discover more food or experience less predation. In general, individ-
uals may benefit by joining others who have already discovered a resource.
336 Thomas A. Waite and Kristin L. Field
However, joining represents a general cost of social foraging. “Whenever
some animals exploit the finds of others, all members of the group do worse
than if no exploitation had occurred. The almost inevitable spread of scroung-
ing behavior within groups and its necessary lowering of average foraging
rate may be considered a cost of group foraging” (Vickery et al. 1991, 856).
Recent work has revealed that foragers may sacrifice their intake rate to stay
close to conspecifics (Delestrade 1999; Vasquez and Kacelnik 2000; see also
Beauchamp et al. 1997). Other work has shown that social foragers may ac-
quire poor information (i.e., about a circuitous, costly route to food) (Laland
and Williams 1998). In the extreme, joining can lead to an individual’s demise
through tissue fusion (see section 10.5).These examples highlight the intrinsic
complexity of social foraging.
This chapter reviews theoretical and empirical developments in the study
of social foraging. Throughout, we explore joining decisions: When should a
solitary individual join a foraging group? When should a group member join
another member’s food discovery? When should an individual join another
through fusion of their peripheral blood vessels? We begin by exploring the
economic logic of group membership. Next, we review producer-scrounger
games, in which individuals must decide how to allocate their time between
searching for food (producing) and joining other individuals’ discoveries
(scrounging). Finally, we review work on cooperative foraging.
10.3 Group Membership
Predicting Group Size
Stable Group Size Often Exceeds Rate-Maximizing Group Size
Many animals find themselves in a so-called aggregation economy, in
which individuals in groups experience higher foraging payoffs than solitary
individuals (e.g., Baird and Dill 1996; review by Beauchamp 1998). Peaked
fitness functions are the hallmark of such economies (fig. 10.1; Clark and
Mangel 1986; Giraldeau and Caraco 2000). By contrast, animals in a disper-
sion economy experience maximal foraging payoffs when solitary and strictly
diminishing payoffs withincreasing groupsize (e.g., B
´
elisle 1998). Inan aggre-
gation economy, theper capita rate of intake increases initiallywith increasing
group size G. However, because competition also increases with group size
G, intake rate peaks (at G
∗
) and then falls with further increases in group size.
Clearly, this situation favors group foraging, but can we predict group size?
It might seem that the observed group size G should match the intake-
maximizing groupsize G
∗
, atwhich each groupmember maximizesits fitness.
Foraging with Others: Games Social Foragers Play 337
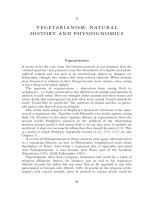
Figure 10.1. Hypothetical relationship between group size G and an unspecified surrogate for fitness
(e.g., net rate of energy intake). This general peaked function is characteristic of an aggregation economy,
in which individuals gain fitness with increasing G, at least initially. G
∗
(= 3) is the intake-maximizing
group size. G may exceed G
∗
because a solitary individual would receive a fitness gain by joining the
group. G may continue to grow until it reaches
ˆ
G (= 6), the largest size at which each individual would do
better to be in the group than to be solitary. G is not expected to exceed
ˆ
G because a joiner that increases
G to
ˆ
G + 1 would achieve greater fitness by remaining solitary.
Many studies,however, havefound thatG oftenexceeds G
∗
(Giraldeau 1988).
This mismatch is notunexpected. With a peak inthe fitness function at G
∗
(see
fig. 10.1), the intake-maximizing group is unstable because a solitary forager
can benefit from joining the group. A group of size G
∗
will grow as long as
foragers dobetter in thatgroup than ontheir own, butit should notexceed the
largest possibleequilibrium group size
ˆ
G. Atthat point, solitaryindividuals do
better to continue foraging alone than to join such a large group. Equilibrium
group size may be as small as the intake-maximizing group size G
∗
and as
large as the largest possible equilibrium size
ˆ
G, depending on whether the
individual or the group controlsentry and on the degree of geneticrelatedness
between individuals (box 10.2).
Thanks to the development of this theory, it is no longer paradoxical to
find animals in groups larger than the intake-maximizing group size G
∗
. Yet
the role of foraging payoffs in the maintenance of groups of large carnivores
remains contentious (see Packer et al. 1990 for a fascinating case study).
The wolves discussed in the prologue present a paradox, because pack size
routinely exceeds the apparently largest possible equilibrium size
ˆ
G.Why
would a wolf belong to a pack when it could forage more profitably on its
own? Here we attempt to resolve this paradox while reviewing the theory
on group membership.
BOX 10.2 Genetic Relatedness and Group Size
Giraldeau and Caraco (1993) analyzed the effects of genetic relatedness
on group membership decisions. Consider a situation in which individuals
benefit from increasing group size, and in which all individuals are related
by a coefficient r. According to Hamilton’s rule, kin selection favors an
altruistic act (e.g., allowing an individual to join the group) when rB−C >
0, where B is the net benefit for all relatives at which the act is directed
and C is the cost of the act to the performer. In the context of group
membership decisions, both effects on others (E
R
) and effects on self (E
S
)
can be either positive or negative, so we rewrite Hamilton’s rule as
rE
R
+ E
S
> 0. (10.1.1)
Group-Controlled Entry
In some social foragers, group members decide whether to permit solitaries
to join the group. Such groups should collectively repel a potential group
member (i.e., keep the group at size G) when Hamilton’s rule is satisfied.
Here E
R
is the effect of repelling the intruder on the intruder:
E
R
= (1) − (G + 1), (10.1.2)
and E
S
is the effect of repelling the intruder on the group:
E
s
= G[(G) − (G + 1)], (10.1.3)
where (1) is the direct fitness of the solitary intruder, (G) is the direct
fitness of each of G individuals in the current group, and (G + 1) is
the direct fitness of each individual if the group decides not to repel the
intruder. (As we highlight below, the group-level decision is based on
the selfish interests of the individual group members.) Substituting these
expressions for the effects of repelling the intruder on the intruder [E
R
;
eq. (10.1.2)] and on the group [E
S
; eq. (10.1.3)] into equation (10.1.1) and
dividing all terms by G, we see that selection favors repelling a prospective
joiner when
r
G
[(1) − (G + 1)] + [(G) − (G + 1)] > 0, (10.1.4)
where we express both the indirect fitness (first term on the left-hand side)
and the direct fitness (second term) of group members on a per capita basis.
By extension, group members should evict an individual from the group
when rE
R
+ E
S
> 0. Here the effect on the evicted individual E
R
is
Foraging with Others: Games Social Foragers Play 339
(Box 10.2 continued)
(1) − (G), and the effect on the remaining group members E
S
is (G −
1)[(G − 1) − (G)].
Equation (10.1.4)indicates that repelling is neverfavored when1 < G <
G
∗
, where G
∗
is the group size at which individual fitness is maximized,
but repelling is always favored when G>
ˆ
G, where
ˆ
G is the largest group
size at which the individual fitness of group members exceeds that of a
solitary. Thus, equilibrium (stable) group size must fall within the interval
G
∗
<G<
ˆ
G. Under group-controlled entry, the effect of increasing genetic
relatedness is toincrease theequilibriumgroup size.By contrast, ifpotential
joiners can freely enter the group, genetic relatedness has the opposite
effect.
Free Entry
Under free entry, group members do not repel potential joiners; thus,
potential joiners make group membership decisions. Any such individual
should join a group when Hamilton’s rule is satisfied, where E
R
is the
combined effect of joining on all the joiner’s relatives:
E
R
= (G −1)[(G) − (G − 1)], (10.1.5)
and E
S
is the effect of joining on the joiner:
E
S
= (G) − (1). (10.1.6)
Substituting, we see that joining a group of size (G−1) is favored when
r (G − 1)[(G) − (G − 1)] + [(G) − (1)] > 0. (10.1.7)
An analysis of equation (10.1.7) reveals that, under free entry, the effect
of increasing genetic relatedness is to decrease equilibrium group size. (For
derivation of the expressions for equilibrium group size under both entry
rules, see Giraldeau and Caraco 2000.)
Rate-Maximizing Foraging and Group Size
In wolf packs, group members control entry. Thus, pack size should fall
somewhere between the intake-maximizing group size G
∗
and the largest
possible equilibrium size
ˆ
G (see box 10.2). The data show that a group size
of two maximizes net per capita intake rate and that individuals would do
worse in a larger group than alone (i.e., G
∗
=
ˆ
G = 2; see fig. 3 in Vucetich
et al. 2004). Thus, this initial analysis cannot explain pack living.
340 Thomas A. Waite and Kristin L. Field
Variance-Sensitive Foraging and Group Size
Our initial attempt might have failed for lack of biological realism. We
assumed that each individual would obtain the mean payoff for its group size.
However, in nature, the realized intake rate of an individual might deviate
widely from the average rate. In principle, a reduction in intake rate variation
with increasing group size could translate into a reduced risk of energetic
shortfall. However, a variance-sensitive analysis indicates that an individual
will have the best chance to meet its minimum requirement if it forages with
just one other wolf (see fig. 4 in Vucetich et al. 2004). Its risk of shortfall will
be higher in a group of three or more than alone. Thus, once again, foraging
models fail to explain pack living.
Genetic Relatedness and Group Size
So far, foraging-based explanations seem unable to account for the mis-
match between group size predictions and observations. Kin selection would
seem to provide a satisfactory explanation (e.g., Schmidt and Mech 1997). Af-
ter all, wolf packs form, in part, through the retention of offspring. However,
kin-directed altruism (parental nepotism) does not account for the observa-
tion that pack size routinely exceeds the largest possible equilibrium group
size
ˆ
G. Although we expect group size to increase with genetic relatedness
when groups control entry (see box 10.2), theory predicts that equilibrium
group size cannot exceed
ˆ
G, even in all-kin groups (Giraldeau and Caraco 1993).
Recalling that for wolves, the largest possible equilibrium group size
ˆ
G =
2, kin selection cannot explain pack living. This does not mean, however,
that group size should never exceed two. Consider immature wolves, which
cannot forage independently. If evicted, they would presumably achieve an
intake rate of virtually zero. Under this assumption, Hamilton’s (1964) rule
(see box 10.2) predicts group membership for nutritionally dependent first-
order relatives (i.e., offspring or full siblings). However, individuals that can
achieve the average intake rate of a solitary adult should not belong to groups,
even all-kin groups (fig. 10.2). Thus, while kin selection offers an adequate
explanation for packs comprising parents and their immature offspring, we
still have not provided a general explanation for wolf sociality. How do we
account for packs that include unrelated immigrants and mature individuals?
Is there an alternative foraging-based explanation that has evaded us?
Kleptoparasitism and Group Size
Inclusion of a conspicuous feature of wolf foraging ecology, loss of food to
ravens(Corvuscorax), increasesthepredicted groupsize dramatically (fig.10.3).
Both rate-maximizing (fig. 10.3) and variance-sensitive currencies predict
large pack sizes, even for small amounts of raven kleptoparasitism. Why does
Foraging with Others: Games Social Foragers Play 341
14
4
2
2
68
-2
-1
-3
Pack size, G
rE
R
+ E
S
1210
3
0
1
16 18
ESS is not to repel
ESS is to repel
Immature kin (r=0.5)
mature kin (r=0.5)
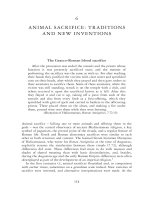
Figure 10.2. The application of Hamilton’s rule to predict whether mature and immature solitary wolves
should be allowed in packs of various sizes when the pack controls group entry (see also fig. 5 in
Vucetich et al. 2004). The pack should repel any individual that attempts to increase the pack size from G
to G + 1whenrE
R
+ E
S
> 0 (i.e., above dotted line), where r is the coefficient of relatedness, E
R
is the fit-
ness effect on a repelled intruder, and E
S
is the fitness effect of repelling the intruder on the current group
members (see box 10.2). The points corresponding to G > 2 are based on the reciprocal exponential
function for net rate of food intake (see fig. 10.1). Mature solitaries, assumed to have developed hunting
skills, are assumed to achieve the average net intake rate of a solitary adult. Immature solitaries, with un-
developed hunting skills, are assumed to obtain no prey and to expend energy at 3 × BMR (=(3 × 3,724
kJ/d)/(6,800 kJ/kg) =−1.6 kg/d). A group comprising first-order relatives (r =0.5) should accept an
immature solitary with undeveloped hunting skills, but repel any mature solitary even if it is close kin.
including this cost shift the economic picture so dramatically? The key insight
here is that individual wolves in larger packs must pay a greater cost in terms
of food sharing with other wolves, but this cost is offset by the reduced
loss of food to scavenging ravens. Such economic realities may commonly
favor sociality in carnivores that hunt large prey and thus are vulnerable to
kleptoparasitism (see Carbone et al. 1997; Gorman et al. 1998).
This case study highlights the value of applying formal theory. The failure
of kin selectionto explainwolfsociality promptedus tocontinuethe searchfor
a foraging-based explanation. Without modern theory on group membership
decisions, we might have been satisfied to attribute large pack size in wolves
to kin selection and unknown factors. Instead, our conclusions now lead us to
ask why group members would prevent entry into the pack and why observed
pack size is smaller than predicted (see fig. 10.3). The next subsection offers
some perspective.
Recent Advances in the Theory of Group Membership
Recent theoretical studies have provided insights into the flexibility of group
membership decisions. One such study used optimal skew theory to predict
342 Thomas A. Waite and Kristin L. Field
Figure 10.3. Relationship between pack size and average daily per capita net rate of intake assuming
either negligible or minor scavenging pressure by ravens (see also fig. 6 in Vucetich et al. 2004). To
assess how raven scavenging might affect the predicted relationship between pack size and intake rate,
we first considered how pack size and rate of loss to scavengers (kg/d) affect the number of days required
to consume the carcass of an adult moose (295 kg). For a given pack size and rate of loss, we calculated
carcass longevity assuming a consumption rate of 9 kg/d/wolf. Then, to obtain kg/wolf/day as a function
of pack size and number of ravens, we multiplied the kg/wolf/kill (a function of pack size and loss to
scavengers) by the kills/day (a function of pack size).
group size (Hamilton 2000). This study modeled the division of resources as
a game between an individual (recruiter) that controls access to resources and
a potential recruit. If another individual’s presence benefits the recruiter (fig.
10.4), the recruiter may provide an incentive to join or stay. The incentive
may increase the recruit’s foraging payoff, reduce its predation risk, or both.
We restrict our attention to the simple case in which the incentive provides
a foraging payoff. For joining to be profitable, this incentive must cause the
recruit’s payoff to equal or exceed the payoff it would obtain by remaining
solitary.
This model predicts that the stable group size will fall between G
∗
(equal
division of resources and group-controlled entry) and a maximum stable
group size
ˆ
G (equal division of resources and free entry). Stable group size
increases as the recruiter’s control over resource division decreases (fig. 2 in
Hamilton 2000). As this control decreases and the benefits of group mem-
bership increase, predicted group size G shifts from being transactional (i.e.,
where the recruiter provides an incentive) to nontransactional (i.e., where
the joiner obtains a sufficient payoff without using any of the recruiter’s re-
sources) (see fig. 10.4). In transactional groups, the recruiter and joiners agree
about group size because the stable size is the same for all parties. However, in
nontransactional groups, there may be conflict over group size. Factors that
reduce the recruiter’s control (e.g., minimal dominance) or increase the ben-
efits of group membership (e.g., large food rewards) will also increase the
Foraging with Others: Games Social Foragers Play 343
Figure 10.4. Numerical example of the joint effect of foraging (x-axis) and antipredation benefits (y-axis)
favoring solitary versus social foraging. The panels represent situations in which the recruiter is assumed
to have complete (D = 0, upper left panel) or varying degrees of incomplete (D = 0.04, 0.1, and 0.2)
control over the division of resources. If the recruiter has complete control over the division of resources,
all groups are transactional (i.e., the recruiter provides a joining incentive). Under incomplete control
(e.g., D = 0.2, lower right panel), as the benefits of group foraging increase, groups switch from being
transactional to nontransactional (i.e., the recruiter provides no joining incentive). If the benefits of group
foraging are sufficiently high, the recruiter and joiners may be in conflict over group size (i.e., group size
may exceed the optimum from the recruiter’s perspective). (After Hamilton 2000.)
likelihood of conflict. In nontransactional groups, group size is likely to be
stable only if joiners accrue no antipredation benefits. If joiners receive forag-
ing benefits only, group size is likely to remain small (close to G
∗
)andunder
the control of the recruiter. However, if joiners accrue both antipredation
344 Thomas A. Waite and Kristin L. Field
and foraging advantages, group size is likely to be unstable. Predicted group
size may increase to the maximum stable group size
ˆ
G.
A compelling question remains: if models tell us that group size will
equilibrate around some stable size, then why are observed group sizes so
variable? A recent study used a dynamic model to address this question.
Specifically, Martinez and Marschall (1999) asked why juvenile groups of the
coral reef fish Dascyllus albisella vary in size (range: 1–15 individuals). They
uncovered an explanation not only for why observed group size varies, but
also for why it may often fall below the intake-maximizing group size G
∗
.
Consider the natural history of D. albisella. Following a pelagic larval stage,
these fish return to a reef, where they settle into juvenile groups. Martinez and
Marschall modeled the joining decision as a trade-off between body growth
(faster in smaller groups) and survival (better in larger groups), assuming that
individuals reaching maturity by a specified date joined the adult population.
When larvae encounter a group into which they may potentially settle, they
must decide whether to join or to continue searching. By assumption, a larva
settles only if the fitness value of doing so (i.e., the product of size-specific
fecundity and probability of recruitment) exceeds the fitness value of further
searching.
Rather than groups of a set size, Martinez and Marschall found that a range
of acceptable group sizes arose from the fitness-maximizing choices of indi-
viduals. Their analysis suggests that, on any given day, fitness is maximized by
settling in any encountered group that falls within the acceptable range. The
policy for a larva settling early in the season is to settle in large groups (G
∗
=
9), which have high survival rates. By contrast, a small larva searching late in
the season should settle as a solitary or join a very small group; otherwise, it
will not grow fast enough to reach maturity. This dynamic joining policy cre-
ates persistent variation in group size, whereas conventional theory predicts
that group size will equilibrate around a stable size.
The combination of this dynamic joining model with Ian Hamilton’s re-
cruiter-joiner model would allow new questions: Should current members
provide a joining incentive to recruit new members? In the case of the coral
reef fish D. albisella, would the size of this incentive depend on date, the
recruit’s body size, or current group size? Would increased foraging skew in
large groups reduce the upper limit of acceptable group size earlier in the
season? Would many more individuals choose to settle as singletons? Would
the theory predict highly variable final group sizes? Under what conditions is
group size stable? We expect Ian Hamilton’s recruiter-joiner approach to play
a key role in the development of group size theory, particularly in systems in
which resource owners benefit from the presence of other individuals.
Foraging with Others: Games Social Foragers Play 345
10.4 Producing, Scrounging, and Stable Policies
This section considers how animals should behave once they find themselves
in a group in which some individuals parasitize the discoveries of others. This
scrounging behavior is a pervasive feature of group foraging (Giraldeau and
Beauchamp 1999). But should individuals always join others’ discoveries?
Doesn’t scrounging become unprofitable if everyone does it? What is the
optimal scrounging policy, and what factors affect the decision? Behavioral
ecologists have analyzed these questions using two antagonistic approaches,
information-sharing(IS) andproducer-scrounger(PS) models.Herewebriefly
review these approaches and recent experiments that have tested them (see
reviews by Giraldeau and Livoreil 1998; Giraldeau and Beauchamp 1999;
Giraldeau and Caraco 2000).
Information-Sharing versus Producer-Scrounger Models
Information-sharing (IS) models assume that each group member concur-
rently searches for food and monitors opportunities to join the discoveries
of others (Clark and Mangel 1984; Ranta et al. 1993). When a member dis-
covers a food patch, information about the discovery spreads throughout the
group, and by assumption, all members stop searching and converge on the
patch to obtain a share. When individuals can search for food and for joining
opportunities simultaneously, the only stable solution to the basic informa-
tion-sharingmodel isto join everydiscovery (BeauchampandGiraldeau 1996;
but see extensions by Ruxton et al. 1995; Ranta et al. 1993, 1996; Rita and
Ranta 1998; see also Ranta et al. 1998).
Producer-scrounger (PS) models, by contrast, assume that an individual
cannot search simultaneously for food (the producer tactic) and for joining
opportunities (the scrounger tactic) (Barnard and Sibly 1981). This incompa-
tibility has important consequences for the optimal policy. Scroungers cannot
contribute to the group discovery rate, so any increase in the frequency of
scroungers reduces opportunities for scrounging. This relationship makes the
payoff function for scrounging negatively frequency-dependent. When there
are few scroungers, scrounging pays well. When everybody is a scrounger,
there is nothing to scrounge, and producing pays well. The classic producer-
scrounger game (box 10.3) predicts that foragers should adjust their scroung-
ing frequency to a stable equilibrium (denoted by
ˆ
q). At that equilibrium fre-
quency, no one gains by switching from producer to scrounger or vice versa.
In the terminology of game theory, this solution is a mixed evolutionarily
stable strategy (ESS).
BOX 10.3 The Rate-Maximizing Producer-Scrounger Game
According to the classic producer-scrounger (PS) model (Vickery et al.
1991), each member of a social foraging group must decide how to allo-
cate its time between two mutually incompatible tactics, producing (i.e.,
searching for food) and scrounging (i.e., searching for opportunities to
exploit discoveries of others). The core assumption of the model is that in-
dividuals adjust their proportional use of the scrounger tactic to maximize
their long-term rate of energy gain (but see Ranta et al. 1996). These ad-
justments lead to an equilibrium scrounger frequency at which producers
and scroungers obtain the same payoffs and no individual can benefit from
unilaterally altering its behavior.
At any moment, some proportion p of the G group members use the
producer tactic, and the remaining q = 1−p individuals use the scrounger
tactic. While using the producer tactic, an individual encounters food
patches containing F items at rate λ. Upon each encounter, the producer
obtains a items for its exclusive use before being joined by qG scroungers
who “share” the remaining A food items (F = a + A) with the producer
and one another. For an individual using the producer tactic, the expected
cumulative intake I
p
by time T is
I
p
=
λT
(a + A/n)
, (10.2.1)
where n (=qG +1) is the number of scroungers joining the discovery plus
the producer of the patch. For an individual using the scrounger tactic, the
expected cumulative intake I
s
by time T depends on the proportion p(=
1−q) of individuals using the producer tactic:
I
s
=
λT
[(1 − q )GA/n)]
. (10.2.2)
Setting these two expressions equal to each other and rearranging yields
an expression for the equilibrium frequency of the scrounger tactic:
ˆ
q = 1 −
a
F
+
1
G
, (10.2.3)
which implies that individuals should adjust their proportional use of for-
aging tactics in response to the finder’s share (a/F)andthesizeofthe
group. This rate-maximizing PS model [eq. (10.2.3)] predicts that an
Foraging with Others: Games Social Foragers Play 347
(Box 10.3 continued)
individual should reduce its proportional use of the scrounger tactic in
response to an increase in the finder’s share or a decrease in group size.
However, neither the rate of encounter with patches (λ)northetime
horizon (T) influences the predicted producer-scrounger equilibrium (see
“Testing the Variance-Sensitive Producer-Scrounger Game”).
Theoreticians have modeled the producer-scrounger situation as both a
rate-maximizing (Vickery et al. 1991) and a variance-sensitive game (Caraco
and Giraldeau 1991; reviewed by Giraldeau and Livoreil 1998; Giraldeau
and Caraco 2000). In the rate-maximizing game, the predicted equilibrium
frequency of scrounging
ˆ
q decreases as a function of the finder’s share of the
food items (see box 10.3). In the variance-sensitive game, the scrounging
frequency
ˆ
q depends on both the finder’s share and the potential joiner’s
energetic requirement. The following discussion describes experimental tests
of these two games.
Testing the Rate-Maximizing Producer-Scrounger Game
Therate-maximizing producer-scroungergamepredicts thattheproportional
use of the scrounger tactic
ˆ
q increases with group size G and decreases as the
finder’s share increases (see box 10.3). Giraldeau and his colleagues tested
the effect of the finder’s share in a series of experiments using spice finches
(Lonchura punctulata). These smallseed-eating birds forage in flockswith nearly
egalitarian social relationships. The spice finch’s ground-feeding habit makes
reasonable the assumption of incompatibility between searching for food and
searching for joining opportunities. An early experiment revealed that the
finder’s share (a/F) was negatively related to the extent of food patchiness
(Giraldeau et al. 1990). So in the experiments described below, Giraldeau
and his colleagues manipulated food patchiness to test the predicted effect of
finder’s share on equilibrium scrounger frequency
ˆ
q.
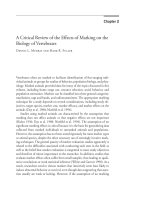
Giraldeau et al. tested spice finch flocks at three levels of food patchiness:
very patchy, intermediate patchiness, and uniform. This procedure indirectly
manipulated the average finder’s share. As predicted, use of the scrounger
tactic decreased as finder’s share increased (fig. 10.5; see also Giraldeau et al.
1994). The observed use of the scrounger tactic matched the rate-maximizing
scrounger frequency
ˆ
q reasonably well, but typically fell well below the basic
information-sharing model’s prediction. Thus, spice finches appear to balance
Proportion scrounger
Day
Proportion producer
0
0.25
0.50
0
6
3
9
0.75
1.0
12
15
18
1.0
0.75
0.50
0.25
0
Flock C
0
0.25
0.50
0
6
3
9
0.75
1.0
12
15
18
1.0
0.75
0.50
0.25
0
Flock B
Flock A
0
0.25
0.50
0
6
3
9
0.75
1.0
12
15
18
1.0
0.75
0.50
0.25
0
Figure 10.5. The observed (mean + 1 SE) proportional use of producer (left y-axis) and scrounger (right y-
axis) tactics in three five-member groups of captive spice finches (L. punctulata). Each experimental group
was tested using a unique series of three seed distributions (200 seeds distributed evenly among 10, 20,
or 30 patches). By manipulating seed distribution, the experimenters indirectly manipulated the average
realized finder’s share (i.e., flock A: 0.20, 0.27, 0.33; flock B: 0.33, 0.27, 0.20; flock C: 0.27, 0.33, 0.20).
As predicted, in all three flocks the proportional use of the scrounger tactic decreased as the average
realized finder’s share increased. The dashed horizontal lines indicate the predicted rate-maximizing
behavior. (After Giraldeau and Beauchamp 1999; originally described in Giraldeau and Livoreil 1998;
see also Giraldeau and Caraco 2000.)
Foraging with Others: Games Social Foragers Play 349
producing and scrounging as the rate-maximizing producer-scrounger game
predicts.
However, this study, like all previous studies, has several shortcomings. It
failed to establish that producing and scrounging were truly incompatible or
that the payoff for the scrounger tactic was negatively frequency-dependent.
It also failed to establish whether the foragers converged on the equilibrium
scrounging frequency
ˆ
q, at which both tactics provide the same payoff. For-
tunately, a recent study by Mottley and Giraldeau (2000) addresses each of
these concerns.
Evidence for Negative Frequency Dependence
Mottley and Giraldeau designed an experimental apparatus that forced
individuals to use either the producer or the scrounger tactic. To achieve this,
they divided a cage into a producer and a scrounger compartment. An opaque
partition prevented individuals from moving between the compartments.
On the producer side, individuals could perch at any of twenty-two patches
(half of which were empty) and pull a string to gain access to seeds. On the
scrounger side, individuals could gain access to food only by sharing seeds
produced by a bird on the other side.
Using this apparatus, Mottley and Giraldeau directly manipulated the fre-
quency of tactics.For example, by placing all six subjects in theproducer com-
partment, Mottley and Giraldeau could quantify the payoffs to producers
in the absence of scroungers. By testing subjects in every permutation, they
described the entire payoffcurve for each tactic. Figure 10.6shows the results.
The payoff for the scrounger tactic decreased markedly as the frequency of
scroungers increased, justifying the producer-scrounger game’s assumption
of negative frequency dependence.
The experiment used two patch conditions. In the uncovered condition, a
producer’s string-pulling action released seedsinto an uncovered collecting dish
that was easily accessible to the producer and any scrounger. In the covered
condition, a partial cover limited scroungers’ access to food. By varying
the payoffs to producers and scroungers, this manipulation generated two
predicted producer-scrounger equilibria that Mottley and Giraldeau could
explore in a follow-up experiment.
Converging on Predicted Equilibria
To test whether group-foraging spice finches would converge on the
predicted equilibria, Mottley and Giraldeau modified their apparatus to allow
movement between the producer and scrounger compartments. Their results
show that subjects converged first on the predicted scrounger frequency in
350 Thomas A. Waite and Kristin L. Field
Figure 10.6. Evidence in support of the assumption that foraging payoffs for scrounging are negatively
frequency-dependent (i.e., payoff for the scrounger tactic declines with increases in the proportion of indi-
viduals in the group using that tactic). Mean (+ 1 SE) observed food intake rates are shown for producing
and for scrounging in three captive flocks (A, B, and C) of spice finches as a function of the number of in-
dividuals (out of six) scrounging. Subjects were tested under two patch conditions, covered and uncovered. In
the covered patch condition, subjects experimentally constrained to use the scrounger tactic experienced
reduced access to food. The purpose of these two patch conditions was to generate two distinct predic-
tions for the equilibrium proportional use of the scrounger tactic. (After Mottley and Giraldeau 2000.)
the covered-patch condition and then on the higher predicted scrounger
frequency in the uncovered-patch condition. These results constitute the best
evidence to date that social foragers can adjust their scrounging frequency to
predicted levels.
Foraging with Others: Games Social Foragers Play 351
Testing the Variance-Sensitive Producer-Scrounger Game
Although theevidence justpresented supportsthe rate-maximizingproducer-
scrounger game, it does not eliminate alternatives that minimize the risk of
energetic shortfall (Caraco 1981, 1987; Caraco and Giraldeau 1991). To eval-
uate this possibility, Koops and Giraldeau (1996) exploited the fact that
rate-maximizing and variance-sensitive producer-scrounger models make
different predictions about the effect of patch encounter rate λ (and hence
patch density) on equilibrium scrounger frequency
ˆ
q. As box 10.3 shows,
the rate-maximizing model predicts that patch encounter rate λ should not
affect scrounger frequency, so a manipulation of patch density should not
affect scrounger frequency. By contrast, variance-sensitive models predict
that scrounger frequency should increase with patch density. Risk-sensitive
foragers should adjust their scrounging in response to patch density for two
reasons. First, the scrounger tactic yields a lower variance in expected payoff
than the producer tactic. In addition, any increase in patch density increases
mean intake rate. So, when patch density is high, variance-sensitive foragers
should switch to the more conservative scrounging tactic. Koops and Gi-
raldeau tested this prediction using captive European starlings (Sturnus vul-
garis). As predicted, all eight subjects scrounged more when Koops and Gi-
raldeau increased patch density. The rate-maximizing producer-scrounger
model does not predict this flexibility. The results suggest that scrounger may
be a variance-sensitive tactic, not strictly a rate-maximizing tactic.
Conclusions and Prospects
These results suggest that the producer-scrounger game provides useful in-
sights into the dynamics of foraging groups.The best test to date (Mottley and
Giraldeau 2000) forced individuals to play either producer or scrounger, so
that the experimenters could unambiguously assign individuals to either pro-
ducer or scrounger, and could be sure that the payoff to scroungers decreased
with thefrequency of scroungers,as the modelsrequire. With theassumptions
of theproducer-scrounger game satisfied,spice finchesconverged onthe stable
equilibrium frequency of scrounging. What remains unclear is whether nat-
ural foraging groups generally meet these assumptions. Future work should
explore the incompatibility between producing and scrounging (Coolen et al.
2001) under natural conditions. Rather than viewing producer and scrounger
as discrete alternatives, future theoretical work could consider the possibil-
ity that some individuals can search concurrently for food and scrounging
opportunities, but that attentional constraints may limit performance (Dukas
1998b; Dukas and Kamil 2000). In systems in which individuals benefit from
352 Thomas A. Waite and Kristin L. Field
the presence of others (see fig. 10.3), the recruiter-joiner modeling approach
may be appropriate (Hamilton 2000).
In addition to developing a general theory of the evolution of scrounging,
future work should test elaborations of the producer-scrounger game (see
Giraldeau and Beauchamp 1999). The study of joining policies appears to
be in the beginning stages. Future workers should not restrict themselves
to studying joining where fitness gains are straightforward, but should also
pursue the more puzzling problem of cooperative joining, where individuals
pay an apparent or real price in personal fitness. In the next section, we review
some exciting developments in the study of the evolution of cooperative
foraging.
10.5 Cooperative Games Unrelated Social Foragers Play
Up tonow, we havefocused oncompetition withinforaging groups.The only
exceptions have been group-membership games in which a cooperative indi-
vidual has obvious selfish motives. First, through kin-directed restraint (see
box 10.2), an individual that permits a genetic relative to join the group may
gain through the indirect component of inclusive fitness. Obligately social
animals such as ants and naked mole-rats provide extreme examples (Sherman
et al. 1991, 1995). Second, Hamilton’s (2000) recruiter-joiner model tells us
that an individual may provide an incentive to a recruit, provided that re-
cruit’s presence increases the recruiter’s fitness (for an example of shared pa-
ternity and egalitarian provisioning in the Galapagos hawk, see Faaborg et al.
1995). These routes to social foraging fit nicely within the “selfish gene”
framework (Dawkins 1976). However, we find it more difficult to explain
cooperative foraging between unrelated individuals, where the donor pays
a cost. Some cooperative arrangements seem evolutionarily unstable because
the donor could gain by “defecting.” Here we offer a brief review of two
evolutionary pathways—reciprocity and mutualism—to stable cooperation
between unrelated individuals (see Reeve 1998 for a review of game theo-
retical models of cooperative kin groups). We then consider whether truly
unselfish cooperative foraging can evolve through trait-group selection.
In this section, we adopt Dugatkin’s (1997, 1998) definition of coopera-
tion as “an outcome that—despite potential costs to individuals—is ‘good’
(measured by some appropriate fitness measure) for the members of a group
of two or more individuals and whose achievement requires some sort of
collective action.” This definition implies that an individual can cooperate
unilaterally. In other words, to cooperate, an individual need only perform
an act that would achieve cooperation if other individuals also were to act
Foraging with Others: Games Social Foragers Play 353
appropriately. This definition of cooperation helps us quantify the payoffs in
game theory matrices, because we can say that any given player “cooperated”
if its opponent defected.
Reciprocity versus Mutualism
Here we describe the logic involved in using payoff matrices in a game theo-
retical framework. Thisapproach entails specifying players, a set ofbehavioral
options, and the consequences (payoffs) of these options, which depend on
the actions of others. By making these assumptions explicit, one can predict
when cooperative behavior should occur. To generate these predictions, one
searches for the evolutionarily stable strategy (ESS).
Why Do Sentinels Cooperate?
We all know of situations in which humans take turns acting as sentries.
Some group-living birds and mammals also “post” sentries (Bednekoff 1997;
Clutton-Brock et al. 1999; Blumstein 1999; Wright et al. 2001). Sentinels
position themselves in prominent positions where they can scan for approach-
ing predators. When a sentinel detects a predator, it usually gives an alarm
call. Group members often behave in a highly coordinated way, seemingly
taking turns at sentinel duty. The protection provided by a single sentinel
allows other group members to spend less time on vigilance and more time
on foraging and other activities.
Why would any individual voluntarily engage in this seemingly danger-
ous, selfless behavior? The conventional answer has been that kin selection
or reciprocity favors sentinel behavior. Before we outline reciprocity-based
explanations of sentinels, however, we should acknowledge that sentinel be-
havior might not be dangerous after all. If sentinels are safe, then we can
explain sentinels via mutualism, without the complex apparatus of kin selec-
tion and reciprocity (Bednekoff 1997).
Reciprocity and the Prisoner’s Dilemma
Models of cooperation via reciprocity focus on the Prisoner’s Dilemma
game (Trivers 1971; Axelrod and Hamilton 1981). The ESS in the Prisoner’s
Dilemma is defection, even though mutual cooperation would yield a higher
payoff. To see this, imagine two unrelated foragers faced with the prospect
of cooperating (acting as sentinel) or defecting (refusing to act as sentinel).
Under the payoffs in the matrix shown below, these players would be trapped
in a Prisoner’s Dilemma: The players face a dilemma because defection yields
a higher payoff regardless of what the opponent chooses (i.e., T > R and
P >S), and yet two defectingplayers receive less than two cooperating players
354 Thomas A. Waite and Kristin L. Field
Player 2
Cooperate Defect
Player 1 Cooperate R = 3 S = 0
Defect T = 5 P = 1
(P < R). In game theoretical terminology, the payoff matrix of the Prisoner’s
Dilemma game satisfies conditions T >R >P >S and R >(S+T)/2, where T
is temptation to defect, R is reward for mutual cooperation, P is punishment
for mutual defection, and S is sucker’s payoff.
For a singleplay ofthegame, wealways predictdefection,but repeatedplay
of the game can make cooperation a rational choice. Axelrod and Hamilton
(1981) confirmed this in a famous computer tournament in which they tested
a range ofstrategies against eachother. The winning strategy,tit for tat (TFT),
cooperates on the first play and copies its opponent’smove on each subsequent
play. Tit for tat is evolutionarily stable if the probability of encountering the
same player in the future is sufficiently high. Since animals with sentinel
systems livein stablegroups, tit-for-tat-likereciprocity might explainsentinel
behavior, but only if the payoff matrix really satisfies the conditions of the
Prisoner’s Dilemma game.
While it maybe tempting to argue that reciprocity or kin selectionexplains
sentinel behavior, any such argument would be speculative at best because no
study has quantifiedthe complete payoff matrix. Moreover, Bednekoff (1997)
challenged this explanation, arguing that simple self-interest may explain
sentinel behavior.
By-product Mutualism
Bednekoff argues that sentinel behavior may be a by-product mutualism.
In a by-product mutualism, “each animal must perform a necessary minimum
itself that may benefit another individual as a byproduct; these are typically
behaviors that a solitary individual must do regardless of the presence of
others, such as hunting for food” (Brown 1983). Thus, cooperative alliances
maybe favoredsimply because eachindividual benefitsfromother individuals’
selfish actions.
The payoff matrix for a by-product mutualism will look something like
this:
Player 2
Cooperate Defect
Player 1 Cooperate R = 5 S = 3
Defect T = 2 P = 0
Foraging with Others: Games Social Foragers Play 355
In this matrix, the players have no incentive to defect. By-product mutu-
alism is the simplest, and perhaps the most common, pathway to cooperation.
Unlike other pathways, it does not require relatedness (kin selection), cog-
nitive abilities allowing scorekeeping (reciprocity), or population structure
(Dugatkin 1997). Cooperators need not even be conspecifics.
By-product Mutualism among Safe, Selfish Sentinels?
What if sentinel behavior isn’t dangerous after all? Bednekoff (1997) ar-
gued that sentinels might be safe and selfish rather than unsafe and selfless. He
reasoned thateven if theyincrease their riskof being thetarget ofpredators, an
improved ability to detect and avoid predators might outweighthis risk. Even
if sentinels expose themselves to minimal predation risk, they must pay an
opportunity cost because they cannot forage and act as sentinel simultane-
ously. We might expect, therefore, that individuals will act as sentinels only
when their energetic reserves are high. In addition, if a single sentinel pro-
vides an adequate early-warning defense, then even a well-fed individual will
serve as a sentinel only when no one else is doing so. According to Bed-
nekoff’s model, sentinel behavior depends on both the prospective sentinel’s
nutritional state and the actions of others.
Combining thesestate-dependent and frequency-dependentaspects ofsen-
tinel behavior, Bednekoff developed a dynamic game to explore whether a
coordinated sentinel system could emerge from the decisions of selfish indi-
viduals. In this game, each individual chooses forager or sentinel based on
its energetic state and the actions of others. Provided group members share
alarm information, a single sentinel greatly reduces everyone’s predation risk,
and additional sentinels add little protection from surprise attacks (fig. 10.7).
Thus, an individual receives a large safety benefit if it acts as a sentinel when
all other group members are foraging. However, an individual may not be
able to forgo the foraging opportunity if its energetic state is too low. When
no other individuals are acting as sentinels, Bednekoff’s model predicts that
a focal individual will serve as a sentinel even when its reserves are relatively
low (fig. 10.8). However, when another individual is already acting as a sen-
tinel, our focal individual is relatively safe, and so it should act as a sentinel
only if its energetic state is near the maximum. The net effect is a sentinel
system that appears highly coordinated even though simple selfishness guides
the actions of each player. Thus, elaborate coordination and altruism emerge
as a by-product of simple self-interested behavior.
Two recent studies support this model. First, meerkats (Suricata suricatta), a
small social mongoose of South Africa, showed increases in various measures
of sentinel activity in response to supplemental feeding (Clutton-Brock et
al. 1999). Second, individual Arabian babblers (Turdoides squamiceps), a highly