Biochemistry, 4th Edition P8 docx
Bạn đang xem bản rút gọn của tài liệu. Xem và tải ngay bản đầy đủ của tài liệu tại đây (441.39 KB, 10 trang )
2.1 What Are the Properties of Water? 33
among the H
2
O molecules. To be specific, hydrophobic interactions between non-
polar molecules are maintained not so much by direct interactions between the
inert solutes themselves as by the increase in entropy when the water cages coalesce
and reorganize. Because interactions between nonpolar solute molecules and the
water surrounding them are of uncertain stoichiometry and do not share the equal-
ity of atom-to-atom participation implicit in chemical bonding, the term hydrophobic
interaction is more correct than the misleading expression hydrophobic bond.
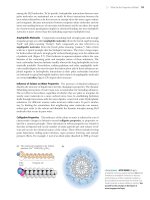
Amphiphilic Molecules Compounds containing both strongly polar and strongly
nonpolar groups are called amphiphilic molecules (from the Greek amphi meaning
“both” and philos meaning “loving”). Such compounds are also referred to as
amphipathic molecules (from the Greek pathos meaning “passion”). Salts of fatty
acids are a typical example that has biological relevance. They have a long nonpo-
lar hydrocarbon tail and a strongly polar carboxyl head group, as in the sodium salt
of palmitic acid (Figure 2.7). Their behavior in aqueous solution reflects the com-
bination of the contrasting polar and nonpolar nature of these substances. The
ionic carboxylate function hydrates readily, whereas the long hydrophobic tail is in-
trinsically insoluble. Nevertheless, sodium palmitate and other amphiphilic mole-
cules readily disperse in water because the hydrocarbon tails of these substances are
joined together in hydrophobic interactions as their polar carboxylate functions
are hydrated in typical hydrophilic fashion. Such clusters of amphipathic molecules
are termed micelles; Figure 2.7b depicts their structure.
Influence of Solutes on Water Properties The presence of dissolved substances
disturbs the structure of liquid water, thereby changing its properties. The dynamic
H-bonding interactions of water must now accommodate the intruding substance.
The net effect is that solutes, regardless of whether they are polar or nonpolar, fix
nearby water molecules in a more ordered array. Ions, by establishing hydration
shells through interactions with the water dipoles, create local order. Hydrophobic
substances, for different reasons, make structures within water. To put it another
way, by limiting the orientations that neighboring water molecules can assume,
solutes give order to the solvent and diminish the dynamic interplay among H
2
O
molecules that occurs in pure water.
Colligative Properties This influence of the solute on water is reflected in a set of
characteristic changes in behavior termed colligative properties, or properties re-
lated by a common principle. These alterations in solvent properties are related in
that they all depend only on the number of solute particles per unit volume of sol-
vent and not on the chemical nature of the solute. These effects include freezing
point depression, boiling point elevation, vapor pressure lowering, and osmotic
pressure effects. For example, 1 mol of an ideal solute dissolved in 1000 g of water
The sodium salt of palmitic acid: Sodium
palmitate (Na
+ –
OOC(CH
2
)
14
CH
3
)
(a)
Na
+
C
O
O
–
CH
2
CH
2
CH
2
CH
2
CH
2
CH
2
CH
2
CH
2
CH
2
CH
2
CH
2
CH
2
CH
2
CH
2
CH
2
Polar
head
Nonpolar tail
–
–
–
–
–
–
–
–
–
–
–
–
–
–
–
–
(b)
ACTIVE FIGURE 2.7 (a) An
amphiphilic molecule: sodium palmitate. (b) Micelle
formation by amphiphilic molecules in aqueous
solution. Because of their negatively charged sur-
faces, neighboring micelles repel one another and
thereby maintain a relative stability in solution. Test
yourself on the concepts in this figure at
www.cengage.com/login
34 Chapter 2 Water:The Medium of Life
(a 1 m, or molal, solution) at 1 atm pressure depresses the freezing point by 1.86°C,
raises the boiling point by 0.543°C, lowers the vapor pressure in a temperature-
dependent manner, and yields a solution whose osmotic pressure relative to pure
water is 22.4 atm (at 25°C). In effect, by imposing local order on the water mole-
cules, solutes make it more difficult for water to assume its crystalline lattice (freeze)
or escape into the atmosphere (boil or vaporize). Furthermore, when a solution
(such as the 1 m solution discussed here) is separated from a volume of pure water
by a semipermeable membrane, the solution draws water molecules across this bar-
rier. The water molecules are moving from a region of higher effective concentra-
tion (pure H
2
O) to a region of lower effective concentration (the solution). This
movement of water into the solution dilutes the effects of the solute that is present.
The osmotic force exerted by each mole of solute is so strong that it requires the
imposition of 22.4 atm of pressure to be negated (Figure 2.8).
Osmotic pressure from high concentrations of dissolved solutes is a serious prob-
lem for cells. Bacterial and plant cells have strong, rigid cell walls to contain these
pressures. In contrast, animal cells are bathed in extracellular fluids of comparable
osmolarity, so no net osmotic gradient exists. Also, to minimize the osmotic pressure
created by the contents of their cytosol, cells tend to store substances such as amino
acids and sugars in polymeric form. For example, a molecule of glycogen or starch
containing 1000 glucose units exerts only 1/1000 the osmotic pressure that 1000
free glucose molecules would.
Water Can Ionize to Form H
ϩ
and OH
Ϫ
Water shows a small but finite tendency to form ions. This tendency is demonstrated
by the electrical conductivity of pure water, a property that clearly establishes the
presence of charged species (ions). Water ionizes because the larger, strongly elec-
tronegative oxygen atom strips the electron from one of its hydrogen atoms, leav-
ing the proton to dissociate (Figure 2.9):
HOOOH ⎯⎯→ H
ϩ
ϩ OH
Ϫ
Two ions are thus formed: (1) protons or hydrogen ions, H
ϩ
, and (2) hydroxyl ions,
OH
Ϫ
. Free protons are immediately hydrated to form hydronium ions, H
3
O
ϩ
:
H
ϩ
ϩ H
2
O ⎯⎯→ H
3
O
ϩ
Indeed, because most hydrogen atoms in liquid water are hydrogen bonded to a
neighboring water molecule, this protonic hydration is an instantaneous process
and the ion products of water are H
3
O
ϩ
and OH
Ϫ
:
H
H
H
H
H
+
OH
–
O
H
HOO +
Nonpermeant
solute
(b)(a) (c)
Semipermeable
membrane
H
2
O
22.4 atm
1m
ACTIVE FIGURE 2.8 The osmotic pres-
sure of a 1 molal (m) solution is equal to 22.4 atmo-
spheres of pressure. (a) If a nonpermeant solute is sepa-
rated from pure water by a semipermeable membrane
through which H
2
O passes freely, (b) water molecules
enter the solution (osmosis) and the height of the solu-
tion column in the tube rises.The pressure necessary to
push water back through the membrane at a rate
exactly equaled by the water influx is the osmotic pres-
sure of the solution. (c) For a 1 m solution, this force is
equal to 22.4 atm of pressure. Osmotic pressure is direct-
ly proportional to the concentration of the nonper-
meant solute. Test yourself on the concepts in this fig-
ure at www.cengage.com/login
O
H
H
+
–
+
OH
H
ACTIVE FIGURE 2.9 The ionization of
water. Test yourself on the concepts in this figure at
www.cengage.com/login
2.2 What Is pH? 35
The amount of H
3
O
ϩ
or OH
Ϫ
in 1 L (liter) of pure water at 25°C is 1 ϫ 10
Ϫ7
mol;
the concentrations are equal because the dissociation is stoichiometric.
Although it is important to keep in mind that the hydronium ion, or hydrated
hydrogen ion, represents the true state in solution, the convention is to speak of hy-
drogen ion concentrations in aqueous solution, even though “naked” protons are
virtually nonexistent. Indeed, H
3
O
ϩ
itself attracts a hydration shell by H bonding to
adjacent water molecules to form an H
9
O
4
ϩ
species (Figure 2.10) and even more
highly hydrated forms. Similarly, the hydroxyl ion, like all other highly charged
species, is also hydrated.
K
w
, the Ion Product of Water The dissociation of water into hydrogen ions and hy-
droxyl ions occurs to the extent that 10
Ϫ7
mol of H
ϩ
and 10
Ϫ7
mol of OH
Ϫ
are pres-
ent at equilibrium in 1 L of water at 25°C.
H
2
O34H
ϩ
ϩ OH
Ϫ
The equilibrium constant for this process is
K
eq
ϭ
where brackets denote concentrations in moles per liter. Because the concentration
of H
2
O in 1 L of pure water is equal to the number of grams in a liter divided by the
gram molecular weight of H
2
O, or 1000/18, the molar concentration of H
2
O in
pure water is 55.5 M (molar). The decrease in H
2
O concentration as a result of ion
formation ([H
ϩ
], [OH
Ϫ
] ϭ 10
Ϫ7
M) is negligible in comparison; thus its influence
on the overall concentration of H
2
O can be ignored. Thus,
K
eq
ϭϭ1.8 ϫ 10
Ϫ16
M
Because the concentration of H
2
O in pure water is essentially constant, a new con-
stant, K
w
, the ion product of water, can be written as
K
w
ϭ 55.5 K
eq
ϭ 10
Ϫ14
M
2
ϭ [H
ϩ
][OH
Ϫ
]
This equation has the virtue of revealing the reciprocal relationship between H
ϩ
and OH
Ϫ
concentrations of aqueous solutions. If a solution is acidic (that is, it has
a significant [H
ϩ
]), then the ion product of water dictates that the OH
Ϫ
concen-
tration is correspondingly less. For example, if [H
ϩ
] is 10
Ϫ2
M, [OH
Ϫ
] must be
10
Ϫ12
M (K
w
ϭ 10
Ϫ14
M
2
ϭ [10
Ϫ2
][OH
Ϫ
]; [OH
Ϫ
] ϭ 10
Ϫ12
M). Similarly, in an alka-
line, or basic, solution in which [OH
Ϫ
] is great, [H
ϩ
] is low.
2.2 What Is pH?
To avoid the cumbersome use of negative exponents to express concentrations that
range over 14 orders of magnitude, Søren Sørensen, a Danish biochemist, devised
the pH scale by defining pH as the negative logarithm of the hydrogen ion concentration
1
:
pH ϭϪlog
10
[H
ϩ
]
Table 2.2 gives the pH scale. Note again the reciprocal relationship between [H
ϩ
]
and [OH
Ϫ
]. Also, because the pH scale is based on negative logarithms, low pH val-
ues represent the highest H
ϩ
concentrations (and the lowest OH
Ϫ
concentrations,
as K
w
specifies). Note also that
pK
w
ϭ pH ϩ pOH ϭ 14
(10
Ϫ7
)(10
Ϫ7
)
ᎏᎏ
55.5
[H
ϩ
][OH
Ϫ
]
ᎏᎏ
[H
2
O]
O
H
+
H
H
O
H
O
H
H
O
H
H
H
1
To be precise in physical chemical terms, the activities of the various components, not their molar con-
centrations, should be used in these equations. The activity (a) of a solute component is defined as the
product of its molar concentration, c, and an activity coefficient, ␥:aϭ [c]␥. Most biochemical work in-
volves dilute solutions, and the use of activities instead of molar concentrations is usually neglected.
However, the concentration of certain solutes may be very high in living cells.
ANIMATED FIGURE 2.10 The hydration
of H
3
O
ϩ
. See this figure animated at www
.cengage.com/login
36 Chapter 2 Water:The Medium of Life
The pH scale is widely used in biological applications because hydrogen ion con-
centrations in biological fluids are very low, about 10
Ϫ7
M or 0.0000001 M, a value
more easily represented as pH 7. The pH of blood plasma, for example, is 7.4, or
0.00000004 M H
ϩ
. Certain disease conditions may lower the plasma pH level to 6.8
or less, a situation that may result in death. At pH 6.8, the H
ϩ
concentration is
0.00000016 M, four times greater than at pH 7.4.
At pH 7, [H
ϩ
] ϭ [OH
Ϫ
]; that is, there is no excess acidity or basicity. The
point of neutrality is at pH 7, and solutions having a pH of 7 are said to be at
neutral pH. The pH values of various fluids of biological origin or relevance are
given in Table 2.3. Because the pH scale is a logarithmic scale, two solutions
whose pH values differ by 1 pH unit have a tenfold difference in [H
ϩ
]. For ex-
ample, grapefruit juice at pH 3.2 contains more than 12 times as much H
ϩ
as or-
ange juice at pH 4.3.
Strong Electrolytes Dissociate Completely in Water
Substances that are almost completely dissociated to form ions in solution are called
strong electrolytes. The term electrolyte describes substances capable of generating
ions in solution and thereby causing an increase in the electrical conductivity of the
solution. Many salts (such as NaCl and K
2
SO
4
) fit this category, as do strong acids
(such as HCl) and strong bases (such as NaOH). Recall from general chemistry that
acids are proton donors and bases are proton acceptors. In effect, the dissociation
of a strong acid such as HCl in water can be treated as a proton transfer reaction be-
tween the acid HCl and the base H
2
O to give the conjugate acid H
3
O
ϩ
and the con-
jugate base Cl
Ϫ
:
HCl ϩ H
2
O ⎯⎯→ H
3
O
ϩ
ϩ Cl
Ϫ
The equilibrium constant for this reaction is
K ϭ
Customarily, because the term [H
2
O] is essentially constant in dilute aqueous solu-
tions, it is incorporated into the equilibrium constant K to give a new term, K
a
, the
[H
3
O
ϩ
][Cl
Ϫ
]
ᎏᎏ
[H
2
O][HCl]
The hydrogen ion and hydroxyl ion concentrations are given in moles per liter at 25°C.
pH [H
ϩ
] [OH
Ϫ
]
0 (10
0
) 1.0 0.00000000000001 (10
Ϫ14
)
1 (10
Ϫ1
) 0.1 0.0000000000001 (10
Ϫ13
)
2 (10
Ϫ2
) 0.01 0.000000000001 (10
Ϫ12
)
3 (10
Ϫ3
) 0.001 0.00000000001 (10
Ϫ11
)
4 (10
Ϫ4
) 0.0001 0.0000000001 (10
Ϫ10
)
5 (10
Ϫ5
) 0.00001 0.000000001 (10
Ϫ9
)
6 (10
Ϫ6
) 0.000001 0.00000001 (10
Ϫ8
)
7 (10
Ϫ7
) 0.0000001 0.0000001 (10
؊7
)
8 (10
Ϫ8
) 0.00000001 0.000001 (10
Ϫ6
)
9 (10
Ϫ9
) 0.000000001 0.00001 (10
Ϫ5
)
10 (10
Ϫ10
) 0.0000000001 0.0001 (10
Ϫ4
)
11 (10
Ϫ11
) 0.00000000001 0.001 (10
Ϫ3
)
12 (10
Ϫ12
) 0.000000000001 0.01 (10
Ϫ2
)
13 (10
Ϫ13
) 0.0000000000001 0.1 (10
Ϫ1
)
14 (10
Ϫ14
) 0.00000000000001 1.0 (10
0
)
TABLE 2.2
pH Scale
Fluid pH
Household lye 13.6
Bleach 12.6
Household ammonia 11.4
Milk of magnesia 10.3
Baking soda 8.4
Seawater 8.0
Pancreatic fluid 7.8–8.0
Blood plasma 7.4
Intracellular fluids
Liver 6.9
Muscle 6.1
Saliva 6.6
Urine 5–8
Boric acid 5.0
Beer 4.5
Orange juice 4.3
Grapefruit juice 3.2
Vinegar 2.9
Soft drinks 2.8
Lemon juice 2.3
Gastric juice 1.2–3.0
Battery acid 0.35
TABLE 2.3
The pH of Various Common Fluids
EXAMPLE
2.2 What Is pH? 37
acid dissociation constant, where K
a
ϭ K [H
2
O]. Also, the term [H
3
O
ϩ
] is often re-
placed by H
ϩ
, such that
K
a
ϭ
For HCl, the value of K
a
is exceedingly large because the concentration of HCl in
aqueous solution is vanishingly small. Because this is so, the pH of HCl solutions is
readily calculated from the amount of HCl used to make the solution:
[H
ϩ
] in solution ϭ [HCl] added to solution
Thus, a 1 M solution of HCl has a pH of 0; a 1 mM HCl solution has a pH of 3. Sim-
ilarly, a 0.1 M NaOH solution has a pH of 13. (Because [OH
Ϫ
] ϭ 0.1 M, [H
ϩ
] must
be 10
Ϫ13
M.) Viewing the dissociation of strong electrolytes another way, we see that
the ions formed show little affinity for each other. For example, in HCl in water, Cl
Ϫ
has very little affinity for H
ϩ
:
HCl ⎯⎯→ H
ϩ
ϩ Cl
Ϫ
and in NaOH solutions, Na
ϩ
has little affinity for OH
Ϫ
. The dissociation of these
substances in water is effectively complete.
Weak Electrolytes Are Substances That Dissociate Only Slightly in Water
Substances with only a slight tendency to dissociate to form ions in solution are
called weak electrolytes. Acetic acid, CH
3
COOH, is a good example:
CH
3
COOH ϩ H
2
O34CH
3
COO
Ϫ
ϩ H
3
O
ϩ
The acid dissociation constant K
a
for acetic acid is 1.74 ϫ 10
Ϫ5
M:
K
a
ϭϭ1.74 ϫ 10
Ϫ5
M
K
a
is also termed an ionization constant because it states the extent to which a sub-
stance forms ions in water. The relatively low value of K
a
for acetic acid reveals that
the un-ionized form, CH
3
COOH, predominates over H
ϩ
and CH
3
COO
Ϫ
in aqueous
solutions of acetic acid. Viewed another way, CH
3
COO
Ϫ
, the acetate ion, has a high
affinity for H
ϩ
.
What is the pH of a 0.1 M solution of acetic acid? In other words, what
is the final pH when 0.1 mol of acetic acid (HAc) is added to water and the volume
of the solution is adjusted to equal 1 L?
Answer
The dissociation of HAc in water can be written simply as
HAc 34H
ϩ
ϩ Ac
Ϫ
where Ac
Ϫ
represents the acetate ion, CH
3
COO
Ϫ
. In solution, some amount x of
HAc dissociates, generating x amount of Ac
Ϫ
and an equal amount x of H
ϩ
. Ionic
equilibria characteristically are established very rapidly. At equilibrium, the concen-
tration of HAc ϩ Ac
Ϫ
must equal 0.1 M. So, [HAc] can be represented as (0.1 Ϫ x)
M, and [Ac
Ϫ
] and [H
ϩ
] then both equal x molar. From 1.74 ϫ 10
Ϫ5
M ϭ
([H
ϩ
][Ac
Ϫ
])/[HAc], we get 1.74 ϫ 10
Ϫ5
M ϭ x
2
/[0.1 Ϫ x]. The solution to qua-
dratic equations of this form (ax
2
ϩ bx ϩ c ϭ 0) is x ϭϪb Ϯ ͙b
2
Ϫ 4
ෆ
ac/2a. For x
2
ϩ
(1.74 ϫ 10
Ϫ5
)x Ϫ (1.74 ϫ 10
Ϫ6
) ϭ 0, x ϭ 1.319 ϫ 10
Ϫ3
M, so pH ϭ 2.88. (Note that
the calculation of x can be simplified here: Because K
a
is quite small, x ϽϽ 0.1 M.
Therefore, K
a
is essentially equal to x
2
/0.1. Thus, x
2
ϭ 1.74 ϫ 10
Ϫ6
M
2
, so x ϭ 1.32 ϫ
10
Ϫ3
M, and pH ϭ 2.88.)
[H
ϩ
][CH
3
COO
Ϫ
]
ᎏᎏ
[CH
3
COOH]
[H
ϩ
][Cl
Ϫ
]
ᎏᎏ
[HCl]
EXAMPLE
38 Chapter 2 Water:The Medium of Life
The Henderson–Hasselbalch Equation Describes the Dissociation
of a Weak Acid In the Presence of Its Conjugate Base
Consider the ionization of some weak acid, HA, occurring with an acid dissociation
constant, K
a
. Then,
HA34H
ϩ
ϩ A
Ϫ
and
K
a
ϭ
Rearranging this expression in terms of the parameter of interest, [H
ϩ
], we have
[H
ϩ
] ϭ
Taking the logarithm of both sides gives
log [H
ϩ
] ϭ log K
a
ϩ log
10
If we change the signs and define pK
a
ϭϪlog K
a
, we have
pH ϭ pK
a
Ϫ log
10
or
pH ϭ pK
a
ϩ log
10
This relationship is known as the Henderson–Hasselbalch equation. Thus, the pH
of a solution can be calculated, provided K
a
and the concentrations of the weak
acid HA and its conjugate base A
Ϫ
are known. Note particularly that when [HA] ϭ
[A
Ϫ
], pH ϭ pK
a
. For example, if equal volumes of 0.1 M HAc and 0.1 M sodium
acetate are mixed, then
pH ϭ pK
a
ϭ 4.76
pK
a
ϭϪlog K
a
ϭϪlog
10
(1.74 ϫ 10
Ϫ5
) ϭ 4.76
(Sodium acetate, the sodium salt of acetic acid, is a strong electrolyte and dissoci-
ates completely in water to yield Na
ϩ
and Ac
Ϫ
.)
The Henderson–Hasselbalch equation provides a general solution to the quan-
titative treatment of acid–base equilibria in biological systems. Table 2.4 gives the
acid dissociation constants and pK
a
values for some weak electrolytes of biochemi-
cal interest.
What is the pH when 100 mL of 0.1 N NaOH is added to 150 mL of
0.2 M HAc if pK
a
for acetic acid ϭ 4.76?
Answer
100 mL 0.1 N NaOH ϭ 0.01 mol OH
Ϫ
, which neutralizes 0.01 mol of HAc, giving
an equivalent amount of Ac
Ϫ
:
OH
Ϫ
ϩ HAc ⎯⎯→ Ac
Ϫ
ϩ H
2
O
0.02 mol of the original 0.03 mol of HAc remains essentially undissociated. The fi-
nal volume is 250 mL.
pH ϭ pK
a
ϩ log
10
ϭ 4.76 ϩ log (0.01 mol/0.02 mol)
pH ϭ 4.76 Ϫ log
10
2 ϭ 4.46
[Ac
Ϫ
]
ᎏ
[HAc]
[A
Ϫ
]
ᎏ
[HA]
[HA]
ᎏ
[A
Ϫ
]
[HA]
ᎏ
[A
Ϫ
]
[K
a
][HA]
ᎏᎏ
[A
Ϫ
]
[H
ϩ
][A
Ϫ
]
ᎏᎏ
[HA]
2.2 What Is pH? 39
If 150 mL of 0.2 M HAc had merely been diluted with 100 mL of water, this would
leave 250 mL of a 0.12 M HAc solution. The pH would be given by:
K
a
ϭϭϭ1.74 ϫ 10
Ϫ5
M
x ϭ 1.44 ϫ 10
Ϫ3
ϭ [H
ϩ
]
pH ϭ 2.84
Titration Curves Illustrate the Progressive Dissociation
of a Weak Acid
Titration is the analytical method used to determine the amount of acid in
a solution. A measured volume of the acid solution is titrated by slowly adding a
solution of base, typically NaOH, of known concentration. As incremental
amounts of NaOH are added, the pH of the solution is determined and a plot of
the pH of the solution versus the amount of OH
Ϫ
added yields a titration curve.
The titration curve for acetic acid is shown in Figure 2.11. In considering the
progress of this titration, keep in mind two important equilibria:
1. HAc 34H
ϩ
ϩ Ac
Ϫ
K
a
ϭ 1.74 ϫ 10
Ϫ5
2. H
ϩ
ϩ OH
Ϫ
34 H
2
O K ϭϭ5.55 ϫ 10
15
As the titration begins, mostly HAc is present, plus some H
ϩ
and Ac
Ϫ
in amounts that
can be calculated (see the Example on page 37). Addition of a solution of NaOH al-
lows hydroxide ions to neutralize any H
ϩ
present. Note that reaction (2) as written
is strongly favored; its apparent equilibrium constant is greater than 10
15
! As H
ϩ
is
neutralized, more HAc dissociates to H
ϩ
and Ac
Ϫ
. The stoichiometry of the titration
is 1:1—for each increment of OH
Ϫ
added, an equal amount of the weak acid HAc is
titrated. As additional NaOH is added, the pH gradually increases as Ac
Ϫ
accumu-
[H
2
O]
ᎏ
[K
w
]
x
2
ᎏ
0.12 M
[H
ϩ
][Ac
Ϫ
]
ᎏᎏ
[HAc]
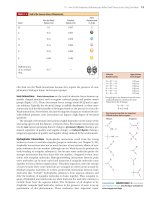
Acid K
a
(M) pK
a
HCOOH (formic acid) 1.78 ϫ 10
Ϫ4
3.75
CH
3
COOH (acetic acid) 1.74 ϫ 10
Ϫ5
4.76
CH
3
CH
2
COOH (propionic acid) 1.35 ϫ 10
Ϫ5
4.87
CH
3
CHOHCOOH (lactic acid) 1.38 ϫ 10
Ϫ4
3.86
HOOCCH
2
CH
2
COOH (succinic acid) pK
1
* 6.16 ϫ 10
Ϫ5
4.21
HOOCCH
2
CH
2
COO
Ϫ
(succinic acid) pK
2
2.34 ϫ 10
Ϫ6
5.63
H
3
PO
4
(phosphoric acid) pK
1
7.08 ϫ 10
Ϫ3
2.15
H
2
PO
4
Ϫ
(phosphoric acid) pK
2
6.31 ϫ 10
Ϫ8
7.20
HPO
4
2Ϫ
(phosphoric acid) pK
3
3.98 ϫ 10
Ϫ13
12.40
C
3
N
2
H
5
ϩ
(imidazole) 1.02 ϫ 10
Ϫ7
6.99
C
6
O
2
N
3
H
11
ϩ
(histidine–imidazole group) pK
R
†
9.12 ϫ 10
Ϫ7
6.04
H
2
CO
3
(carbonic acid) pK
1
1.70 ϫ 10
Ϫ4
3.77
HCO
3
Ϫ
(bicarbonate) pK
2
5.75 ϫ 10
Ϫ11
10.24
(HOCH
2
)
3
CNH
3
ϩ
(tris-hydroxymethyl aminomethane) 8.32 ϫ 10
Ϫ9
8.07
NH
4
ϩ
(ammonium) 5.62 ϫ 10
Ϫ10
9.25
CH
3
NH
3
ϩ
(methylammonium) 2.46 ϫ 10
Ϫ11
10.62
*The pK values listed as pK
1
,pK
2
, or pK
3
are in actuality pK
a
values for the respective dissociations.This simplification in
notation is used throughout this book.
†
pK
R
refers to the imidazole ionization of histidine.
Data from CRC Handbook of Biochemistry, The Chemical Rubber Co., 1968.
TABLE 2.4
Acid Dissociation Constants and pK
a
Values for Some Weak Electrolytes (at 25°C)
100
0.50 1.0
50
0
Equivalents of OH
–
added
Relative abundance
CH
3
COOH CH
3
COO
–
pH 4.76
Low pH High pH
9
0.5 1.0
5
1
E
q
uivalents of OH
–
added
pH
CH
3
COOH
CH
3
COO
–
pH 4.76
7
3
ANIMATED FIGURE 2.11 The titration
curve for acetic acid. Note that the titration curve is rela-
tively flat at pH values near the pK
a
. In other words, the
pH changes relatively little as OH
Ϫ
is added in this
region of the titration curve. See this figure animated
at www.cengage.com/login
40 Chapter 2 Water:The Medium of Life
lates at the expense of diminishing HAc and the neutralization of H
ϩ
. At the point
where half of the HAc has been neutralized (that is, where 0.5 equivalent of OH
Ϫ
has
been added), the concentrations of HAc and Ac
Ϫ
are equal and pH ϭ pK
a
for HAc.
Thus, we have an experimental method for determining the pK
a
values of weak elec-
trolytes. These pK
a
values lie at the midpoint of their respective titration curves. Af-
ter all of the acid has been neutralized (that is, when one equivalent of base has been
added), the pH rises exponentially.
The shapes of the titration curves of weak electrolytes are identical, as Figure
2.12 reveals. Note, however, that the midpoints of the different curves vary in a way
that characterizes the particular electrolytes. The pK
a
for acetic acid is 4.76, the pK
a
for imidazole is 6.99, and that for ammonium is 9.25. These pK
a
values are directly
related to the dissociation constants of these substances, or, viewed the other way, to
the relative affinities of the conjugate bases for protons. NH
3
has a high affinity for
protons compared to Ac
Ϫ
; NH
4
ϩ
is a poor acid compared to HAc.
Phosphoric Acid Has Three Dissociable H
ϩ
Figure 2.13 shows the titration curve for phosphoric acid, H
3
PO
4
. This substance
is a polyprotic acid, meaning it has more than one dissociable proton. Indeed, it
has three, and thus three equivalents of OH
Ϫ
are required to neutralize it, as Fig-
ure 2.13 shows. Note that the three dissociable H
ϩ
are lost in discrete steps, each
dissociation showing a characteristic pK
a
. Note that pK
1
occurs at pH ϭ 2.15, and
the concentrations of the acid H
3
PO
4
and the conjugate base H
2
PO
4
Ϫ
are equal.
As the next dissociation is approached, H
2
PO
4
Ϫ
is treated as the acid and HPO
4
2Ϫ
is its conjugate base. Their concentrations are equal at pH 7.20, so pK
2
ϭ 7.20.
(Note that at this point, 1.5 equivalents of OH
Ϫ
have been added.) As more OH
Ϫ
is added, the last dissociable hydrogen is titrated, and pK
3
occurs at pH ϭ 12.4,
where [HPO
4
2Ϫ
] ϭ [PO
4
3Ϫ
].
The shape of the titration curves for weak electrolytes has a biologically rele-
vant property: In the region of the pK
a
, pH remains relatively unaffected as in-
crements of OH
Ϫ
(or H
ϩ
) are added. The weak acid and its conjugate base are
acting as a buffer.
12
0.5
10
8
6
4
2
1.0
E
q
uivalents of OH
–
pH
CH
3
COOH
CH
3
COO
–
[CH
3
COOH] = [CH
3
COO
–
]
pK
a
= 4.76
pK
a
= 6.99
[imid.H
+
] = [imid]
[NH
4
]= [NH
3
]
pK
a
= 9.25
NH
4
+
+
NH
3
pH = pK
a
[HA]= [A
–
]
Titration midpoint
N
–
H
N
H
+
Imidazole H
+
N
HN
Imidazole
ANIMATED FIGURE 2.12 The titration curves of several weak electrolytes: acetic acid,imidazole,
and ammonium. See this figure animated at www.cengage.com/login
2.3 What Are Buffers, and What Do They Do? 41
2.3 What Are Buffers, and What Do They Do?
Buffers are solutions that tend to resist changes in their pH as acid or base is added.
Typically, a buffer system is composed of a weak acid and its conjugate base. A solution
of a weak acid that has a pH nearly equal to its pK
a
, by definition, contains an amount
of the conjugate base nearly equivalent to the weak acid. Note that in this region, the
titration curve is relatively flat (Figure 2.14). Addition of H
ϩ
then has little effect be-
cause it is absorbed by the following reaction:
H
ϩ
ϩ A
Ϫ
⎯⎯→HA
Similarly, any increase in [OH
Ϫ
] is offset by the process
OH
Ϫ
ϩ HA⎯⎯→A
Ϫ
ϩ H
2
O
Thus, the pH remains relatively constant. The components of a buffer system are
chosen such that the pK
a
of the weak acid is close to the pH of interest. It is at the
pK
a
that the buffer system shows its greatest buffering capacity. At pH values more
than 1 pH unit from the pK
a
, buffer systems become ineffective because the con-
centration of one of the components is too low to absorb the influx of H
ϩ
or OH
Ϫ
.
The molarity of a buffer is defined as the sum of the concentrations of the acid and
conjugate base forms.
Maintenance of pH is vital to all cells. Cellular processes such as metabolism are
dependent on the activities of enzymes; in turn, enzyme activity is markedly influ-
enced by pH, as the graphs in Figure 2.15 show. Consequently, changes in pH would
be disruptive to metabolism for reasons that become apparent in later chapters. Or-
ganisms have a variety of mechanisms to keep the pH of their intracellular and ex-
tracellular fluids essentially constant, but the primary protection against harmful pH
changes is provided by buffer systems. The buffer systems selected reflect both the
need for a pK
a
value near pH 7 and the compatibility of the buffer components with
the metabolic machinery of cells. Two buffer systems act to maintain intracellular pH
essentially constant—the phosphate (HPO
4
2Ϫ
/H
2
PO
4
Ϫ
) system and the histidine sys-
tem. The pH of the extracellular fluid that bathes the cells and tissues of animals is
maintained by the bicarbonate/carbonic acid (HCO
3
Ϫ
/H
2
CO
3
) system.
The Phosphate Buffer System Is a Major Intracellular Buffering System
The phosphate system serves to buffer the intracellular fluid of cells at physiological
pH because pK
2
lies near this pH value. The intracellular pH of most cells is main-
tained in the range between 6.9 and 7.4. Phosphate is an abundant anion in cells, both
in inorganic form and as an important functional group on organic molecules that
PO
4
3
–
14
0.5
E
q
uivalents OH
–
added
12
10
8
6
4
2
1.0 1.5 2.0 2.5 3.0
pH
H
3
PO
4
pK
1
= 2.15
[H
3
PO
4
] =
[H
2
PO
4
–
]
H
2
PO
4
–
[HPO
4
2
–
] =
[H
2
PO
4
–
]
HPO
4
2
–
pK
2
= 7.2
pK
3
= 12.4
[HPO
4
2
–
] =
[PO
4
3
–
]
ANIMATED FIGURE 2.13 The titration
curve for phosphoric acid. See this figure animated at
www.cengage.com/login
H
+
10
0.5
Equivalents of OH
–
added
8
6
4
2
1.0
pH
HA
A
–
=[A
–
][HA]
=pK
a
pH
Buffer action:
OH
–
HA
H
2
O
A
–
ANIMATED FIGURE 2.14 A buffer
system consists of a weak acid, HA, and its conjugate
base, A
Ϫ
. See this figure animated at www.cengage
.com/login
42 Chapter 2 Water:The Medium of Life
serve as metabolites or macromolecular precursors. In both organic and inorganic
forms, its characteristic pK
2
means that the ionic species present at physiological pH
are sufficient to donate or accept hydrogen ions to buffer any changes in pH, as the
titration curve for H
3
PO
4
in Figure 2.13 reveals. For example, if the total cellular con-
centration of phosphate is 20 mM (millimolar) and the pH is 7.4, the distribution of
the major phosphate species is given by
pH ϭ pK
2
ϩ log
10
7.4 ϭ 7.20 ϩ log
10
ϭ 1.58
Thus, if [HPO
4
2Ϫ
] ϩ [H
2
PO
4
Ϫ
] ϭ 20 mM, then
[HPO
4
2Ϫ
] ϭ 12.25 mM and [H
2
PO
4
Ϫ
] ϭ 7.75 mM
Dissociation of the Histidine–Imidazole Group Also Serves
as an Intracellular Buffering System
Histidine is one of the 20 naturally occurring amino acids commonly found in pro-
teins (see Chapter 4). It possesses as part of its structure an imidazole group, a five-
membered heterocyclic ring possessing two nitrogen atoms. The pK
a
for dissocia-
tion of the imidazole hydrogen of histidine is 6.04.
In cells, histidine occurs as the free amino acid, as a constituent of proteins, and
as part of dipeptides in combination with other amino acids. Because the con-
centration of free histidine is low and its imidazole pK
a
is more than 1 pH unit re-
moved from prevailing intracellular pH, its role in intracellular buffering is mi-
nor. However, protein-bound and dipeptide histidine may be the dominant
buffering system in some cells. In combination with other amino acids, as in pro-
teins or dipeptides, the imidazole pK
a
may increase substantially. For example,
the imidazole pK
a
is 7.04 in anserine, a dipeptide containing -alanine and histi-
dine (Figure 2.16). Thus, this pK
a
is near physiological pH, and some histidine
peptides are well suited for buffering at physiological pH.
“Good” Buffers Are Buffers Useful Within Physiological pH Ranges
Not many common substances have pK
a
values in the range from 6 to 8. Conse-
quently, biochemists conducting in vitro experiments were limited in their choice
of buffers effective at or near physiological pH. In 1966, N. E. Good devised a set of
CH
2
pK
a
= 6.04
H
+
ϩ H
3
+
NC
H
COO
–
HN N
CH
2
H
3
+
NC
H
COO
–
HN N
+
H
[HPO
4
2Ϫ
]
ᎏᎏ
[H
2
PO
4
Ϫ
]
[HPO
4
2Ϫ
]
ᎏᎏ
[H
2
PO
4
Ϫ
]
[HPO
4
2Ϫ
]
ᎏᎏ
[H
2
PO
4
Ϫ
]
(a)
(b)
(c)
0
pH
Enzyme activity
123456
Pepsin
5
pH
Enzyme activity
678
Fumarase
23
pH
Enzyme activity
78645 9
Lysozyme
FIGURE 2.15 pH versus enzymatic activity. Pepsin is a
protein-digesting enzyme active in the gastric fluid.
Fumarase is a metabolic enzyme found in mitochon-
dria. Lysozyme digests the cell walls of bacteria; it is
found in tears.
H
3
NCH
2
CH
2
H
+
C
O
NCH
2
CH
C
OO
–
N
H
3
C
N
+
H
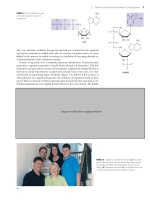
FIGURE 2.16 Anserine (N--alanyl-3-methyl-L-histidine) is an important dipeptide buffer in the maintenance of
intracellular pH in some tissues.The structure shown is the predominant ionic species at pH 7. pK
1
(COOH) ϭ 2.64;
pK
2
(imidazole-N
ϩ
H) ϭ 7.04; pK
3
(N
ϩ
H
3
) ϭ 9.49.