Biochemistry, 4th Edition P10 potx
Bạn đang xem bản rút gọn của tài liệu. Xem và tải ngay bản đầy đủ của tài liệu tại đây (400.53 KB, 10 trang )
EXAMPLE
3.1 What Are the Basic Concepts of Thermodynamics? 53
Free Energy Provides a Simple Criterion for Equilibrium
An important question for chemists, and particularly for biochemists, is, “Will the
reaction proceed in the direction written?” J. Willard Gibbs, one of the founders of
thermodynamics, realized that the answer to this question lay in a comparison of
the enthalpy change and the entropy change for a reaction at a given temperature.
The Gibbs free energy, G, is defined as
G ϭ H Ϫ TS
(3.10)
For any process A
34
B at constant pressure and temperature, the free energy change
is given by
⌬G ϭ ⌬H Ϫ T⌬S
(3.11)
If ⌬G is equal to 0, the process is at equilibrium and there is no net flow either in the
forward or reverse direction. When ⌬G ϭ 0, ⌬S ϭ ⌬H/T and the enthalpic and en-
tropic changes are exactly balanced. Any process with a nonzero ⌬G proceeds spon-
taneously to a final state of lower free energy. If ⌬G is negative, the process proceeds
spontaneously in the direction written. If ⌬G is positive, the reaction or process pro-
ceeds spontaneously in the reverse direction. (The sign and value of ⌬G do not al-
low us to determine how fast the process will go.) If the process has a negative ⌬G, it
is said to be exergonic, whereas processes with positive ⌬G values are endergonic.
The Standard-State Free Energy Change The free energy change, ⌬G, for any re-
action depends upon the nature of the reactants and products, but it is also affected
by the conditions of the reaction, including temperature, pressure, pH, and the
concentrations of the reactants and products. As explained earlier, it is useful to de-
fine a standard state for such processes. If the free energy change for a reaction is
sensitive to solution conditions, what is the particular significance of the standard-
state free energy change? To answer this question, consider a reaction between two
reactants A and B to produce the products C and D.
A ϩ B
34
C ϩ D
(3.12)
The free energy change for non–standard-state concentrations is given by
⌬G ϭ ⌬G° ϩ RT ln
(3.13)
At equilibrium, ⌬G ϭ 0 and [C][D]/[A][B] ϭ K
eq
. We then have
⌬G° ϭϪRT ln K
eq
(3.14)
or, in base 10 logarithms,
⌬G° ϭϪ2.3RT log
10
K
eq
(3.15)
This can be rearranged to
K
eq
ϭ 10
Ϫ⌬G °/2.3RT
(3.16)
In any of these forms, this relationship allows the standard-state free energy change
for any process to be determined if the equilibrium constant is known. More im-
portant, it states that the point of equilibrium for a reaction in solution is a function of the
standard-state free energy change for the process. That is, ⌬G° is another way of writing an
equilibrium constant.
The equilibrium constants determined by Brandts at several temper-
atures for the denaturation of chymotrypsinogen (see previous example) can be
used to calculate the free energy changes for the denaturation process. For exam-
ple, the equilibrium constant at 54.5°C is 0.27, so
⌬G° ϭϪ(8.314 J/mol и K)(327.5 K) ln (0.27)
⌬G° ϭϪ(2.72 kJ/mol) ln (0.27)
⌬G° ϭ 3.56 kJ/mol
[C][D]
ᎏ
[A][B]
54 Chapter 3 Thermodynamics of Biological Systems
The positive sign of ⌬G° means that the unfolding process is unfavorable; that is,
the stable form of the protein at 54.5°C is the folded form. On the other hand, the
relatively small magnitude of ⌬G° means that the folded form is only slightly fa-
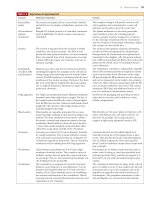
vored. Figure 3.3 shows the dependence of ⌬G° on temperature for the denatura-
tion data at pH 3 (from the data given in the example on page 50).
Having calculated both ⌬H° and ⌬G° for the denaturation of chymotrypsinogen,
we can also calculate ⌬S°, using Equation 3.11:
⌬S° ϭϪ
(3.17)
At 54.5°C (327.5 K),
⌬S° ϭϪ(3560 Ϫ 533,000 J/mol)/327.5 K
⌬S° ϭ 1620 J/mol и K
Figure 3.4 presents the dependence of ⌬S° on temperature for chymotrypsinogen
denaturation at pH 3. A positive ⌬S° indicates that the protein solution has become
more disordered as the protein unfolds. Comparison of the value of 1.62 kJ/mol и K
with the values of ⌬S° in Table 3.1 shows that the present value (for chymotrypsino-
gen at 54.5°C) is quite large. The physical significance of the thermodynamic param-
eters for the unfolding of chymotrypsinogen becomes clear later in this chapter.
3.2 What Is the Effect of Concentration on Net
Free Energy Changes?
Equation 3.13 shows that the free energy change for a reaction can be very differ-
ent from the standard-state value if the concentrations of reactants and products
differ significantly from unit activity (1 M for solutions). The effects can often be
dramatic. Consider the hydrolysis of phosphocreatine:
Phosphocreatine ϩ H
2
O ⎯⎯→creatine ϩ P
i
(3.18)
This reaction is strongly exergonic, and ⌬G° at 37°C is Ϫ42.8 kJ/mol. Physiological
concentrations of phosphocreatine, creatine, and inorganic phosphate are nor-
mally between 1 and 10 mM. Assuming 1 mM concentrations and using Equation
3.13, the ⌬G for the hydrolysis of phosphocreatine is
⌬G ϭϪ42.8 kJ/mol ϩ (8.314 J/mol и K)(310 K) ln
(3.19)
⌬G ϭϪ60.5 kJ/mol (3.20)
At 37°C, the difference between standard-state and 1 mM concentrations for such a
reaction is thus approximately Ϫ17.7 kJ/mol.
3.3 What Is the Effect of pH on Standard-State
Free Energies?
For biochemical reactions in which hydrogen ions (H
ϩ
) are consumed or pro-
duced, the usual definition of the standard state is awkward. Standard state for the
H
ϩ
ion is 1 M, which corresponds to pH 0. At this pH, nearly all enzymes would be
denatured and biological reactions could not occur. It makes more sense to use free
energies and equilibrium constants determined at pH 7. Biochemists have thus
adopted a modified standard state, designated with prime (Ј) symbols, as in ⌬G°Ј,
K
eq
Ј, ⌬H°Ј, and so on. For values determined in this way, a standard state of 10
Ϫ7
M
H
ϩ
and unit activity (1 M for solutions, 1 atm for gases and pure solids defined as
unit activity) for all other components (in the ionic forms that exist at pH 7) is as-
[0.001][0.001]
ᎏᎏ
[0.001]
(⌬G Ϫ ⌬H°)
ᎏᎏ
T
10
⌬G° (kJ/mol)
50 52
Tem
p
erature (°C)
8
6
4
2
0
–2
–4
–6
–8
–10
54 56 58 60 62
FIGURE 3.3 The dependence of ⌬G° on temperature for
the denaturation of chymotrypsinogen. (Adapted from
Brandts, J.F., 1964. The thermodynamics of protein denaturation.
I.The denaturation of chymotrypsinogen. Journal of the Ameri-
can Chemical Society 86:4291–4301.)
2.4
52
Temperature (°C)
2.3
2.2
2.1
2.0
1.9
1.8
1.7
1.6
1.5
1.4
⌬S° (kJ/mol • K)
54 56 58 60
FIGURE 3.4 The dependence of ⌬S° on temperature for
the denaturation of chymotrypsinogen. (Adapted from
Brandts, J.F., 1964. The thermodynamics of protein denaturation.
I.The denaturation of chymotrypsinogen. Journal of the Ameri-
can Chemical Society 86:4291–4301.)
Go to CengageNOW at www
.cengage.com/login and click BiochemistryInteractive
to see the relationships between free energies and
the following: changes to temperature, equilibrium
constants, and concentrations of reactants and
products.
3.4 What Can Thermodynamic Parameters Tell Us About Biochemical Events? 55
sumed. The two standard states can be related easily. For a reaction in which H
ϩ
is
produced,
A⎯⎯→B
Ϫ
ϩ H
ϩ
(3.21)
the relation of the equilibrium constants for the two standard states is
K
eq
ϭ K
eq
Ј [H
ϩ
] (3.22)
and ⌬G°Ј is given by
⌬G°Јϭ⌬G° ϩ RT ln [H
ϩ
] (3.23)
For a reaction in which H
ϩ
is consumed,
A
Ϫ
ϩ H
ϩ
⎯⎯→B (3.24)
the equilibrium constants are related by
K
eq
ϭ (3.25)
and ⌬G°Ј is given by
⌬G°Јϭ⌬G° ϩ RT ln
ϭ ⌬G° Ϫ RT ln [H
ϩ
] (3.26)
3.4 What Can Thermodynamic Parameters Tell Us
About Biochemical Events?
The best answer to this question is that a single parameter (⌬H or ⌬S, for example)
is not very meaningful. A positive ⌬H° for the unfolding of a protein might reflect
either the breaking of hydrogen bonds within the protein or the exposure of hy-
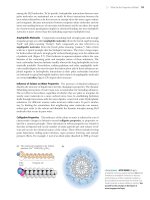
drophobic groups to water (Figure 3.5). However, comparison of several thermodynamic
parameters can provide meaningful insights about a process. For example, the transfer of
Na
ϩ
and Cl
Ϫ
ions from the gas phase to aqueous solution involves a very large neg-
ative ⌬H° (thus a very favorable stabilization of the ions) and a comparatively small
⌬S° (Table 3.2). The negative entropy term reflects the ordering of water molecules
in the hydration shells of the Na
ϩ
and Cl
Ϫ
ions. The unfavorable ϪT⌬S contribu-
tion is more than offset by the large heat of hydration, which makes the hydration
of ions a very favorable process overall. The negative entropy change for the disso-
ciation of acetic acid in water also reflects the ordering of water molecules in the
ion hydration shells. In this case, however, the enthalpy change is much smaller in
magnitude. As a result, ⌬G° for dissociation of acetic acid in water is positive, and
acetic acid is thus a weak (largely undissociated) acid.
1
ᎏ
[H
ϩ
]
K
eq
Ј
ᎏ
[H
ϩ
]
Folded
Unfolded
ANIMATED FIGURE 3.5 Unfolding of a
soluble protein exposes significant numbers of nonpo-
lar groups to water, forcing order on the solvent and
resulting in a negative ⌬S° for the unfolding process.
Orange spheres represent nonpolar groups; blue
spheres are polar and/or charged groups. See this
figure animated at www.cengage.com/login
56 Chapter 3 Thermodynamics of Biological Systems
The transfer of a nonpolar hydrocarbon molecule from its pure liquid to water
is an appropriate model for the exposure of protein hydrophobic groups to solvent
when a protein unfolds. The transfer of toluene from liquid toluene to water in-
volves a negative ⌬S°, a positive ⌬G°, and a ⌬H° that is small compared to ⌬G°(a
pattern similar to that observed for the dissociation of acetic acid). What distin-
guishes these two very different processes is the change in heat capacity (Table 3.2). A posi-
tive heat capacity change for a process indicates that the molecules have acquired
new ways to move (and thus to store heat energy). A negative ⌬C
P
means that the
process has resulted in less freedom of motion for the molecules involved. ⌬C
P
is
negative for the dissociation of acetic acid and positive for the transfer of toluene
to water. The explanation is that polar and nonpolar molecules both induce organi-
zation of nearby water molecules, but in different ways. The water molecules near a
nonpolar solute are organized but labile. Hydrogen bonds formed by water molecules
near nonpolar solutes rearrange more rapidly than the hydrogen bonds of pure wa-
ter. On the other hand, the hydrogen bonds formed between water molecules near
an ion are less labile (rearrange more slowly) than they would be in pure water. This
means that ⌬C
P
should be negative for the dissociation of ions in solution, as ob-
served for acetic acid (Table 3.2).
3.5 What Are the Characteristics of High-Energy
Biomolecules?
Virtually all life on earth depends on energy from the sun. Among life forms, there
is a hierarchy of energetics: Certain organisms capture solar energy directly,
whereas others derive their energy from this group in subsequent processes. Or-
ganisms that absorb light energy directly are called phototrophic organisms. These
organisms store solar energy in the form of various organic molecules. Organisms
that feed on these latter molecules, releasing the stored energy in a series of oxida-
tive reactions, are called chemotrophic organisms. Despite these differences, both
types of organisms share common mechanisms for generating a useful form of
chemical energy. Once captured in chemical form, energy can be released in con-
trolled exergonic reactions to drive a variety of life processes (which require en-
ergy). A small family of universal biomolecules mediates the flow of energy from ex-
ergonic reactions to the energy-requiring processes of life. These molecules are the
reduced coenzymes and the high-energy phosphate compounds. Phosphate compounds are
considered high energy if they exhibit large negative free energies of hydrolysis
(that is, if ⌬G°Ј is more negative than Ϫ25 kJ/mol).
Table 3.3 lists the most important members of the high-energy phosphate com-
pounds. Such molecules include phosphoric anhydrides
(ATP, ADP), an enol phosphate
(PEP), acyl phosphates (such as acetyl phosphate), and guanidino phosphates (such as
creatine phosphate). Also included are thioesters, such as acetyl-CoA, which do not
contain phosphorus, but which have a large negative free energy of hydrolysis. As
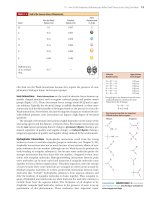
⌬H° ⌬S° ⌬G° ⌬C
P
Process kJ/mol kJ/mol и K kJ/mol kJ/mol и K
Hydration of ions
†
Na
ϩ
(g) ϩ Cl
Ϫ
(g)⎯⎯→Na
ϩ
(aq) ϩ Cl
Ϫ
(aq) Ϫ760.0 Ϫ0.185 Ϫ705.0
Dissociation of ions in solution
‡
H
2
O ϩ CH
3
COOH⎯⎯→H
3
O
ϩ
ϩ CH
3
COO
Ϫ
Ϫ10.3 Ϫ0.126 27.26 Ϫ0.143
Transfer of hydrocarbon from pure liquid to water
‡
Toluene (in pure toluene)⎯⎯→ toluene (aqueous) 1.72 Ϫ0.071 22.7 0.265
*All data collected for 25°C.
†
Berry, R. S., Rice, S. A., and Ross, J., 1980.Physical Chemistry. New York: John Wiley.
‡
Tanford, C., 1980. The Hydrophobic Effect. New York: John Wiley.
TABLE 3.2
Thermodynamic Parameters for Several Simple Processes*
3.5 What Are the Characteristics of High-Energy Biomolecules? 57
noted earlier, the exact amount of chemical free energy available from the hydrol-
ysis of such compounds depends on concentration, pH, temperature, and so on,
but the ⌬G°Ј values for hydrolysis of these substances are substantially more nega-
tive than those for most other metabolic species. Two important points: First, high-
energy phosphate compounds are not long-term energy storage substances. They
are transient forms of stored energy, meant to carry energy from point to point,
from one enzyme system to another, in the minute-to-minute existence of the cell.
(As we shall see in subsequent chapters, other molecules bear the responsibility for
long-term storage of energy supplies.) Second, the term high-energy compound should
not be construed to imply that these molecules are unstable and hydrolyze or de-
compose unpredictably. ATP, for example, is quite a stable molecule. A substantial
activation energy must be delivered to ATP to hydrolyze the terminal, or ␥, phosphate
group. In fact, as shown in Figure 3.6, the activation energy that must be absorbed
by the molecule to break the OOP
␥
bond is normally 200 to 400 kJ/mol, which is
substantially larger than the net 30.5 kJ/mol released in the hydrolysis reaction. Bio-
chemists are much more concerned with the net release of 30.5 kJ/mol than with the
activation energy for the reaction (because suitable enzymes cope with the latter).
The net release of large quantities of free energy distinguishes the high-energy
phosphoric anhydrides from their “low-energy” ester cousins, such as glycerol-3-
phosphate (Table 3.3). The next section provides a quantitative framework for un-
derstanding these comparisons.
ATP Is an Intermediate Energy-Shuttle Molecule
One last point about Table 3.3 deserves mention. Given the central importance of
ATP as a high-energy phosphate in biology, students are sometimes surprised to find
that ATP holds an intermediate place in the rank of high-energy phosphates. PEP,
1,3-BPG, creatine phosphate, acetyl phosphate, and pyrophosphate all exhibit
higher values of ⌬G°Ј. This is not a biological anomaly. ATP is uniquely situated be-
tween the very-high-energy phosphates synthesized in the breakdown of fuel mole-
cules and the numerous lower-energy acceptor molecules that are phosphorylated
Compound and Hydrolysis Reaction ⌬G°Ј (kJ/mol) Structure
Phosphoenolpyruvate⎯⎯→pyruvate ϩ P
i
Ϫ62.2 Figure 3.13
1,3-Bisphosphoglycerate⎯⎯→3-phosphoglycerate ϩ P
i
Ϫ49.6 Figure 3.12
Creatine phosphate⎯⎯→creatine ϩ P
i
Ϫ43.3 Figure 13.21
Acetyl phosphate⎯⎯→acetate ϩ P
i
Ϫ43.3 Figure 3.12
Adenosine-5Ј-triphosphate⎯⎯→ADP ϩ P
i
Ϫ35.7
†
Figure 3.9
Adenosine-5Ј-triphosphate⎯⎯→ADP ϩ P
i
Ϫ30.5 Figure 3.9
(with excess Mg
2ϩ
)
Adenosine-5Ј-diphosphate⎯⎯→AMP ϩ P
i
Ϫ35.7 Figure 3.11
Pyrophosphate⎯⎯→P
i
ϩ P
i
(in 5 mM Mg
2ϩ
) Ϫ33.6 Figure 3.10
Adenosine-5Ј-triphosphate⎯⎯→AMP ϩ PP
i
(excess Mg
2ϩ
) Ϫ32.3 Figure 10.11
Uridine diphosphoglucose⎯⎯→UDP ϩ glucose Ϫ31.9 Figure 22.10
Acetyl-coenzyme A⎯⎯→acetate ϩ CoA Ϫ31.5 page 570
S-adenosylmethionine⎯⎯→methionine ϩ adenosine Ϫ25.6
‡
Figure 25.28
Glucose-1-phosphate⎯⎯→glucose ϩ P
i
Ϫ21.0 Figure 7.13
Sn-Glycerol-3-phosphate⎯⎯→glycerol ϩ P
i
Ϫ9.2 Figure 8.5
Adenosine-5Ј-monophosphate⎯⎯→adenosine ϩ P
i
Ϫ9.2 Figure 10.11
*Adapted primarily from Handbook of Biochemistry and Molecular Biology, 1976,3rd ed. In Physical and Chemical Data,
G. Fasman, ed., Vol. 1, pp. 296–304. Boca Raton, FL: CRC Press.
†
From Gwynn, R. W., and Veech, R. L., 1973. The equilibrium constants of the adenosine triphosphate hydrolysis and the
adenosine triphosphate-citrate lyase reactions. Journal of Biological Chemistry 248:6966–6972.
‡
From Mudd, H., and Mann, J., 1963. Activation of methionine for transmethylation. Journal of Biological Chemistry
238:2164–2170.
TABLE 3.3
Free Energies of Hydrolysis of Some High-Energy Compounds*
58 Chapter 3 Thermodynamics of Biological Systems
in the course of further metabolic reactions. ADP can accept both phosphates and
energy from the higher-energy phosphates, and the ATP thus formed can donate
both phosphates and energy to the lower-energy molecules of metabolism. The
ATP/ADP pair is an intermediately placed acceptor/donor system among high-
energy phosphates. In this context, ATP functions as a very versatile but intermedi-
ate energy-shuttle device that interacts with many different energy-coupling en-
zymes of metabolism.
Group Transfer Potentials Quantify the Reactivity
of Functional Groups
Many reactions in biochemistry involve the transfer of a functional group from a
donor molecule to a specific receptor molecule or to water. The concept of group
transfer potential explains the tendency for such reactions to occur. Biochemists de-
fine the group transfer potential as the free energy change that occurs upon hy-
drolysis, that is, upon transfer of the particular group to water. This concept and its
terminology are preferable to the more qualitative notion of high-energy bonds.
The concept of group transfer potential is not particularly novel. Other kinds of
transfer (of hydrogen ions and electrons, for example) are commonly characterized
in terms of appropriate measures of transfer potential (pK
a
and reduction poten-
tial, Ᏹ
o
, respectively). As shown in Table 3.4, the notion of group transfer is fully
analogous to those of ionization potential and reduction potential. The similarity is
anything but coincidental, because all of these are really specific instances of free
energy changes. If we write
AH ⎯⎯→ A
Ϫ
ϩ H
ϩ
(3.27a)
we really don’t mean that a proton has literally been removed from the acid AH. In
the gas phase at least, this would require the input of approximately 1200 kJ/mol!
What we really mean is that the proton has been transferred to a suitable acceptor
molecule, usually water:
AH ϩ H
2
O ⎯⎯→ A
Ϫ
ϩ H
3
O
ϩ
(3.27b)
The appropriate free energy relationship is of course
pK
a
ϭ (3.28)
⌬G
ᎏᎏ
2.303 RT
Activation energy
ഡ 200–400
kJ
mol
Reactants
Products
Transition state
Phosphoryl group
transfer potential
ഡ
–
30.5 kJ/mol
ADP
+ Pi
ATP
FIGURE 3.6 The activation energies for phosphoryl
group transfer reactions (200 to 400 kJ/mol) are sub-
stantially larger than the free energy of hydrolysis of ATP
(Ϫ30.5 kJ/mol).
3.5 What Are the Characteristics of High-Energy Biomolecules? 59
Similarly, in the case of an oxidation-reduction reaction
A ⎯⎯→ A
ϩ
ϩ e
Ϫ
(3.29a)
we don’t really mean that A oxidizes independently. What we really mean (and what
is much more likely in biochemical systems) is that the electron is transferred to a
suitable acceptor:
A ϩ H
ϩ
⎯⎯→ A
ϩ
ϩ
ᎏ
1
2
ᎏ
H
2
(3.29b)
and the relevant free energy relationship is
⌬Ᏹ
o
ϭ (3.30)
where n is the number of equivalents of electrons transferred and Ᏺ is Faraday’s
constant.
Similarly, the release of free energy that occurs upon the hydrolysis of ATP and
other “high-energy phosphates” can be treated quantitatively in terms of group trans-
fer. It is common to write for the hydrolysis of ATP
ATP ϩ H
2
O ⎯⎯→ ADP ϩ P
i
(3.31)
The free energy change, which we henceforth call the group transfer potential, is
given by
⌬G° ϭϪRT ln K
eq
(3.32)
where K
eq
is the equilibrium constant for the group transfer, which is normally
written as
K
eq
ϭ (3.33)
Even this set of equations represents an approximation, because ATP, ADP, and P
i
all exist in solutions as a mixture of ionic species. This problem is discussed in a
later section. For now, it is enough to note that the free energy changes listed in
Table 3.3 are the group transfer potentials observed for transfers to water.
The Hydrolysis of Phosphoric Acid Anhydrides Is Highly Favorable
ATP contains two pyrophosphoryl or phosphoric acid anhydride linkages, as shown in
Figure 3.7. Other common biomolecules possessing phosphoric acid anhydride
linkages include ADP, GTP, GDP and the other nucleoside diphosphates and
triphosphates, sugar nucleotides such as UDP–glucose, and inorganic pyrophos-
phate itself. All exhibit large negative free energies of hydrolysis, as shown in
Table 3.3. The chemical reasons for the large negative ⌬G°Ј values for the hydrol-
ysis reactions include destabilization of the reactant due to bond strain caused by
electrostatic repulsion, stabilization of the products by ionization and resonance,
and entropy factors due to hydrolysis and subsequent ionization.
[ADP][P
i
]
ᎏᎏ
[ATP][H
2
O]
Ϫ⌬G°
ᎏ
nᏲ
Proton Transfer Potential Standard Reduction Potential Group Transfer Potential
(Acidity) (Electron Transfer Potential) (High-Energy Bond)
Simple equation AH
34
A
Ϫ
ϩ H
ϩ
A
34
A
ϩ
ϩ e
Ϫ
A ϳ P
34
A ϩ P
i
Equation including acceptor AH ϩ H
2
O
34
A ϩ H
ϩ
34
A ϳ PO
4
2Ϫ
ϩ H
2
O
34
A
Ϫ
ϩ H
3
O
ϩ
A
ϩ
ϩ
ᎏ
1
2
ᎏ
H
2
AOH ϩ HPO
4
2Ϫ
Measure of transfer potential pK
a
ϭ ⌬Ᏹ
o
ϭ ln K
eq
ϭ
Free energy change of transfer ⌬G° per mole of ⌬G° per mole of ⌬G° per mole of phosphate
is given by: H
ϩ
transferred e
Ϫ
transferred transferred
Ϫ⌬G°
ᎏ
RT
Ϫ⌬G°
ᎏ
nᏲ
⌬G°
ᎏᎏ
2.303 RT
Adapted from: Klotz, I. M., 1986. Introduction to Biomolecular Energetics. New York: Academic Press.
TABLE 3.4
Types of Transfer Potential
60 Chapter 3 Thermodynamics of Biological Systems
Destabilization Due to Electrostatic Repulsion Electrostatic repulsion in the
reactants is best understood by comparing these phosphoric anhydrides with
other reactive anhydrides, such as acetic anhydride. As shown in Figure 3.8a, the
electronegative carbonyl oxygen atoms withdraw electrons from the CPO bonds,
producing partial negative charges on the oxygens and partial positive charges on
the carbonyl carbons. Each of these electrophilic carbonyl carbons is further
destabilized by the other acetyl group, which is also electron-withdrawing in na-
ture. As a result, acetic anhydride is unstable with respect to the products of
hydrolysis.
The situation with phosphoric anhydrides is similar. The phosphorus atoms of
the pyrophosphate anion are electron-withdrawing and destabilize PP
i
with respect
to its hydrolysis products. Furthermore, the reverse reaction, reformation of the an-
hydride bond from the two anionic products, requires that the electrostatic repul-
sion between these anions be overcome (see following).
Stabilization of Hydrolysis Products by Ionization and Resonance The pyro-
phosphoryl moiety possesses two negative charges at pH values above 7.5 or so
(Figure 3.8a). The hydrolysis products, two phosphate esters, each carry about two
negative charges at pH values above 7.2. The increased ionization of the hydrolysis
products helps stabilize the electrophilic phosphorus nuclei.
Resonance stabilization in the products is best illustrated by the reactant anhy-
drides (Figure 3.8b). The unpaired electrons of the bridging oxygen atom in acetic
anhydride (and phosphoric anhydride) cannot participate in resonance structures
with both electrophilic centers at once. This competing resonance situation is re-
lieved in the product acetate or phosphate molecules.
Entropy Factors Arising from Hydrolysis and Ionization For the phosphoric
anhydrides, and for most of the high-energy compounds discussed here, there is
an additional “entropic” contribution to the free energy of hydrolysis. Most of the
hydrolysis reactions of Table 3.3 result in an increase in the number of molecules
in solution. As shown in Figure 3.9, the hydrolysis of ATP (at pH values above 7)
creates three species—ADP, inorganic phosphate (P
i
), and a hydrogen ion—from
only two reactants (ATP and H
2
O). The entropy of the solution increases because
the more particles, the more disordered the system.
3
(This effect is ionization-
dependent because, at low pH, the hydrogen ion created in many of these reac-
tions simply protonates one of the phosphate oxygens, and one fewer “particle” re-
sults from the hydrolysis.)
OH
NH
2
P
O
O
–
P
O
O
–
P
O
O
–
OCH
2
OH
O
N
N
N
N
Phosphoric anhydride
linkages
–
O
ATP
(adenosine-5'-tri
p
hos
p
hate)
OO
ACTIVE FIGURE 3.7 The triphosphate
chain of ATP contains two pyrophosphate linkages, both
of which release large amounts of energy upon hydroly-
sis. Test yourself on the concepts in this figure at
www.cengage.com/login
3
Imagine the “disorder” created by hitting a crystal with a hammer and breaking it into many small
pieces.
3.5 What Are the Characteristics of High-Energy Biomolecules? 61
The Hydrolysis ⌬G°Ј of ATP and ADP Is Greater Than That of AMP
The concepts of destabilization of reactants and stabilization of products described
for pyrophosphate also apply for ATP and other phosphoric anhydrides (Figure
3.9). ATP and ADP are destabilized relative to the hydrolysis products by electro-
static repulsion, competing resonance, and entropy. AMP, on the other hand, is a
phosphate ester (not an anhydride) possessing only a single phosphoryl group and
is not markedly different from the product inorganic phosphate in terms of elec-
trostatic repulsion and resonance stabilization. Thus, the ⌬G°Ј for hydrolysis of
AMP is much smaller than the corresponding values for ATP and ADP.
Acetyl Phosphate and 1,3-Bisphosphoglycerate Are
Phosphoric-Carboxylic Anhydrides
The mixed anhydrides of phosphoric and carboxylic acids, frequently called acyl
phosphates, are also energy-rich. Two biologically important acyl phosphates are
acetyl phosphate and 1,3-bisphosphoglycerate. Hydrolysis of these species yields
acetate and 3-phosphoglycerate, respectively, in addition to inorganic phosphate
(Figure 3.10). Once again, the large ⌬G°Ј values indicate that the reactants are
destabilized relative to products. This arises from bond strain, which can be
traced to the partial positive charges on the carbonyl carbon and phosphorus
atoms of these structures. The energy stored in the mixed anhydride bond
(which is required to overcome the charge–charge repulsion) is released upon
hydrolysis. Increased resonance possibilities in the products relative to the reac-
C
C
O
O
2 CH
3
CO
–
O
H
2
O
H
2
O
CH
3
2 H
+
Acetic anhydride:
Phosphoric anhydrides:
+
H
2
O
(a)
␦
–
␦
–
␦
+
␦
+
(b)
Competing resonance in acetic anhydride:
O
These can only occur alternately
Simultaneous resonance in the hydrolysis products:
These resonances can occur simultaneously
O
OR'RO O P
O
O
–
P
O
O
–
RO O
–
+P
O
O
–
–
O OR' P
O
O
–
C
O
C
O
–
O
+
CH
3
H
3
C
C
O
–
C
O
O
+
CH
3
C
O
–
OCH
3
C
–
O
OCH
3
C
O
H
3
CO
–
C
O
–
H
3
CO
H
3
C
C
O
C
O
CH
3
H
3
C
ACTIVE FIGURE 3.8 (a) Electrostatic repulsion between adjacent partial positive charges (on
carbon and phosphorus, respectively) is relieved upon hydrolysis of the anhydride bonds of acetic anhydride
and phosphoric anhydrides. (b) The competing resonances of acetic anhydride and the simultaneous reso-
nance forms of the hydrolysis product, acetate. Test yourself on the concepts in this figure at www
.cengage.com/login
62 Chapter 3 Thermodynamics of Biological Systems
O
–
O
␦
–
–
O
OH
P
␦
+
O
–
O
␦
–
P
␦
+
O
OH
NH
2
N
N
N
N
OH
O
OH
NH
2
N
N
N
N
OH
O
OH
NH
2
N
N
N
N
ATP
ADP
AMP
OO
O
–
O
␦
–
P
␦
+
OCH
2
O
–
O
–
OOH
++H
+
P
–
O
O
–
O
␦
–
P
␦
+
O
O
–
O
␦
–
P
␦
+
OCH
2
O
–
O
–
OOH
++H
+
P
–
O
O
–
O
␦
–
P
␦
+
OCH
2
H
2
O
H
2
O
ANIMATED FIGURE 3.9 Hydrolysis of
ATP to ADP (and/or of ADP to AMP) leads to relief of
electrostatic repulsion. See this figure animated at
www.cengage.com/login
1,3-Bisphosphoglycerate 3-Phosphoglycerate
Acetyl phosphate
+++H
2
OCH
3
O
C
O
O
O
–
PO
–
HO
O
O
–
PO
–
CH
3
O
CO
–
H
+
+++H
2
O
O
C
HCOH
O
O
O
–
PO
–
O
O
–
PO
–
OCH
2
C
HCOH
O
O
–
PO
–
OCH
2
HO
O
O
–
PO
–
O
O
–
H
+
⌬G°' =
–
49.6 kJ/mol
⌬G°' =
–
43.3 kJ/mol
ACTIVE FIGURE 3.10 The hydrolysis reactions of acetyl phosphate and 1,3-bisphosphoglycerate.
Test yourself on the concepts in this figure at www.cengage.com/login