Biochemistry, 4th Edition P15 potx
Bạn đang xem bản rút gọn của tài liệu. Xem và tải ngay bản đầy đủ của tài liệu tại đây (306.59 KB, 10 trang )
5.4 How Is the Primary Structure of a Protein Determined? 103
in the protein. The efficiency with larger proteins is less; a typical 2000–amino acid
protein provides only 10 to 20 cycles of reaction.
B. C-Terminal Analysis For the identification of the C-terminal residue of polypep-
tides, an enzymatic approach is commonly used. Carboxypeptidases are enzymes that
cleave amino acid residues from the C-termini of polypeptides in a successive fashion.
Four carboxypeptidases are in general use: A, B, C, and Y. Carboxypeptidase A (from
bovine pancreas) works well in hydrolyzing the C-terminal peptide bond of all residues
except proline, arginine, and lysine. The analogous enzyme from hog pancreas, car-
boxypeptidase B, is effective only when Arg or Lys are the C-terminal residues. Carboxy-
peptidase C from citrus leaves and carboxypeptidase Y from yeast act on any C-terminal
residue. Because the nature of the amino acid residue at the end often determines the
rate at which it is cleaved and because these enzymes remove residues successively, care
must be taken in interpreting results. Carboxypeptidase Y cleavage has been adapted
to an automated protocol analogous to that used in Edman sequenators.
Steps 4 and 5. Fragmentation of the Polypeptide Chain
The aim at this step is to produce fragments useful for sequence analysis. The cleav-
age methods employed are usually enzymatic, but proteins can also be fragmented by
specific or nonspecific chemical means (such as partial acid hydrolysis). Proteolytic
enzymes offer an advantage in that many hydrolyze only specific peptide bonds, and
this specificity immediately gives information about the peptide products. As a first
approximation, fragments produced upon cleavage should be small enough to yield
their sequences through end-group analysis and Edman degradation, yet not so small
that an overabundance of products must be resolved before analysis.
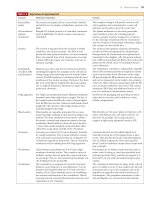
A. Trypsin The digestive enzyme trypsin is the most commonly used reagent for
specific proteolysis. Trypsin will only hydrolyze peptide bonds in which the carbonyl
function is contributed by an arginine or a lysine residue. That is, trypsin cleaves on
the C-side of Arg or Lys, generating a set of peptide fragments having Arg or Lys at
their C-termini. The number of smaller peptides resulting from trypsin action is
equal to the total number of Arg and Lys residues in the protein plus one—the pro-
tein’s C-terminal peptide fragment (Figure 5.10).
B. Chymotrypsin Chymotrypsin shows a strong preference for hydrolyzing pep-
tide bonds formed by the carboxyl groups of the aromatic amino acids, phen-
ylalanine, tyrosine, and tryptophan. However, over time, chymotrypsin also hy-
drolyzes amide bonds involving amino acids other than Phe, Tyr, or Trp. For
instance, peptide bonds having leucine-donated carboxyls are also susceptible.
Thus, the specificity of chymotrypsin is only relative. Because chymotrypsin pro-
duces a very different set of products than trypsin, treatment of separate samples
of a protein with these two enzymes generates fragments whose sequences over-
lap. Resolution of the order of amino acid residues in the fragments yields the
amino acid sequence in the original protein.
C. Other Endopeptidases A number of other endopeptidases (proteases that cleave
peptide bonds within the interior of a polypeptide chain) are also used in sequence
investigations. These include clostripain, which acts only at Arg residues; endopepti-
dase Lys-C, which cleaves only at Lys residues; and staphylococcal protease, which acts
at the acidic residues, Asp and Glu. Other, relatively nonspecific endopeptidases are
handy for digesting large tryptic or chymotryptic fragments. Pepsin, papain, subtil-
isin, thermolysin, and elastase are some examples. Papain is the active ingredient in
meat tenderizer, soft contact lens cleaner, and some laundry detergents.
D. Cyanogen Bromide Several highly specific chemical methods of proteolysis are
available, the most widely used being cyanogen bromide (CNBr) cleavage. CNBr acts
upon methionine residues (Figure 5.11). The nucleophilic sulfur atom of Met reacts
104 Chapter 5 Proteins:Their Primary Structure and Biological Functions
(b)
N—Asp—Ala—Gly—Arg—His—Cys—Lys—Trp—Lys—Ser—Glu—Asn—Leu—Ile—Arg—Thr—Tyr—C
Trypsin
Asp—Ala—Gly—Arg
His—Cys—Lys
Trp—Lys
Ser—Glu—Asn—Leu—Ile—Arg
Thr—Tyr
N
H
CH C CH
O
CH
2
CH
2
CH
2
HN
CNH
2
NH
2
N
H
CH
3
+
C
O
N
H
CH
CH
2
OH
C
O
N
H
CH
CH
2
CH
2
CH
2
CH
2
NH
3
+
C
O
N
H
CH
CH
2
COO
–
C
O
(a)
Trypsin
Ala
Trypsin
Arg Ser Lys Asp
ANIMATED FIGURE 5.10 (a) Trypsin is a
proteolytic enzyme, or protease, that specifically cleaves
only those peptide bonds in which arginine or lysine
contributes the carbonyl function. (b) The products of
the reaction are a mixture of peptide fragments with
C-terminal Arg or Lys residues and a single peptide
derived from the polypeptide’s C-terminal end. See
this figure animated at www.cengage.com/
login
H
3
N
S
CH
3
CH
2
CH
2
CC
O
H
N
H
N
C
δ+
Br
δ–
N
Br
–
S
CH
3
CH
2
CH
2
C
O
H
N
H
N
+
H
3
CS CN
CC
CH
2
N
N
CH
2
O
+
Methyl thiocyanate
CC
CH
2
O
N
CH
2
O
CN
+
H
C
HHHHHH
H
2
O
+
H
3
N Peptide
(C-terminal peptide)
CH
3
CH
2
S
CH
2
C
C
O
H
N
H
C
H
N
OVERALL REACTION:
Polypeptide
70%
HCOOH
CH
2
C
CH
2
O
Peptide with C-terminal
homoserine lactone
BrCN
H
O
N
H
+
Peptide
(C-terminal peptide)
1
2
3
ANIMATED FIGURE 5.11 Cyanogen
bromide (CNBr) is a highly selective reagent for cleavage
of peptides only at methionine residues. (1) Nucleophilic
attack of the Met S atom on the OCqN carbon atom,
with displacement of Br. (2) Nucleophilic attack by the
Met carbonyl oxygen atom on the R group.The cyclic
derivative is unstable in aqueous solution. (3) Hydrolysis
cleaves the Met peptide bond.C-terminal homoserine
residues occur where Met residues once were. See
this figure animated at www.cengage.com/
login
5.4 How Is the Primary Structure of a Protein Determined? 105
with CNBr, yielding a sulfonium ion that undergoes a rapid intramolecular re-
arrangement to form a cyclic iminolactone. Water readily hydrolyzes this iminolac-
tone, cleaving the polypeptide and generating peptide fragments having C-terminal
homoserine lactone residues at the former Met positions.
E. Other Chemical Methods of Fragmentation A number of other chemical
methods give specific fragmentation of polypeptides, including cleavage at
asparagine–glycine bonds by hydroxylamine (NH
2
OH) at pH 9 and selective hy-
drolysis at aspartyl–prolyl bonds under mildly acidic conditions. Table 5.2 summa-
rizes the various procedures described here for polypeptide cleavage. These meth-
ods are only a partial list of the arsenal of reactions available to protein chemists.
Cleavage products generated by these procedures must be isolated and individually
sequenced to accumulate the information necessary to reconstruct the protein’s
complete amino acid sequence. Peptide sequencing today is most commonly done
by Edman degradation of relatively large peptides or by mass spectrometry (see fol-
lowing discussion).
Step 6. Reconstruction of the Overall Amino Acid Sequence
The sequences obtained for the sets of fragments derived from two or more cleav-
age procedures are now compared, with the objective being to find overlaps that es-
tablish continuity of the overall amino acid sequence of the polypeptide chain. The
strategy is illustrated by the example shown in Figure 5.12. Peptides generated from
specific fragmentation of the polypeptide can be aligned to reveal the overall amino
acid sequence. Such comparisons are also useful in eliminating errors and validat-
ing the accuracy of the sequences determined for the individual fragments.
The Amino Acid Sequence of a Protein Can Be Determined
by Mass Spectrometry
Mass spectrometers exploit the difference in the mass-to-charge (m/z) ratio of ion-
ized atoms or molecules to separate them from each other. The m/z ratio of a mol-
ecule is also a highly characteristic property that can be used to acquire chemical
and structural information. Furthermore, molecules can be fragmented in distinc-
tive ways in mass spectrometers, and the fragments that arise also provide quite spe-
cific structural information about the molecule. The basic operation of a mass spec-
trometer is to (1) evaporate and ionize molecules in a vacuum, creating gas-phase
ions; (2) separate the ions in space and/or time based on their m/z ratios; and
Peptide Bond on
Carboxyl (C) or Amino (N) Susceptible
Method Side of Susceptible Residue Residue(s)
Proteolytic enzymes*
Trypsin C Arg or Lys
Chymotrypsin C Phe, Trp, or Tyr; Leu
Clostripain C Arg
Staphylococcal protease C Asp or Glu
Chemical methods
Cyanogen bromide C Met
NH
2
OH Asn-Gly bonds
pH 2.5, 40°C Asp-Pro bonds
*Some proteolytic enzymes, including trypsin and chymotrypsin, will not cleave peptide bonds where proline is the
amino acid contributing the N-atom.
TABLE 5.2
Specificity of Representative Polypeptide Cleavage Procedures Used in Sequence Analysis
106 Chapter 5 Proteins:Their Primary Structure and Biological Functions
(3) measure the amount of ions with specific m/z ratios. Because proteins (as well
as nucleic acids and carbohydrates) decompose upon heating, rather than evapo-
rating, methods to ionize such molecules for mass spectrometry (MS) analysis re-
quire innovative approaches. The two most prominent MS modes for protein analy-
sis are summarized in Table 5.3.
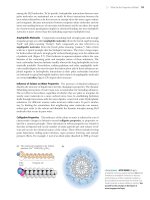
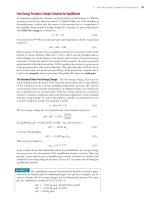
Figure 5.13 illustrates the basic features of electrospray mass spectrometry (ESI
MS). In this technique, the high voltage at the electrode causes proteins to pick up
GSQCGHGDCCEQCK
FS
KSGTECRASMSECDPAEHCTGQSSECPADVFHKNGQPCLDNYGYCYNGNCPIMYHQCYDL
K
SGTECRASMSECDPAEHCTGQSSECPADVF
NGQPCLDNYGYCYNGNCPIMYHQCYDL
SECDPAEHCTGQSSECPADVFHKNGQPCLDNYGYCY
YHQCYDL
FGADVYEAEDSCFERNQKGNYYGYCRKENGNKIPCCAPEDVKCGRLYCKDNSPGQNNPCKM
–SCFERNQKGN
DVKCGRLYCKDNSPGQNNPCKM
FGADVYEAEDSCF
FGA
FYSNEDEHKGMVLPGTKCADGKVCSNGHCVDVATAY
FYSNEDEHKGM
VLPGTKCADGKVCSNGHCVDVATAY
FYSNEDEHKGMVLPGTKCADGKVC
CAT-C
CAT-C
CAT-C
CAT-C
N-Term
M1
K3
K4
M2
M3
M3
K4
K5
K6
K6
E13
E15
E15
M5
M4
1102030405060
70 80 90 110100 120
130 140 150 160 170 180
190 200 210
–RNQKGNYYGYCRKENGNKIPCCAPEDVKCGRLYCKDN–PGQN–
PCK
LGTDIISPPVCGNELLEVGEECDCGTPENCQNECCDAATCKLKSGSQCGHGDCCEQCKFS
LGTDIISPPVCGNELLEVGEECDCGTPENCQNECCDAAT
LGTDIISPPVCGNELLEVGEECDCGTPENCQNECCDAATCKLKSGSQCGHGDCCEQCK
SGSQCGHGDCCEQCK
FS
ANIMATED FIGURE 5.12 Summary of
the sequence analysis of catrocollastatin-C, a 23.6-kD
protein found in the venom of the western diamond-
back rattlesnake Crotalus atrox. Sequences shown are
given in the one-letter amino acid code.The overall
amino acid sequence (216 amino acid residues long) for
catrocollastatin-C as deduced from the overlapping
sequences of peptide fragments is shown on the lines
headed CAT-C. The other lines report the various
sequences used to obtain the overlaps.These sequences
were obtained from (a) N-term: Edman degradation of
the intact protein in an automated Edman sequenator;
(b) M: proteolytic fragments generated by CNBr cleav-
age, followed by Edman sequencing of the individual
fragments (numbers denote fragments M1 through M5);
(c) K: proteolytic fragments from endopeptidase Lys-C
cleavage, followed by Edman sequencing (only frag-
ments K3 through K6 are shown); (d) E: proteolytic frag-
ments from Staphylococcus protease digestion of catrocol-
lastatin sequenced in the Edman sequenator (only E13
through E15 are shown). (Adapted from Shimokawa, K., et al.,
1997. Sequence and biological activity of catrocollastatin-C: A disin-
tegrin-like/cysteine-rich two-domain protein from Crotalus atrox
venom. Archives of Biochemistry and Biophysics 343:35–43.)
See
this figure animated at www.cengage.com/
login
Electrospray Ionization (ESI-MS)
A solution of macromolecules is sprayed in the form of fine droplets from a glass
capillary under the influence of a strong electrical field. The droplets pick up positive
charges as they exit the capillary; evaporation of the solvent leaves multiply charged
molecules. The typical 20-kD protein molecule will pick up 10 to 30 positive charges.
The MS spectrum of this protein reveals all of the differently charged species as a
series of sharp peaks whose consecutive m/z values differ by the charge and mass of a
single proton (see Figure 5.14). Note that decreasing m/z values signify increasing
number of charges per molecule, z. Tandem mass spectrometers downstream from the
ESI source (ESI-MS/MS) can analyze complex protein mixtures (such as tryptic
digests of proteins or chromatographically separated proteins emerging from a liquid
chromatography column), selecting a single m/z species for collision-induced
dissociation and acquisition of amino acid sequence information.
Matrix-Assisted Laser Desorption Ionization-Time of Flight (MALDI-TOF MS)
The protein sample is mixed with a chemical matrix that includes a light-absorbing
substance excitable by a laser. A laser pulse is used to excite the chemical matrix, creating
a microplasma that transfers the energy to protein molecules in the sample, ionizing
them and ejecting them into the gas phase. Among the products are protein molecules
that have picked up a single proton. These positively charged species can be selected by
the MS for mass analysis. MALDI-TOF MS is very sensitive and very accurate; as little as
attomole (10
Ϫ18
moles) quantities of a particular molecule can be detected at accuracies
better than 0.001 atomic mass units (0.001 daltons). MALDI-TOF MS is best suited for
very accurate mass measurements.
TABLE 5.3
The Two Most Common Methods of Mass Spectrometry for Protein Analysis
5.4 How Is the Primary Structure of a Protein Determined? 107
protons from the solvent, such that, on average, individual protein molecules ac-
quire about one positive charge (proton) per kilodalton, leading to the spectrum of
m/z ratios for a single protein species (Figure 5.14). Computer analysis can convert
these data into a single spectrum that has a peak at the correct protein mass (Figure
5.14, inset).
Sequencing by Tandem Mass Spectrometry Tandem MS (or MS/MS) allows se-
quencing of proteins by hooking two mass spectrometers in tandem. The first mass
spectrometer is used as a filter to sort the oligopeptide fragments in a protein digest
based on differences in their m/z ratios. Each of these oligopeptides can then be se-
lected by the mass spectrometer for further analysis. A selected ionized oligopeptide
is directed toward the second mass spectrometer; on the way, this oligopeptide is frag-
mented by collision with helium or argon gas molecules (a process called collision-
induced dissociation, or c.i.d.), and the fragments are analyzed by the second mass
spectrometer (Figure 5.15). Fragmentation occurs primarily at the peptide bonds
linking successive amino acids in the oligopeptide. Thus, the products include a se-
ries of fragments that represent a nested set of peptides differing in size by one
amino acid residue. The various members of this set of fragments differ in mass by
56 atomic mass units [the mass of the peptide backbone atoms (NHOCHOCO)]
plus the mass of the R group at each position, which ranges from 1 atomic mass unit
(Gly) to 130 (Trp). MS sequencing has the advantages of very high sensitivity, fast
sample processing, and the ability to work with mixtures of proteins. Subpicomoles
(less than 10
Ϫ12
moles) of peptide can be analyzed with these spectrometers. In prac-
tice, tandem MS is limited to rather short sequences (no longer than 15 or so amino
acid residues). Nevertheless, capillary HPLC-separated peptide mixtures from
trypsin digests of proteins can be directly loaded into the tandem MS spectrometer.
Furthermore, separation of a complex mixture of proteins from a whole-cell extract
by two-dimensional gel electrophoresis (see Chapter Appendix), followed by trypsin
+
+
+
+
+
+
+
+
+
+
+
+
+
+
+
+
+
+
Mass spectrometer
(a)
High voltage
Sample
solution
Glass capillary
Countercurrent
Vacuum
interface
+
(b)
(c)
FIGURE 5.13 The three principal steps in electrospray ionization mass spectrometry (ESI-MS). (a) Small, highly
charged droplets are formed by electrostatic dispersion of a protein solution through a glass capillary sub-
jected to a high electric field; (b) protein ions are desorbed from the droplets into the gas phase (assisted by
evaporation of the droplets in a stream of hot N
2
gas); and (c) the protein ions are separated in a mass spec-
trometer and identified according to their m/z ratios. (Adapted from Figure 1 in Mann, M., and Wilm, M., 1995. Electro-
spray mass spectrometry for protein characterization. Trends in Biochemical Sciences 20:219–224.)
108 Chapter 5 Proteins:Their Primary Structure and Biological Functions
digestion of a specific protein spot on the gel and injection of the digest into the
HPLC/tandem MS, gives sequence information that can be used to identify specific
proteins. Often, by comparing the mass of tryptic peptides from a protein digest
with a database of all possible masses for tryptic peptides (based on all known pro-
tein and DNA sequences), one can identify a protein of interest without actually
sequencing it.
Peptide Mass Fingerprinting Peptide mass fingerprinting is used to uniquely identify
a protein based on the masses of its proteolytic fragments, usually produced by
trypsin digestion. MALDI-TOF MS instruments are ideal for this purpose because
they yield highly accurate mass data. The measured masses of the proteolytic frag-
ments can be compared to databases (see following discussion) of peptide masses
of known sequence. Such information is easily generated from genomic databases:
Nucleotide sequence information can be translated into amino acid sequence in-
formation, from which very accurate peptide mass compilations are readily calcu-
lated. For example, the SWISS-PROT database lists 1197 proteins with a tryptic
fragment of m/z ϭ 1335.63 (Ϯ0.2 D), 16 proteins with tryptic fragments of m/z ϭ
1335.63 and m/z ϭ 1405.60, but only a single protein (human tissue plasminogen
activator [tPA]) with tryptic fragments of m/z ϭ 1335.63, m/z ϭ 1405.60, and m/z ϭ
25
50
Intensity (%)
0
75
100
1000800 1200 1400 1600
m/z
47000
47342
0
50+
50
100
48000
Molecular weight
40+
30+
FIGURE 5.14 Electrospray ionization mass spectrum of the protein aerolysin K.The attachment of many pro-
tons per protein molecule (from less than 30 to more than 50 here) leads to a series of m/z peaks for this sin-
gle protein.The equation describing each m/z peak is: m/z ϭ [M ϩ n(mass of proton)]/n(charge on proton),
where M ϭ mass of the protein and n ϭ number of positive charges per protein molecule.Thus, if the number
of charges per protein molecule is known and m/z is known, M can be calculated.The inset shows a computer
analysis of the data from this series of peaks that generates a single peak at the correct molecular mass of the
protein. (Adapted from Figure 2 in Mann, M., and Wilm, M., 1995. Electrospray mass spectrometry for protein characterization.
Trends in Biochemical Sciences 20:219–224.)
5.4 How Is the Primary Structure of a Protein Determined? 109
1272.60.
1
Although the identities of many proteins revealed by genomic analysis re-
main unknown, peptide mass fingerprinting can assign a particular protein exclu-
sively to a specific gene in a genomic database.
Sequence Databases Contain the Amino Acid Sequences
of Millions of Different Proteins
The first protein sequence databases were compiled by protein chemists using chem-
ical sequencing methods. Today, the vast preponderance of protein sequence infor-
mation has been derived from translating the nucleotide sequences of genes into
codons and, thus, amino acid sequences (see Chapter 12). Sequencing the order of
nucleotides in cloned genes is a more rapid, efficient, and informative process than
determining the amino acid sequences of proteins by chemical methods. Several
electronic databases containing continuously updated sequence information are ac-
cessible by personal computer. Prominent among these is the SWISS-PROT protein
Electrospray Ionization Tandem Mass Spectrometer
Electrospray
ionization
source
MS-1 Collision cell MS-2 Detector
P
1
P
2
P
3
P
4
P
5
F
1
F
2
F
3
F
4
F
5
MS-1 MS-2He
gas
Collision
cell
IS
Det
Electrospray
ionization
(a)
(c)
(b)
Fragmentation
at peptide
bonds
C
R
1
C
HH
N
H
OO
C
R
2
N
H
O
C
R
3
C
H
NC
H
FIGURE 5.15 Tandem mass spectrometry. (a) Configuration used in tandem MS. (b) Schematic description of
tandem MS:Tandem MS involves electrospray ionization of a protein digest (IS in this figure), followed by selec-
tion of a single peptide ion mass for collision with inert gas molecules (He) and mass analysis of the fragment
ions resulting from the collisions. (c) Fragmentation usually occurs at peptide bonds, as indicated. (Adapted from
Yates, J. R., 1996. Protein structure analysis by mass spectrometry. Methods in Enzymology 271:351–376; and Gillece-Castro, B. L.,
and Stults, J. T., 1996. Peptide characterization by mass spectrometry. Methods in Enzymology 271:427–447.)
1
The tPA amino acid sequences corresponding to these masses are m/z ϭ 1335.63: HEALSPFYSER;
m/z ϭ 1405.60: ATCYEDQGISYR; and m/z ϭ 1272.60: DSKPWCYVFK.
110 Chapter 5 Proteins:Their Primary Structure and Biological Functions
sequence database on the ExPASy (Expert Protein Analysis System) Molecular Biology
server at and the PIR (Protein Identification Resource Protein
Sequence Database) at , as well as protein information from
genomic sequences available in databases such as GenBank, accessible via the National
Center for Biotechnology Information (NCBI) Web site located at
.nih.gov. The protein sequence databases contain several hundred thousand entries,
whereas the genomic databases list nearly 100 million nucleotide sequences cover-
ing over 100 gigabases (100 billion bases) from over 165,000 organisms. The Protein
Data Bank (PDB; is a protein database that provides three-
dimensional structure information on more than 50,000 proteins and nucleic acids.
5.5 What Is the Nature of Amino Acid Sequences?
Figure 5.16 illustrates the relative frequencies of the amino acids in proteins. It is
very unusual for a globular protein to have an amino acid composition that deviates
substantially from these values. Apparently, these abundances reflect a distribution
of amino acid polarities that is optimal for protein stability in an aqueous milieu.
Membrane proteins tend to have relatively more hydrophobic and fewer ionic
amino acids, a condition consistent with their location. Fibrous proteins may show
compositions that are atypical with respect to these norms, indicating an underly-
ing relationship between the composition and the structure of these proteins.
Proteins have unique amino acid sequences, and it is this uniqueness of sequence
that ultimately gives each protein its own particular personality. Because the number
of possible amino acid sequences in a protein is astronomically large, the probability
that two proteins will, by chance, have similar amino acid sequences is negligible.
Consequently, sequence similarities between proteins imply evolutionary relatedness.
Leu
0
2
4
%
6
8
10
Amino acid composition
Ala Ser Gly Val Glu Lys Ile Thr Asp Arg Pro Asn Phe Gln Tyr Met His Cys Trp
Aliphatic
Key:
Acidic
Small hydroxy
(Ser and Thr)
Basic
Aromatic
(Phe, Trp, Tyr)
Amide
Sulfur
FIGURE 5.16 Amino acid composition: frequencies of the various amino acids in proteins for all the proteins in
the SWISS-PROT protein knowedgebase.These data are derived from the amino acid composition of more
than 100,000 different proteins (representing more than 40,000,000 amino acid residues).The range is from
leucine at 9.55% to tryptophan at 1.18% of all residues.
5.5 What Is the Nature of Amino Acid Sequences? 111
Homologous Proteins from Different Organisms Have Homologous
Amino Acid Sequences
Proteins sharing a significant degree of sequence similarity and structural resem-
blance are said to be homologous. Proteins that perform the same function in differ-
ent organisms are also referred to as homologous. For example, the oxygen transport
protein hemoglobin serves a similar role and has a similar structure in all vertebrates.
The study of the amino acid sequences of homologous proteins from different or-
ganisms provides very strong evidence for their evolutionary origin within a common
ancestor. Homologous proteins characteristically have polypeptide chains that are
nearly identical in length, and their sequences share identity in direct correlation to
the relatedness of the species from which they are derived.
Homologous proteins can be further subdivided into orthologous and paralo-
gous proteins. Orthologous proteins are proteins from different species that have
homologous amino acid sequences (and often a similar function). Orthologous
proteins arose from a common ancestral gene during evolution. Paralogous pro-
teins are proteins found within a single species that have homologous amino acid
sequences; paralogous proteins arose through gene duplication. For example, the
␣- and -globin chains of hemoglobin are paralogs. How is homology revealed?
Computer Programs Can Align Sequences and Discover Homology
between Proteins
Protein and nucleic acid sequence databases (see page 110) provide enormous re-
sources for sequence comparisons. If two proteins share homology, it can be re-
vealed through alignment of their sequences using powerful computer programs.
In such studies, a given amino acid sequence is used to query the databases for pro-
teins with similar sequences. BLAST (Basic Local Alignment Search Tool) is one
commonly used program for rapid searching of sequence databases. The BLAST
program detects local as well as global alignments where sequences are in close
agreement. Even regions of similarity shared between otherwise unrelated proteins
can be detected. Discovery of sequence similarities between proteins can be an im-
portant clue to the function of uncharacterized proteins. Similarities are also useful
in assigning related proteins to protein families.
The process of sequence alignment is an operation akin to sliding one sequence
along another in a search for regions where the two sequences show a good match.
Positive scores are assigned everywhere the amino acid in one sequence is similar to
or identical with the amino acid in the other; the greater the overall score, the bet-
ter the match between the two protein sequences. Sometimes two sequences match
well at several places along their lengths, but, in one of the proteins, the matching
segments are interrupted by a sequence that is dissimilar. When such an interrup-
tion is found by the computer program, it inserts a gap in the uninterrupted se-
quence to bring the matching segments of the two sequences into better alignment
(Figure 5.17). Because any two sequences would show similarity if a sufficient num-
ber of gaps were introduced, a gap penalty is imposed for each gap. Gap penalties
are negative numbers that lower the overall similarity score. Gaps arise naturally
during evolution through insertion and deletion mutations socalled indels, which
FPIAKGGTAAIPGPFGSGKTVTLQSLAKWSAAK
–––
VVIYVGCGERGNEMTD
CPFAKGGKVGLFGGAGVGKTVNMMELIRNIAIEHSGYSVFAGVGERTREGND
S. acidocaldarius
E. coli
FIGURE 5.17 Alignment of the amino acid sequences of two protein homologs using gaps. Shown are parts of
the amino acid sequences of the catalytic subunits from the major ATP-synthesizing enzyme (ATP synthase) in
a representative archaea (Sulfolobus acidocaldarius) and a bacterium (Escherichia coli). These protein segments
encompass the nucleotide-binding site of these enzymes. Identical residues in the two sequences are shown
in red. Introduction of a three-residue-long gap in the archaeal sequence optimizes alignment of the two
sequences.
112 Chapter 5 Proteins:Their Primary Structure and Biological Functions
add or remove residues in the gene and, consequently, the protein. The optimal se-
quence alignment between two proteins is one that maximizes sequence alignments
while minimizing gaps.
Methods for alignment and comparison of protein sequences depend upon
some quantitative measure of how similar any two sequences are. One way to mea-
sure similarity is to use a matrix that assigns scores for all possible substitutions of
one amino acid for another. BLOSUM62 is the substitution matrix most often
used with BLAST. This matrix assigns a probability score for each position in an
alignment based on the frequency with which that substitution occurs in the con-
sensus sequences of related proteins. BLOSUM is an acronym for Blocks Substi-
tution Matrix, a matrix that scores each position on the basis of observed fre-
quencies of different amino acid substitutions within blocks of local alignments in
related proteins. In the BLOSUM62 matrix, the most commonly used matrix, the
scores are derived using sequences sharing no more than 62% identity (Figure
5.18). BLOSUM substitution scores range from Ϫ4 (lowest probability of substi-
tution) to 11 (highest probability of substitution). For example, to look up the
value corresponding to the substitution of an asparagine (N) by a tryptophan
(W), or vice versa, find the intersection of the “N” column with the “W” row in Fig-
ure 5.18. The value Ϫ4 means that the substitution of N for W, or vice versa, is not
very likely. On the other hand, the substitution of V for I, (BLOSUM score: 3) or
vice versa, is very likely. Amino acids whose side chains have unique qualities (such
as C, H, P, or W) have high BLOSUM62 scores, because replacing them with any
other amino acid may change the protein significantly. Amino acids that are sim-
ilar (such as R and K, or D and E, or A, V, L, and I) have low scores, since one can
replace the other with less likelihood of serious change to the protein structure.
Cytochrome c The electron transport protein cytochrome c, found in the mi-
tochondria of all eukaryotic organisms, provides a well-studied example of or-
thology. Amino acid sequencing of cytochrome c from more than 40 different
species has revealed that there are 28 positions in the polypeptide chain where
A
V
4
Y
–1
7
W
–3
2
11
T
0
5
–2
–2
S
–2
1
4
–2
–3
P
–2
–1
–1
7
–3
–4
F
–1
–2
–2
–4
6
3
1
M
1
–1
–1
–2
0
5
–1
–1
K
–2
–1
0
–1
–3
–1
5
–2
–3
L
1
–1
–2
–3
0
2
–2
4
–1
–2
I
3
–1
–2
–3
0
1
–3
2
4
–1
–3
H
–3
–2
–1
–2
–1
–2
–1
–3
–3
8
2
–2
G
–3
–2
0
–2
–3
–3
–2
–4
–4
–2
6
–3
–2
E
–2
–1
0
–1
–3
–2
1
–3
–3
0
–2
5
–2
–3
Q
–2
–1
0
–1
–3
0
1
–2
–3
0
–2
2
5
–1
–2
C
–1
–1
–1
–3
–2
–1
–3
–1
–1
–3
–3
–4
–3
9
–2
–2
D
–3
–1
0
–1
–3
–3
–1
–4
–3
–1
–1
2
0
–3
6
–3
–4
R
–3
–1
–1
–2
–3
–1
2
–2
–3
0
–2
0
1
–3
–2
0
–2
–3
5
A
0
0
1
–1
–2
–1
–1
–1
–1
–2
0
–1
–1
–1
0
–2
–2
4
–2
–3
–3
0
1
–2
–3
–2
0
–3
–3
1
0
0
0
–3
1
6
–2
–4
N
V
Y
W
T
S
P
F
M
K
L
I
H
G
E
Q
C
D
N
R
FIGURE 5.18 The BLOSUM62 substitution matrix provides scores for all possible exchanges of one amino acid
with another.
(From Henikoff, S., and Henikoff, J. G., 1992. Amino acid substitution matrices from protein blocks. Proceedings of
the National Academy of Sciences, USA 89:10915–10919.)
