Biochemistry, 4th Edition P31 ppsx
Bạn đang xem bản rút gọn của tài liệu. Xem và tải ngay bản đầy đủ của tài liệu tại đây (1.78 MB, 10 trang )
9.4 What Are the Dynamic Processes That Modulate Membrane Function? 263
bilayer thickness is maximal. At higher temperatures, the acyl chains undergo much
more motion, with rotations around the acyl chain C–C bonds and significant large-
scale bending of the acyl chains. The membrane is then said to be in a liquid crys-
talline phase or liquid-disordered state (L
d
state) (Figure 9.27). In this less ordered
state, the surface area per lipid increases and the bilayer thickness decreases by 10%
to 15%. Under most conditions, the transition from the gel phase to the liquid crys-
talline phase is a true phase transition, and the temperature at which this change
occurs is referred to as a transition temperature or melting temperature (T
m
).
The sharpness of the transition in pure lipid preparations shows that the phase
change is a cooperative behavior. This is to say that the behavior of one or a few mol-
ecules affects the behavior of many other molecules in the vicinity. The sharpness
of the transition then reflects the number of molecules that are acting in concert.
Sharp transitions involve large numbers of molecules all “melting” together.
Phase transitions have been characterized in a number of different pure and
mixed lipid systems. Table 9.2 shows a comparison of the transition temperatures ob-
served for several different phosphatidylcholines with different fatty acyl chain com-
positions. General characteristics of bilayer phase transitions include the following:
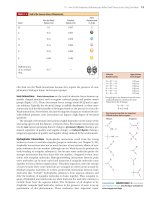
1. The transitions are always endothermic; heat is absorbed as the temperature in-
creases through the transition (Figure 9.27).
Heat absorption
Temperature
Main
transition
Pretransition
Post transitionBefore transition
Heat
Gel Liquid crystal
Anti conformation
Gauche conformations
ANIMATED FIGURE 9.27 The gel-to-liquid crystalline phase transition, which occurs when a
membrane is warmed through the transition temperature, T
m
. In the transition, the surface area increases, the
membrane thickness decreases, and the mobility of the lipid chains increases dramatically. Membrane phase
transitions can be characterized by measuring the rate of heat absorption by a membrane sample in a
calorimeter. Pure, homogeneous bilayers (containing only a single lipid component) give sharp calorimetric
peaks. As membrane heterogeneity increases, the calorimetric peaks broaden. Below phase transitions, lipid
chains primarily adopt the anti conformation. Above the phase transition, lipid chains have absorbed a sub-
stantial amount of heat.This is reflected in the adoption of higher-energy conformations, including the gauche
conformations shown. See this figure animated at www.cengage.com/login.
264 Chapter 9 Membranes and Membrane Transport
2. Particular phospholipids display characteristic transition temperatures (T
m
). As
shown in Table 9.2, T
m
increases with chain length, decreases with unsaturation,
and depends on the nature of the polar head group.
3. For pure phospholipid bilayers, the transition occurs over a narrow temperature
range. The phase transition for dimyristoyl lecithin has a peak width of about
0.2°C.
Transition Temperature
Phospholipid (T
m
), °C
Dilauroyl phosphatidylcholine (Di 14Ϻ0) 23.6
Dipalmitoyl phosphatidylcholine (Di 16Ϻ0) 41.4
Distearoyl phosphatidylcholine (Di 18Ϻ0) 58
1-Stearoyl-2-oleoyl-phosphatidylcholine 3
(1-18Ϻ0, 2-18Ϻ1 PC)
Dioleoyl phosphatidylcholine (Di 18Ϻ1 PC) Ϫ22
Egg phosphatidylcholine (Egg PC) Ϫ15
Dipalmitoyl phosphatidic acid (Di 16Ϻ0 PA) 67
Dipalmitoyl phosphatidylethanolamine (Di 16Ϻ0 PE) 63.8
Dipalmitoyl phosphatidylglycerol (Di 16Ϻ0 PG) 41.0
Adapted from Jain, M.,and Wagner, R.C., 1980. Introduction to Biological Membranes. New York: John Wiley and Sons; and
Martonosi, A., ed., 1982. Membranes and Transport, Vol. 1. New York: Plenum Press.
TABLE 9.2
Phase Transition Temperatures for Phospholipids in Water
Outside
Cholesterol
Membrane
Acyl groups
Doubly
acylated
protein
Caveolin
(b)
GPI-anchored
protein
Raft
(a)
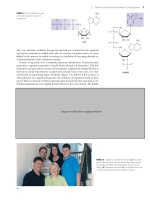
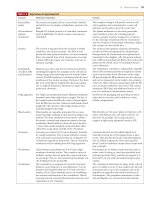
FIGURE 9.28 (a) A model for a membrane raft. Relative
to other parts of the membrane, rafts are presumed to
be enriched in cholesterol, fatty acyl-anchored proteins,
and GPI-anchored proteins. Sphingolipids are found
predominantly in the outer leaflet of the raft bilayer.
(b) Rafts are postulated to “grow” by accumulation of
these components as they diffuse through the plane of
the membrane.They become increasingly stable as they
grow. Green circles represent GPI-anchored proteins,
which accumulate in lipid rafts as they grow in size.
(Adapted from Hancock, J.F., 2006.Lipid rafts: Contentious only
from simplistic standpoints. Nature Reviews Molecular Cell Biology
7:456–462, and Parton, R. G., and K. Simons, 2007.The multiple
faces of caveolae. Nature Reviews Molecular Cell Biology
8:185–194.)
9.4 What Are the Dynamic Processes That Modulate Membrane Function? 265
4. Native biological membranes also display characteristic phase transitions, but
these are broad and strongly dependent on the lipid and protein composition of
the membrane.
5. With certain lipid bilayers, a change of physical state referred to as a pretransition
occurs 5° to 15°C below the phase transition itself. These pretransitions involve
a tilting of the hydrocarbon chains.
6. A volume change is usually associated with phase transitions in lipid bilayers.
7. Bilayer phase transitions are sensitive to the presence of solutes that interact with
lipids, including multivalent cations, lipid-soluble agents, peptides, and proteins.
Cells adjust the lipid composition of their membranes to maintain proper fluidity
as environmental conditions change.
The Evidence for Liquid Ordered Domains and Membrane Rafts In addition to
the solid ordered (S
o
) and liquid disordered (L
d
) states, model lipid bilayers can
exhibit a third structural phase if the membrane contains sufficient cholesterol.
The liquid-ordered (L
o
) state is characterized by a high degree of acyl chain order-
ing (like the S
o
state) but has the translational disorder characteristic of the L
d
state.
Lipid diffusion in the L
o
phase is about twofold to threefold slower than in the
L
d
phase.
Biological membranes are hypothesized to contain regions equivalent to the
L
o
phase of model membranes. These microdomains are postulated to be aggre-
gates of cholesterol and glycosphingolipids with long, saturated fatty acyl chains
(particularly ceramides and gangliosides), and they are termed membrane rafts.
The physical evidence for membrane rafts is indirect; thus, their existence is a mat-
ter of debate among membrane biochemists. Direct measurements of rafts are dif-
ficult, because they are small (with postulated diameters of 10 to 50 nm) and be-
cause they are apparently transient, with lifetimes from a tenth of a millisecond or
less to a few seconds or more. The most likely scenario, based on existing data, is
shown in Figure 9.28.
Many of the proteins that appear to associate with and stabilize rafts are cell sur-
face receptor proteins and other proteins involved in cell signaling processes (see
Chapter 32). Association in rafts may be advantageous for the functioning of these
proteins.
Lateral Membrane Diffusion Is Restricted by Barriers and Fences A variety of
studies of lateral diffusion rates in membranes have shown that membrane proteins
and lipids in plasma membranes diffuse laterally at a rate 5 to 50 times slower than
those of artificial lipid membranes. Why should this be? Part of the answer has come
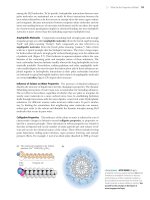
from single particle tracking experiments (Figure 9.29), which reveal that lipids and
at least some membrane proteins tend to undergo hop diffusion, such that they can
diffuse freely within a membrane “compartment” for a time and then hop to an ad-
jacent compartment, where the process repeats. Akihiro Kusumi and colleagues have
proposed the membrane–skeleton fence model to explain this behavior, suggesting
that certain proteins that comprise the cytoskeleton—a network of proteins on the
cytoplasmic face of the plasma membrane—restrict the lateral diffusion of other
membrane proteins (Figure 9.30). The “fence” proteins may include spectrin, a fila-
mentous cytoskeletal protein in red blood cells, and actin, a cytoskeletal protein
found in many other eukaryotic cells. The single particle tracking experiments show
that lipid molecules are typically confined within fenced compartments for approxi-
mately 13 to 15 msec, whereas transmembrane proteins are typically confined for 45
to 65 msec. Even lipids in the outer leaflet of the plasma membrane undergo hop
diffusion, leading Kusumi and colleagues to postulate that transmembrane proteins
act as rows of “pickets” extending across both monolayers in these membrane fences.
Fences thus define regions of relatively unrestricted lipid diffusion.
Lipids and Proteins Direct Dynamic Membrane Remodeling and Curvature The
complex shapes of cells and organelles are the result of forces that operate on their
membranes, and these forces in turn are orchestrated by lipids and proteins.
Start
Finish
1 μm
6 ms
5 ms
6 ms
6 ms
11 ms
10 ms
18 ms
FIGURE 9.29 Motions of a single (fluorescently labeled)
lipid molecule on the surface of a cell can be measured
by video fluorescence microscopy. Video recording at
40,000 frames per second yields a time resolution of
25 microseconds. Data collected over 62 milliseconds
(a total of 2500 frames) show that a lipid diffuses rapidly
within small domains (defined by colors) and occasional-
ly jumps or hops to an adjacent region (shown as a color
change). (Adapted from Kusumi,A., et al., 2005.Paradigm shift of
the plasma membrane concept from the two-dimensional con-
tinuum fluid to the partitioned fluid: High-speed single-molecule
tracking of membrane molecules. Annual Review of Biophysics
and Biomolecular Structure 34:351–378.)
266 Chapter 9 Membranes and Membrane Transport
Membranes change their shapes in special ways during movement, cell division, and
other cellular events. This dynamic membrane remodeling is also accomplished by
the interplay of lipids and proteins. The various membrane subdomains with par-
ticular curvatures have precise and specialized biological properties and functions.
There are several ways to induce curvature in a membrane (Figure 9.31). Lipids
can influence or accommodate membrane curvature, either because of lipid mole-
cule geometry or because of an imbalance in the number of lipids in the inner and
outer leaflets of the bilayer. (In a liposome of 50-nm diameter, there is 56% more
lipid in the outer leaflet than in the inner leaflet.) Integral membrane proteins with
conical shapes can promote membrane curvature. The structure of a voltage-gated
K
ϩ
channel is an example of a shape conducive to membrane curvature (see Figure
9.41). Proteins of the cytoskeleton, such as actin, typically contact the plasma mem-
brane and can generate curvature by rearrangements of their own structure. More-
over, motor proteins (see Chapter 16) moving along filaments of the cytoskeleton
can generate curvature in the membrane. Scaffolding proteins, which can bind on
10 nm
Start
Start
FIGURE 9.30 Studies of single lipid molecule movement
in membranes (Figure 9.29) are consistent with a “com-
partmentalized” model for the membrane, in which
lipids and proteins undergo short-term diffusion within
“fenced”compartments, with occasional hops to adja-
cent compartments. Akihiro Kusumi has suggested that
elements of the cytoskeleton may define the fence
boundaries at the membrane.
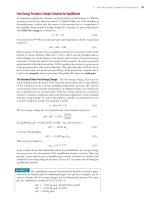
(a) Lipid composition (b) Membrane proteins (c) Amphipathic helix insertion
Acyl chain
composition
Head group
composition
(d) Scaffolding (e) Cytoskeleton
FIGURE 9.31 Membrane curvature can occur by several different mechanisms, including (a) changes in lipid
composition, (b) insertion of membrane proteins that have intrinsic curvature or that oligomerize,(c) insertion
of amphipathic helices into one leaflet of the bilayer, (d) interaction of the bilayer with molecular scaffolding
proteins, or (e) changes induced by the cytoskeletal filaments inside the cell. (Adapted from McMahon, H.T., and
Gallop, J. L.,2005. Membrane curvature and mechanisms of dynamic cell membrane remodeling. Nature 438:590–596.)
9.4 What Are the Dynamic Processes That Modulate Membrane Function? 267
either side of the plasma membrane, can influence membrane curvature in many
ways. For example, BAR domains are dimeric, banana-shaped structures (Figure
9.32) that bind preferentially to and stabilize curved regions of the plasma mem-
brane. Finally, amphipathic ␣-helices can insert into bilayers, parallel to the mem-
brane surface, thus forcing curvature on the membrane. N-BAR domains are BAR
domains that have an N-terminal ␣-helix preceding the BAR domain. The helix typ-
ically inserts to induce curvature, and the BAR domain binds to stabilize the curved
structure. Harvey McMahon and his colleagues have proposed a structure (Figure
9.32b) for N-BAR domain-mediated membrane curvature by endophilin-A1, a pro-
tein found at synapses and implicated in the formation of synaptic vesicles. Mem-
brane curvature is essential to a variety of cellular functions, including cell division,
viral budding, and the processes of endocytosis and exocytosis, described in the
next section.
Caveolins and Caveolae Respond to Plasma Membrane Changes Caveolae are
flask-shaped indentations in plasma membranes. Caveolae (Figure 9.33) are rich in
cholesterol, sphingolipids, and caveolin, an integral membrane protein of 22,000
MW. There are three members of the caveolin family. CAV1 and CAV2 are found in
endothelial, fibrous, and adipose (fat) tissue, whereas CAV3 is unique to skeletal
muscle. Caveolins form homodimers in the plasma membrane, with both N- and
C-termini oriented toward the cytosolic face of the membrane. The C-terminal
domain has several palmitoyl lipid anchors and is separated from the N-terminal
oligomerization domain by a 33-residue intramembrane hairpin domain. A typical
caveolar structure consists of about 144 caveolin molecules, with up to 20,000 cho-
lesterol molecules. Caveolae participate in mechanosensation, the detection and
sensing of mechanical forces at the membrane, and mechanotransduction, the con-
version of mechanical forces into biochemical signals that result in cell responses
that regulate cell growth, differentiation, cell shape, and cell death.
Vesicle Formation and Fusion Are Essential Membrane Processes The membranes
of cells are not static. Normal cell function requires that the various membrane-
enclosed compartments of the cell constantly reorganize and exchange proteins,
(a)
(b)
N-terminal amphipathic
helix
Helix 1 insert (H1I)
BAR domain dimer
FIGURE 9.32 Model of BAR domain binding to mem-
branes. (a) The classical model for binding of BAR
domains to membranes (pdb id ϭ 2C08). (b) A model
for membrane binding of endophilin-A1, with
amphiphilic helices inducing curvature that is stabilized
by BAR domain binding. (Adapted from Gallop, J. L., et al.,
2006. Mechanism of endophilin N-BAR domain-mediated mem-
brane curvature. The EMBO Journal 25:2898–2910. Image in (b)
kindly provided by Harvey T. McMahon.)
268 Chapter 9 Membranes and Membrane Transport
lipids, and other materials. These processes, and others such as cell division, exocyto-
sis, endocytosis, and viral infection, all involve either fusion of one membrane with an-
other or budding and separation of a vesicle from a membrane. Eukaryotic organelles
communicate with one another by the exchange of “trafficking vesicles.” Vesicles are
generated at a precursor membrane, transported to their destination, and then fused
with the target compartment (Figure 9.34). Although the organelles involved in these
processes are diverse—endoplasmic reticulum, Golgi, endosomes, and others—the ba-
sic reactions of budding and fusion are accomplished by protein families and multi-
protein complexes that have been conserved throughout eukaryotic evolution. The
molecular events of exocytotic release of neurotransmitters into the synapses of nerve
cells are good examples of such processes.
Neurons communicate with one another by converting electrical signals into
chemical signals and back again. When electrical signals arrive at the synapse, vesi-
cles containing neurotransmitters (such as acetylcholine—see Chapter 32) fuse
with the plasma membrane, releasing the neurotransmitters into the synaptic cleft.
Binding of neurotransmitters to receptors on an adjacent neuron generates an elec-
trical signal that is passed along. The fusion of vesicles with the plasma membrane
is directed by SNAREs—a family of proteins that “snare” vesicles to initiate the fu-
sion process. (The acronym, a somewhat strained effort to describe their function
cleverly, stands for soluble N-ethylmaleimide–sensitive factor attachment protein
receptor.) SNAREs are small proteins with a simple domain structure (Figure 9.35)
that includes a SNARE motif, consisting of 60 to 70 residues of classical 7-residue
repeats (see Chapter 6). The N-terminal domains are variable across the SNARE
family, but at their C-termini most SNAREs have a single transmembrane domain
joined to the SNARE motif by a short linker. Q
a
-SNARE and Q
bc
-SNARE are named
N
Caveolin
Caveola
C
Palmitoylation
Scaffolding
domain
Cholesterol(a)
N
C
Palmitoylation
Scaffolding
domain
(b)
FIGURE 9.33 (a) Caveolin possesses a central hydrophobic segment flanked by three covalently bound fatty
acyl anchors on the C-terminal side and a scaffolding domain on the N-terminal side. (b) Approximately
144 molecules of caveolin combine to force curvature in the lipid bilayer and form a caveolar structure. A
caveola may also contain as many as 20,000 cholesterol molecules. (Adapted from Parton, R. G., and K. Simons, 2007.
The multiple faces of caveolae. Nature Reviews Molecular Cell Biology 8:185–194.)
Lumen
Donor
compartment
Target
compartment
Transport
vesicle
Budding
Fusion
FIGURE 9.34 Vesicle-mediated transport in cells involves
budding of vesicles from a donor membrane, followed
by fusion of the vesicle membrane with the membrane
of a target compartment, a process that transfers the
contents of the donor compartment, as well as selected
membrane proteins. (Adapted from Alberts, B., 2007.Molecular
Biology of the Cell, 5th edition. New York, Garland Science.)
9.5 How Does Transport Occur Across Biological Membranes? 269
for a conserved glutamine (Q) residue, whereas R-SNARE is named for a conserved
arginine (R). Q
bc
-SNARE, also known as SNAP-25, consists of two SNARE domains
joined by a linker with two palmitoyl lipid anchors.
Q-SNAREs are organized in clusters on the plasma membrane and can form
acceptor complexes (Figure 9.36). When a neurotransmitter-laden vesicle ap-
proaches the plasma membrane, Q
a
-SNARE and Q
bc
-SNARE on the plasma mem-
brane join with R-SNARE on the vesicle to form a loose trans-complex through the
N-terminal ends of their SNARE motifs. The four SNARE motifs in these three pro-
teins “zip up” to form an increasingly stable helical complex (Figure 9.36), pulling
the two membranes together and inducing the binding of complexin, a small heli-
cal protein. Complexin binding “clamps” the complex so that it is poised for mem-
brane fusion but is unable to complete the process. Arrival of an action potential
(electrical signal—see Chapter 32) triggers flow of Ca
2+
ions into the cell through
channel proteins, and binding of Ca
2+
ion to synaptotagmin displaces complexin
and promotes joining of the membranes (to form the cis-complex) and the forma-
tion of a fusion pore. The complexin clamp (Figure 9.36) ensures that neurotrans-
mitter release can occur in an instant following Ca
2+
influx, because the slow steps
of SNARE assembly have already been completed.
9.5 How Does Transport Occur Across Biological Membranes?
Transport processes are vitally important to all life forms, because all cells must ex-
change materials with their environment. Cells obviously must have ways to bring nu-
trient molecules into the cell and ways to send waste products and toxic substances
out. Also, inorganic electrolytes must be able to pass in and out of cells and across or-
N-terminal
domain
SNARE
domain
Transmembrane
domain
SNARE
domain
SNARE
domain
(a) Q
a
SNARE
(b) Q
bc
SNARE
(c) R SNARE
FIGURE 9.35 (a) The domain structure of the SNARE
protein families. A variety of N-terminal domains are
found in Q
a
SNARE proteins, including the three-helix
bundle of syntaxin-1 (pdb id ϭ 1BR0); (b) Q
bc
SNAREs
are anchored in the membrane by palmitic acid lipid
anchors; (c) Many R SNAREs contain small globular
N-terminal domains such as Vam7, a PX-homology
domain (pdb id ϭ 1OCS). (Adapted from Jahn, R., and R. H.
Scheller, 2006. SNAREs—engines for membrane fusion. Nature
Reviews Molecular Cell Biology 7:631–643.)
270 Chapter 9 Membranes and Membrane Transport
ganelle membranes. All cells maintain concentration gradients of various metabolites
across their plasma membranes and also across the membranes of intracellular or-
ganelles. By their very nature, cells maintain a very large amount of potential energy
in the form of such concentration gradients. Sodium and potassium ion gradients
across the plasma membrane mediate the transmission of nerve impulses and the nor-
mal functions of the brain, heart, kidneys, and liver, among other organs. Storage and
release of calcium from cellular compartments controls muscle contraction, as well as
the response of many cells to hormonal signals. High acid concentrations in the stom-
ach are required for the digestion of food. Extremely high hydrogen ion gradients are
maintained across the plasma membranes of the mucosal cells lining the stomach in
order to maintain high acid levels in the stomach.
We shall consider the molecules and mechanisms that mediate these transport
activities. In nearly every case, the molecule or ion transported is water soluble, yet
moves across the hydrophobic, impermeable lipid membrane at a rate high enough
to serve the metabolic and physiological needs of the cell. This perplexing problem
is solved in each case by a specific transport protein. The transported species either
diffuses through a channel-forming protein or is carried by a carrier protein. Trans-
port proteins are all classed as integral membrane proteins.
From a thermodynamic and kinetic perspective, there are only three types of
membrane transport processes: passive diffusion, facilitated diffusion, and active trans-
port. To be thoroughly appreciated, membrane transport phenomena must be con-
1 2
3
6
5
4
Trans-complex
Complexin
Complexin
A
B
A
B
Complexin clamp
A
B
A
B
Fusion–pore opening (cis-complex)
Fusion completion
A
B
A
B
AA
B
B
FIGURE 9.36 SNARE complex assembly and its control.Step 1: Q SNARES, organized in clusters, assemble into
acceptor complexes in the plasma membrane.Step 2: Acceptor complexes interact with R-SNAREs in an
approaching vesicle through the N-terminal end of the SNARE motifs, forming a four-helical transcomplex.
Step 3: The transcomplex tightens or “zips up,” but membrane fusion and pore formation is prevented by bind-
ing of complexin. Step 4: Arrival of an action potential (nerve impulse) triggers displacement of complexin by
synaptotagmin, initiating fusion and pore formation. Step 5: Upon completion of the fusion process, the
transcomplex relaxes. Step 6: SNARES are redistributed to their respective membrane domains and vesicles are
reformed. (Adapted from Jahn, R.,and R. H. Scheller, 2006. SNAREs—engines for membrane fusion. Nature Reviews Molecular
Cell Biology 7:631–643.)
9.7 How Does Facilitated Diffusion Occur? 271
sidered in terms of thermodynamics. Some of the important kinetic considerations
also will be discussed.
9.6 What Is Passive Diffusion?
Passive diffusion is the simplest transport process. In passive diffusion, the trans-
ported species moves across the membrane in the thermodynamically favored direc-
tion without the help of any specific transport system/molecule. For an uncharged
molecule, passive diffusion is an entropic process, in which movement of molecules
across the membrane proceeds until the concentration of the substance on both
sides of the membrane is the same. For an uncharged molecule, the free energy dif-
ference between side 1 and side 2 of a membrane (Figure 9.37) is given by
⌬G ϭ G
2
Ϫ G
1
ϭ RT ln (9.1)
The difference in concentrations, [C
2
] Ϫ [C
1
], is termed the concentration gradient,
and ⌬G here is the chemical potential difference.
Charged Species May Cross Membranes by Passive Diffusion
For a charged species, the situation is slightly more complicated. In this case, the
movement of a molecule across a membrane depends on its electrochemical po-
tential. This is given by
⌬G ϭ G
2
Ϫ G
1
ϭ RT ln ϩ ZᏲ⌬ (9.2)
where Z is the charge on the transported species, Ᏺ is Faraday’s constant (the
charge on 1 mole of electrons ϭ 96,485 coulombs/mol ϭ 96,485 joules/voltиmol,
since 1 volt ϭ 1 joule/coulomb), and ⌬ is the electric potential difference (that is,
voltage difference) across the membrane. The second term in the expression thus
accounts for the movement of a charge across a potential difference. Note that the
effect of this second term on ⌬G depends on the magnitude and the sign of both Z
and ⌬.
For example, as shown in Figure 9.38, if side 2 has a higher potential than side 1
(so that ⌬ is positive), for a negatively charged ion the term ZᏲ⌬ makes a nega-
tive contribution to ⌬G. In other words, the negative charge is spontaneously at-
tracted to the more positive potential—and ⌬G is negative. In any case, if the sum
of the two terms on the right side of Equation 9.2 is a negative number, transport
of the ion in question from side 1 to side 2 would occur spontaneously. The driving
force for passive transport is the ⌬G term for the transported species itself.
9.7 How Does Facilitated Diffusion Occur?
The transport of many substances across simple lipid bilayer membranes via passive
diffusion is far too slow to sustain life processes. On the other hand, the transport
rates for many ions and small molecules across actual biological membranes are
much higher than anticipated from passive diffusion alone. This difference is due
to specific proteins in the cell membranes that facilitate transport of these species
across the membrane. Proteins capable of effecting facilitated diffusion of a variety
of solutes are present in essentially all natural membranes. Such proteins have two
features in common: (1) They facilitate net movement of solutes only in the ther-
modynamically favored direction (that is, ⌬G Ͻ 0), and (2) they display a measur-
able affinity and specificity for the transported solute. Consequently, facilitated dif-
fusion rates display saturation behavior similar to that observed with substrate
binding by enzymes (see Chapter 13). Such behavior provides a simple means for
distinguishing between passive diffusion and facilitated diffusion experimentally.
[C
2
]
ᎏ
[C
1
]
[C
2
]
ᎏ
[C
1
]
Side 1 Side 2
Membrane
⌬G = RT ln
[C
2
]
[C
1
]
Concentration C
1
Concentration C
2
ACTIVE FIGURE 9.37 Passive diffusion
of an uncharged species across a membrane depends
only on the concentrations (C
1
and C
2
) on the two sides
of the membrane. Test yourself on the concepts in
this figure at www.cengage.com/login.
Side 1
Side 2
+
+
+
+
+
+
+
+
+
+
+
−
Membrane
⌿
2
− ⌿
1
= ⌬⌿ > 0
Z = −1
Z ⌬⌿ < 0
ACTIVE FIGURE 9.38 The passive diffu-
sion of a charged species across a membrane depends
on the concentration and also on the charge of the par-
ticle, Z, and the electrical potential difference across the
membrane, ⌬. Test yourself on the concepts in this
figure at www.cengage.com/login.
272 Chapter 9 Membranes and Membrane Transport
The dependence of transport rate on solute concentration takes the form of a rec-
tangular hyperbola (Figure 9.39), so the transport rate approaches a limiting value,
V
max
, at very high solute concentration. Figure 9.39 also shows the graphical behav-
ior exhibited by simple passive diffusion. Because passive diffusion does not involve
formation of a specific soluteϺprotein complex, the plot of rate versus concentration
is linear, not hyperbolic.
Membrane Channel Proteins Facilitate Diffusion
The structures of hundreds of membrane proteins have been determined by
X-ray diffraction and NMR spectroscopy. Many of these proteins are membrane
transport channels that carry out facilitated diffusion (Figure 9.40). In contrast to
active transport systems (or “pumps”) like Na
ϩ
,K
ϩ
-ATPase and Ca
2ϩ
-ATPase, chan-
nels simply enable the (energetically passive) downhill movement of ions and other
molecules. However, active pumps and most channels share one fundamental prop-
erty: an ability to transport species in a selective manner. Molecular selectivity is cru-
cial to the operation of both pumps and channels.
The membrane channel structures determined to date have revealed some of
nature’s strategies for moving ions and molecules across biological membranes.
Channel composition can take several forms. A single channel pore can be
formed from dimers, trimers, tetramers, or pentamers of protein subunits (for ex-
ample, channels for Na
ϩ
, K
ϩ
, Mg
2ϩ
, and glutamate; see Table 9.3). On the other
hand, multimeric assemblies in which each subunit has its own pore are known
(in channels for Cl
Ϫ
, NH
3
, water, and glycerol). Figure 9.40 presents several of the
known channel structures, including channels for K
ϩ
, Cl
Ϫ
, NH
3
, H
2
O, glycerol,
glutamate, and proteins themselves. Several recurring themes are apparent from
these structures:
• Each of these channels possesses a selectivity filter—a group of amino acid
residues that selects for and binds the transported species as a prelude to transport.
• In several of these channels (for example, the K
ϩ
and glutamate channels, as well
as the Na
ϩ
channel from B. cereus), the protein creates an aqueous cavity or
vestibule (sometimes reaching more than halfway across the bilayer) so that the
transported species can reach the selectivity filter deep in the membrane by sim-
ple diffusion.
• Other channels do not possess large aqueous vestibules. The chloride, water,
glycerol, and ammonia channels employ “funnels” on either side of the mem-
brane. These funnels lead to narrow constrictions—the selectivity filters—at the
middle of the bilayer. When viewed parallel to the membrane, the two funnels
are seen to be related by a pseudo-twofold axis of symmetry.
• Selectivity filters often consist of a channel that binds multiple transported
species. Thus, the chloride channel binds two Cl
Ϫ
ions, the ammonia channel
binds three ammonia molecules, and the potassium channel binds four K
+
ions.
• Most membrane channels are “gated”—that is, in response to a triggering signal,
they undergo a conformational change that opens the channel. Gating may be
signaled by binding of an ion, a small organic molecule, or even a protein. Some
channels are voltage-gated and open and close in response to a change of mem-
brane electrical potential (that is, voltage). The conformation change that gates
a channel can be a substantial rearrangement of the protein structure or merely
a movement of a single residue.
These recurring themes are illustrated particularly well by the K
+
channels charac-
terized by Roderick MacKinnon and his colleagues.
Potassium Channels Combine High Selectivity with High Conduction Rates
Potassium transport (that is, conduction) is essential for many cell processes, in-
cluding regulation of cell volume, electrical impulse formation (in electrically ex-
citable cells, such as neurons), and secretion of hormones; all cells thus conduct K
ϩ
υ
Facilitated
diffusion
Passive
diffusion
[S]
Facilitated
diffusion
Lineweaver–Burk
Hanes–Woolf
Passive
diffusion
Passive
diffusion
Facilitated
diffusion
[S]
[S]
1
υ
1
υ
S
FIGURE 9.39 Passive diffusion and facilitated diffusion
may be distinguished graphically. The plots for facili-
tated diffusion are similar to plots of enzyme-catalyzed
processes (see Chapter 13), and they display saturation
behavior.