Biochemistry, 4th Edition P58 ppsx
Bạn đang xem bản rút gọn của tài liệu. Xem và tải ngay bản đầy đủ của tài liệu tại đây (671.57 KB, 10 trang )
Further Reading 533
tial end products are provided. Then the biochemical consequences of
the mutation can be investigated.
17.5 What Can the Metabolome Tell Us about a Biological System?
Rapid advances in chemical analysis have made it possible to carry out
comprehensive studies of the many metabolites in a living organism. The
metabolome is the complete set of low-molecular-weight molecules
present in an organism or excreted by it under a given set of physiologi-
cal conditions. Metabolomics is the systematic identification and quanti-
tation of all these metabolites in a given organism or sample. Mass spec-
trometry offers unmatched sensitivity for detection of metabolites at very
low concentrations, whereas NMR spectroscopy can provide remarkable
resolution and discrimination of metabolites in complex mixtures.
17.6 What Food Substances Form the Basis of Human Nutrition? In
addition to essential fiber, the food that human beings require in-
cludes the macronutrients—protein, carbohydrate, and lipid—and
the micronutrients—including vitamins and minerals.
PROBLEMS
Preparing for an exam? Create your own study path for this
chapter at www.cengage.com/login.
1. If 3 ϫ 10
14
kg of CO
2
are cycled through the biosphere annually, how
many human equivalents (70-kg people composed of 18% carbon by
weight) could be produced each year from this amount of CO
2
?
2. Define the differences in carbon and energy metabolism between
photoautotrophs and photoheterotrophs and between chemoautotrophs and
chemoheterotrophs.
3. Name three principal inorganic sources of oxygen atoms that are
commonly available in the inanimate environment and readily
accessible to the biosphere.
4. What are the features that generally distinguish pathways of catabo-
lism from pathways of anabolism?
5. Name the three principal modes of enzyme organization in meta-
bolic pathways.
6. Why is the pathway for the biosynthesis of a biomolecule at least
partially different from the pathway for its catabolism? Why is the
pathway for the biosynthesis of a biomolecule inherently more com-
plex than the pathway for its degradation?
7. (Integrates with Chapters 1 and 3.) What are the metabolic roles of
ATP, NAD
ϩ
, and NADPH?
8. (Integrates with Chapter 15.) Metabolic regulation is achieved via
regulating enzyme activity in three prominent ways: allosteric regu-
lation, covalent modification, and enzyme synthesis and degrada-
tion. Which of these three modes of regulation is likely to be the
quickest; which the slowest? For each of these general enzyme reg-
ulatory mechanisms, cite conditions in which cells might employ
that mode in preference to either of the other two.
9. What are the advantages of compartmentalizing particular meta-
bolic pathways within specific organelles?
10. Name and discuss four challenges associated with metabolomic
measurements in biological systems.
11. Compare and contrast mass spectrometry and NMR in terms of their
potential advantages and disadvantages for metabolomic analysis.
12. What chemical functionality is provided to enzyme reactions by pyri-
doxal phosphate (see Chapter 13)? By coenzyme A (see Chapter
19)? By vitamin B
12
(see Chapter 23)? By thiamine pyrophosphate
(see Chapter 19)?
13. Define the following terms:
a. Genome
b. Transcriptome
c. Proteome
d. Metabolome
14. The alcohol dehydrogenase reaction, described in Figure 17.11, in-
terconverts ethyl alcohol and acetaldehyde and involves hydride
transfer to and from NAD
ϩ
and NADH, respectively. Write a rea-
sonable mechanism for the conversion of ethanol to acetaldehyde
by alcohol dehydrogenase.
15. For each of the following metabolic pathways, describe where in the
cell it occurs and identify the starting material and end product(s):
a. Citric acid cycle
b. Glycolysis
c. Oxidative phosphorylation
d. Fatty acid synthesis
16. Many solutions to the problem of global warming have been pro-
posed. One of these involves strategies for carbon sequestration—
the removal of CO
2
from the earth’s atmosphere by various means.
From your reading of this chapter, suggest and evaluate a strategy
for carbon sequestration in the ocean.
17. Consult Table 17.4, and consider the information presented for
32
P
and
35
S. Write reactions for the decay events for these two isotopes,
indicating clearly the products of the decays, and calculate what
percentage of each would remain from a sample that contained
both and decayed for 100 days.
Preparing for the MCAT Exam
18. Which statement is most likely to be true concerning obligate
anaerobes?
a. These organisms can use oxygen if it is present in their envi-
ronment.
b. These organisms cannot use oxygen as their final electron
acceptor.
c. These organisms carry out fermentation for at least 50% of their
ATP production.
d. Most of these organisms are vegetative fungi.
19. Foods rich in fiber are basically plant materials high in cellulose, a
cell wall polysaccharide that we cannot digest. The nutritional ben-
efits provided by such foods result from
a. other nutrients present that can be digested and absorbed.
b. macromolecules (like cellulose) that are absorbed without diges-
tion and then catabolized inside the cells.
c. microbes that are the normal symbionts of plant tissues.
d. All of the above.
FURTHER READING
Metabolism
Atkinson, D. E., 1977. Cellular Energy Metabolism and Its Regulation. New
York, Academic Press.
Chatterjee, R., and Yuan, L., 2006. Directed evolution of metabolic path-
ways. Trends in Biotechnology 24(1):28–38.
Frayn, K., 2003. Metabolic Regulation. New York: Wiley.
Gerrard, J. A., Sparrow, A. D., et al., 2001. Metabolic databases: What
next? Trends in Biochemical Sciences 26(2):137–140.
Gropper, S., and Smith, J. L., 2008. Advanced Nutrition and Human Me-
tabolism. Belmont, CA: Wadsworth Publishing.
Hosler, J. P., Ferguson-Miller, S., et al., 2006. Energy transduction: Pro-
ton transfer through the respiratory complexes. Annual Review of
Biochemistry 75:165–187.
Metzger, R. P., 2006. Thoughts on the teaching of metabolism. Biochem-
istry and Molecular Biology Education 34(2):78–87.
534 Chapter 17 Metabolism: An Overview
Nicholls, D. G., and Ferguson, S. J., 2007. Bioenergetics 3. New York: Aca-
demic Press.
Nicholson, D. E., 2003. Metabolic Pathways, 22nd ed. St. Louis: Sigma-
Aldrich.
Nicholson, D. E., 2005. From metabolic pathways charts to animaps in
50 years. Biochemistry and Molecular Biology Education 33:156–158.
Smith, E. and Morowitz, H. J., 2004. Universality in intermediary me-
tabolism. Proceedings of the National Academy of Sciences U.S.A.
101:13168–13173.
Teichmann, S. A., Rison, S. C. G., et al., 2001. Small-molecule metabo-
lism: An enzyme mosaic. Trends in Biotechnology 19:482–486.
Tu, B. P., and McKnight, S. L., 2006. Metabolic cycles as an underlying
basis of biological oscillations. Nature Reviews Molecular Cell Biology
7:696–701.
Metabolomics and Metabonomics
Beckonert, O., Keun, H. C., et al., 2007. Metabolic profiling, metabo-
lomic and metabonomic procedures for NMR spectroscopy of
urine, plasma, serum, and tissue extracts. Nature Protocols 2:
2692–2703.
Breitling, R., Pitt, A. R., et al., 2006. Precision mapping of the metabo-
lome. Trends in Biotechnology 24:543–548.
Clayton, T. A., Lindon, J. C., et al., 2006. Pharmaco-metabonomic phe-
notyping and personalized drug treatment. Nature 440:1073–1077.
Costello, L. C., and Franklin, R. B., 2006. Tumor cell metabolism: The
marriage of molecular genetics and proteomics with cellular inter-
mediary metabolism; proceed with caution! Molecular Cancer 5:1–5.
Feala, J. D., Coquin, L., et al., 2007. Integrating metabolomics and phe-
nomics with systems models of cardiac hypoxia. Progress in Biophysics
and Molecular Biology 96:209–225.
Fiehn, O., 2002. Metabolomics: The link between genotypes and phe-
notypes. Plant Molecular Biology 48:155–171.
Griffen, J. L., 2006. The Cinderella story of metabolic profiling: Does
metabolomics get to go to the functional g
enomics ball? Philosophi-
cal Transactions of the Royal Society B 361:147–161.
Idle, J. R., and Gonzalez, F. J., 2007. Metabolomics. Cell Metabolism
6:348–351.
Kell, D. B., 2004. Metabolomics and systems biology: Making sense of
the soup. Current Opinion in Microbiology 7:296–307.
Lane, A. N., Fan, T. W-M., et al., 2008. Isotopomer-based metabolomic
analysis by NMR and mass spectrometry. Methods in Cell Biology 84:
541–588.
Lewis, I. A., Schommer, S. C., et al., 2007. Method for determining
molar concentrations of metabolites in complex solutions from two-
dimensional
1
H-
13
C NMR spectra. Analytical Chemistry 79:9385–9390.
Pan, Z., and Raftery, D., 2007. Comparing and combining NMR spec-
troscopy and mass spectrometry in metabolomics. Analytical Bio-
chemistry and Chemistry 387:525–527.
Parsons, H. M., Ludwig, C., et al., 2007. Improved classification accuracy
in 1- and 2-dimensional NMR metabolomics data using the variance
stabilising generalised logarithm transformation. BMC Bioinformat-
ics 8:1–16.
Pearson, H., 2007. Meet the human metabolome. Nature 446:8.
Wu, H., Southam, A. D., et al., 2007. High-throughput tissue extraction
protocol for NMR- and MS-based metabolomics. Analytical Biochem-
istry 372:204–212.
Systems Biology
Doolittle, R. F., 2005. Evolutionary aspects of whole-genome biology.
Current Opinion in Structural Biology 15:248–253.
Kell, D. B., Brown, M., et al., 2005. Metabolic footprinting and systems
biology: The medium is the message. Nature Reviews Microbiology
3:557–565.
Vitamins
Abelson, J. N., Simon, M. I., et al., 1997. Vitamins and Coenzymes, Part I.
New York: Academic Press.
Dennis, E. A., Simon, M. I., et al., 1997. Vitamins and Coenzymes, Part L.
New York: Academic Press.
© Arthur Beck/CORBIS
18
Glycolysis
18.1 What Are the Essential Features of Glycolysis?
In the glycolysis pathway (Figure 18.1), a molecule of glucose is converted in 10
enzyme-catalyzed steps to two molecules of 3-carbon pyruvate. Most of the details of
this pathway (the first metabolic pathway to be elucidated) were worked out in the
first half of the 20th century by the German biochemists Otto Warburg, G. Embden,
and O. Meyerhof. In fact, the sequence of reactions in Figure 18.1 is often referred
to as the Embden–Meyerhof pathway.
Why is glycolysis so important to organisms? There are several reasons. For
some tissues (such as brain, kidney medulla, and rapidly contracting skeletal
muscles) and for some cells (such as erythrocytes and sperm cells), glucose is
the only source of metabolic energy. In addition, the product of glycolysis—
pyruvate—is a versatile metabolite that can be used in several ways. In most tis-
sues, when oxygen is plentiful (aerobic conditions), pyruvate is oxidized (with
loss of the carboxyl group as CO
2
), and the remaining two-carbon unit becomes
the acetyl group of acetyl-coenzyme A (acetyl-CoA) (Figure 18.2). This acetyl
group is metabolized in the tricarboxylic acid (TCA) cycle (and fully oxidized)
to yield CO
2
(see Chapter 19).
Alternatively, in the absence of oxygen (anaerobic conditions), pyruvate can be
reduced to lactate through oxidation of NADH to NAD
ϩ
—a process termed lactic
acid fermentation. In microorganisms such as brewer’s yeast, and in certain plant
tissues, pyruvate can be reduced to ethanol, again with oxidation of NADH to
NAD
ϩ
. Most students will recognize this process as alcoholic fermentation.
Glycolysis consists of two phases. In the first phase, a series of five reactions, glu-
cose is broken down to two molecules of glyceraldehyde-3-phosphate. In the sec-
ond phase, five subsequent reactions convert these two molecules of glyceralde-
hyde-3-phosphate into two molecules of pyruvate. Phase 1 consumes two molecules
of ATP (Figure 18.1). The later stages of glycolysis result in the production of four
molecules of ATP. The net is 4 Ϫ 2 ϭ 2 molecules of ATP produced per molecule
of glucose. Microorganisms, plants, and animals (including humans) carry out the
10 reactions of glycolysis in more or less similar fashion, although the rates of the in-
dividual reactions and the means by which they are regulated differ from species to
species.
Louis Pasteur’s scientific investigations into fermen-
tation of grape sugar were pioneering studies of
glycolysis.
Living organisms, like machines, conform to the
law of conservation of energy, and must pay
for all their activities in the currency of
catabolism.
Ernest Baldwin
Dynamic Aspects of Biochemistry (1952)
KEY QUESTIONS
18.1 What Are the Essential Features of
Glycolysis?
18.2 Why Are Coupled Reactions Important
in Glycolysis?
18.3 What Are the Chemical Principles and
Features of the First Phase of Glycolysis?
18.4 What Are the Chemical Principles and
Features of the Second Phase of Glycolysis?
18.5 What Are the Metabolic Fates of NADH
and Pyruvate Produced in Glycolysis?
18.6 How Do Cells Regulate Glycolysis?
18.7 Are Substrates Other Than Glucose Used
in Glycolysis?
18.8 How Do Cells Respond to Hypoxic Stress?
ESSENTIAL QUESTION
Nearly every living cell carries out a catabolic process known as glycolysis—the
stepwise degradation of glucose (and other simple sugars). Glycolysis is a paradigm
of metabolic pathways. Carried out in the cytosol of cells, it is basically an anaerobic
process; its principal steps occur with no requirement for oxygen. Living things first
appeared in an environment lacking O
2
, and glycolysis was an early and important
pathway for extracting energy from nutrient molecules. It played a central role in
anaerobic metabolic processes during the first 2 billion years of biological evolution
on earth. Contemporary organisms still employ glycolysis to provide precursor mol-
ecules for aerobic catabolic pathways (such as the tricarboxylic acid cycle) and as a
short-term energy source when oxygen is limiting.
What are the chemical basis and logic for this central pathway of metabolism;
that is, how does glycolysis work?
Create your own study path for
this chapter with tutorials, simulations, animations,
and Active Figures at www.cengage.com/login.
536 Chapter 18 Glycolysis
2 NADH + 2 H
+
2 NAD
+
2 P
i
C OH
C OPO
3
2
–
H2
CH
2
OPO
3
2
–
Two Glyceraldehyde-3-phosphates
O
HCOH2
COO
–
CH
2
OPO
3
2
–
HCOPO
3
2
–
2
COO
–
CH
2
OH
2 C
COO
–
O
CH
2
COO
–
2
C O
CH
3
PO
3
2
–
Phosphoenolpyruvate
(PEP)
Pyruvate
K
+
,Mg
2+
K
+
,Mg
2+
2 ADP
2 ATP
O
CH
2
OPO
3
2
–
H
HO OH
H
OH
H
H
OH
OC
CH
2
OH
D-Glucose-6-
phosphate (G-6-P)
D-Fructose-6-
phosphate (F-6-P)
D-Fructose-1,6-
bisphosphate (FBP)
D-Glyceraldehyde-
3-phosphate (G-3-P)
1,3-Bisphosphoglycerate
(BPG)
Dihydroxyacetone
phosphate (DHAP)
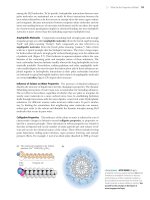
Phase 2
Phosphorylation of glucose and conversion to 2 molecules of
glyceraldehyde-3-phosphate; 2 ATPs are used to prime these reactions.
Conversion of glyceraldehyde-3-phosphate to pyruvate and
coupled formation of 4 ATP and 2 NADH.
Phase 1
Phosphoglucoisomerase
Phosphofructokinase
Mg
2+
ATP
ADP
Phosphoglycerate
kinase
Mg
2+
2 ATP
Enolase
Pyruvate kinase
2 ADP
Glyceraldehyde-
3-phosphate
dehydrogenase
O
CH
2
OH
H
H
HO
OH
H
H
OH
HOH
4
32
5
6
D
-Glucose
Mg
2+
ATP
ADP
Hexokinase
glucokinase
Fructose bisphosphate aldolase
Triose
phosphate
isomerase
3-Phosphoglycerate
(3-PG)
Phosphoglycerate
mutase
Mg
2+
2-Phosphoglycerate
(2-PG)
HHO
HOH
H
OH
CH
2
OH
O
HHO
HOH
H
OH
CH
2
OPO
3
2
–
CH
2
OPO
3
2
–
2 H
2
O
O
C
H
COHH
CH
2
OPO
3
2
–
O
2
7
8
3
9
10
4
5
1
6
–
2
O
3
POCH
2
–2
O
3
POCH
2
ACTIVE FIGURE 18.1 The glycolytic pathway. Test yourself on the concepts in this figure
at www.cengage.com/login.
18.3 What Are the Chemical Principles and Features of the First Phase of Glycolysis? 537
18.2 Why Are Coupled Reactions Important in Glycolysis?
The process of glycolysis converts some, but not all, of the metabolic energy of the glu-
cose molecule into ATP. The free energy change for the conversion of glucose to two
molecules of lactate (the anaerobic route in contracting muscle) is Ϫ183.6 kJ/mol:
C
6
H
12
O
6
→ 2 H
3
COCHOHOCOO
Ϫ
ϩ 2 H
ϩ
(18.1)
⌬G°ЈϭϪ183.6 kJ/mol
This process occurs with no net oxidation or reduction. Although several individual
steps in the pathway involve oxidation or reduction, these steps compensate each
other exactly. Thus, the conversion of a molecule of glucose to two molecules of lac-
tate involves simply a rearrangement of bonds, with no net loss or gain of electrons.
The energy made available through this rearrangement is a relatively small part of
the total energy obtainable from glucose.
The production of two molecules of ATP in glycolysis is an energy-requiring process:
2 ADP ϩ 2 P
i
⎯⎯→2 ATP ϩ 2 H
2
O (18.2)
⌬G°Јϭ2 ϫ 30.5 kJ/mol ϭ 61.0 kJ/mol
Glycolysis couples these two reactions:
Glucose ϩ 2 ADP ϩ 2 P
i
→ 2 lactate ϩ 2 ATP ϩ 2 H
ϩ
ϩ 2 H
2
O (18.3)
⌬G°ЈϭϪ183.6 ϩ 61 ϭϪ122.6 kJ/mol
Thus, under standard-state conditions, (61/183.6) ϫ 100%, or 33%, of the free en-
ergy released is preserved in the form of ATP in these reactions. However, as we dis-
cussed in Chapter 3, the various solution conditions, such as pH, concentration,
ionic strength, and presence of metal ions, can substantially alter the free energy
change for such reactions. Under actual cellular conditions, the free energy change
for the synthesis of ATP (Equation 18.2) is much larger, and approximately 50% of
the available free energy is converted into ATP. Clearly, then, more than enough
free energy is available in the conversion of glucose into lactate to drive the synthe-
sis of two molecules of ATP.
18.3 What Are the Chemical Principles and Features
of the First Phase of Glycolysis?
In the first phase of glycolysis, glucose will be phosphorylated at C-1 and C-6, and
the six-carbon skeleton of glucose will be cleaved to yield two three-carbon mole-
cules of glyceraldehyde-3-phosphate. Phosphorylation and cleavage reorganize the
2 Pyruvate
Anaerobic
conditions
Lactic acid fermentation
in contracting muscle
2 Lactate
2 NADH
2 NAD
+
Anaerobic
conditions
Alcoholic fermentation
in yeast
2 NADH
2 NAD
+
Aerobic
conditions
2 Acetyl-CoA
TCA
cycle
4 CO
2
4 H
2
O
+
Animals and plants
in aerobic conditions
2 CoASH
2 CO
2
2 NADH
2 NAD
+
2 Ethanol
2 CO
2
+
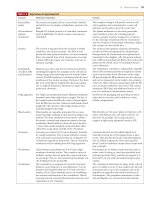
FIGURE 18.2 Pyruvate produced in glycolysis can be
utilized by cells in several ways. In animals, pyruvate is
normally converted to acetyl-coenzyme A, which is then
oxidized in the TCA cycle to produce CO
2
.When oxygen
is limited, pyruvate can be converted to lactate.
Alcoholic fermentation in yeast converts pyruvate to
ethanol and CO
2
.
538 Chapter 18 Glycolysis
glucose molecule so that molecules of ATP can be produced in the second phase of
glycolysis.
Reaction 1: Glucose Is Phosphorylated by Hexokinase
or Glucokinase—The First Priming Reaction
The initial reaction of the glycolysis pathway involves phosphorylation of glucose at
carbon atom 6 by either hexokinase or glucokinase. (Recall that “kinases” are en-
zymes that transfer the ␥-phosphate of ATP to nucleophilic acceptors.) Phosphory-
lation activates glucose for the following reactions in the pathway. However, the for-
mation of such a phosphoester is thermodynamically unfavorable and requires
energy input to operate in the forward direction (see Chapter 3). The energy comes
from ATP, a requirement that at first seems counterproductive. Glycolysis is de-
signed to make ATP, not consume it. However, the hexokinase or glucokinase reac-
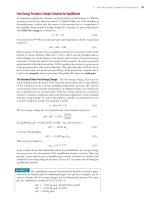
tion (Figure 18.1) is one of two priming reactions in the pathway. Just as old-
fashioned, hand-operated water pumps (Figure 18.3) have to be primed with a
small amount of water to deliver more water to the thirsty pumper, the glycolysis
pathway requires two priming ATP molecules to start the sequence of reactions and
delivers four molecules of ATP in the end.
The complete reaction for the first step in glycolysis is
␣-
D-Glucose ϩ ATP
4Ϫ
⎯⎯→␣-D-glucose-6-phosphate
2Ϫ
ϩ ADP
3Ϫ
ϩ H
ϩ
(18.4)
⌬G°ЈϭϪ16.7 kJ/mol
The hydrolysis of ATP makes 30.5 kJ/mol available in this reaction, and the phos-
phorylation of glucose “costs” 13.8 kJ/mol (Table 8.1). Thus, the reaction liberates
16.7 kJ/mol under standard-state conditions (1 M concentrations), and the equilib-
rium of the reaction lies far to the right (K
eq
ϭ 850 at 25°C; see Table 18.1). Under
cellular conditions (Table 18.2), this first reaction of glycolysis is even more favor-
able than at standard state, with a ⌬G of Ϫ33.9 kJ/mol (see Table 18.1).
FIGURE 18.3 Just as a water pump must be “primed”
with water to get more water out, the glycolytic pathway
is primed with ATP in steps 1 and 3 in order to achieve
net production of ATP in the second phase of the
pathway.
© Jonny Kristoffersson/iStockphoto.com
⌬G°Ј K
eq
⌬G
Reaction Enzyme (kJ/mol) at 25°C (kJ/mol)
␣-D-Glucose ϩ ATP
4Ϫ
34
Hexokinase
Ϫ16.7 850 Ϫ33.9*
glucose-6-phosphate
2Ϫ
ϩ ADP
3Ϫ
ϩ H
ϩ
Glucokinase
Glucose-6-phosphate
2Ϫ
34
fructose-6-phosphate
2Ϫ
Phosphoglucoisomerase ϩ1.67 0.51 Ϫ2.92
Fructose-6-phosphate
2Ϫ
ϩ ATP
4Ϫ
34
Phosphofructokinase Ϫ14.2 310 Ϫ18.8
fructose-1,6-bisphosphate
4Ϫ
ϩ ADP
3Ϫ
ϩ H
ϩ
Fructose-1,6-bisphosphate
4Ϫ
34
Fructose bisphosphate ϩ23.9 6.43 ϫ 10
Ϫ5
Ϫ0.23
dihydroxyacetone-P
2Ϫ
ϩ glyceraldehyde-3-P
2Ϫ
aldolase
Dihydroxyacetone-P
2Ϫ
34
glyceraldehyde-3-P
2Ϫ
Triose phosphate isomerase ϩ7.56 0.0472 ϩ2.41
Glyceraldehyde-3-P
2Ϫ
ϩ P
i
2Ϫ
ϩ NAD
ϩ
34
Glyceraldehyde-3-P ϩ6.30 0.0786 Ϫ1.29
1,3-bisphosphoglycerate
4Ϫ
ϩ NADH ϩ H
ϩ
dehydrogenase
1,3-Bisphosphoglycerate
4Ϫ
ϩ ADP
3Ϫ
34
Phosphoglycerate kinase Ϫ18.9 2060 ϩ0.1
3-P-glycerate
3Ϫ
ϩ ATP
4Ϫ
3-Phosphoglycerate
3Ϫ
34
2-phosphoglycerate
3Ϫ
Phosphoglycerate mutase ϩ4.4 0.169 ϩ0.83
2-Phosphoglycerate
3Ϫ
34
Enolase ϩ1.8 0.483 ϩ1.1
phosphoenolpyruvate
3Ϫ
ϩ H
2
O
Phosphoenolpyruvate
3Ϫ
ϩ ADP
3Ϫ
ϩ H
ϩ
34
Pyruvate kinase Ϫ31.7 3.63 ϫ 10
5
Ϫ23.0
pyruvate
Ϫ
ϩ ATP
4Ϫ
Pyruvate
Ϫ
ϩ NADH ϩ H
ϩ
34
lactate
Ϫ
ϩ NAD
ϩ
Lactate dehydrogenase Ϫ25.2 2.63 ϫ 10
4
Ϫ14.8
*⌬G values calculated for 310K (37°C) using the data in Table 18.2 for metabolite concentrations in erythrocytes. ⌬G°Ј values are assumed to be the same at 25° and 37°C.
TABLE 18.1
Reactions and Thermodynamics of Glycolysis
18.3 What Are the Chemical Principles and Features of the First Phase of Glycolysis? 539
The Cellular Advantages of Phosphorylating Glucose The incorporation of a phos-
phate into glucose in this energetically favorable reaction is important for several rea-
sons. First, phosphorylation keeps the substrate in the cell. Glucose is a neutral mole-
cule and could diffuse across the cell membrane, but phosphorylation confers a
negative charge on glucose and the plasma membrane is essentially impermeable to
glucose-6-phosphate (Figure 18.4). Moreover, rapid conversion of glucose to glucose-
6-phosphate keeps the intracellular concentration of glucose low, favoring faciliated dif-
fusion of glucose into the cell. In addition, because regulatory control can be imposed
only on reactions not at equilibrium, the favorable thermodynamics of this first reac-
tion makes it an important site for regulation.
The Isozymes of Hexokinase In most animal, plant, and microbial cells, the enzyme
that phosphorylates glucose is hexokinase. Magnesium ion (Mg
2ϩ
) is required for this
reaction, as for the other kinase enzymes in the glycolytic pathway. The true substrate
for the hexokinase reaction is MgATP
2Ϫ
. There are four isozymes of hexokinase in
most animal tissues. Hexokinase I is the principal form in the brain. Hexokinase in
skeletal muscle is a mixture of types I (70% to 75%) and II (25% to 30%). The K
m
for glucose is 0.03 mM for type I and 0.3 mM for type II; thus, hexokinase operates
efficiently at normal blood glucose levels of 4 mM or so. The animal isozymes are
allosterically inhibited by the product, glucose-6-phosphate. High levels of glucose-6-
phosphate inhibit hexokinase activity until consumption by glycolysis lowers its con-
centration. The hexokinase reaction is one of three points in the glycolysis pathway
that are regulated. As the generic name implies, hexokinase can phosphorylate a vari-
ety of hexose sugars, including glucose, mannose, and fructose.
The type IV isozyme of hexokinase, called glucokinase, is found predominantly
in the liver and pancreas. Type IV is highly specific for D-glucose, has a much higher
K
m
for glucose (approximately 10 mM), and is not product inhibited. With such a
high K
m
for glucose, glucokinase becomes important metabolically only when liver
glucose levels are high (for example, when the individual has consumed large
amounts of carbohydrates). When glucose levels are low, hexokinase is primarily
responsible for phosphorylating glucose. However, when glucose levels are high, glu-
cose is converted by glucokinase to glucose-6-phosphate and is eventually stored in
the liver as glycogen. Glucokinase is an inducible enzyme—the amount present in the
liver is controlled by insulin (secreted by the pancreas). (Patients with diabetes melli-
tus produce insufficient insulin. They have low levels of glucokinase, cannot tolerate
high levels of blood glucose, and produce little liver glycogen.) Because glucose-6-
phosphate is common to several metabolic pathways (Figure 18.5), it occupies a
branch point in glucose metabolism.
Metabolite mM
Glucose 5.0
Glucose-6-phosphate 0.083
Fructose-6-phosphate 0.014
Fructose-1,6-bisphosphate 0.031
Dihydroxyacetone phosphate 0.14
Glyceraldehyde-3-phosphate 0.019
1,3-Bisphosphoglycerate 0.001
2,3-Bisphosphoglycerate 4.0
3-Phosphoglycerate 0.12
2-Phosphoglycerate 0.030
Phosphoenolpyruvate 0.023
Pyruvate 0.051
Lactate 2.9
ATP 1.85
ADP 0.14
P
i
1.0
Adapted from Minakami, S., and Yoshikawa, H., 1965.Thermo-
dynamic considerations on erythrocyte glycolysis.Biochemi-
cal and Biophysical Research Communications 18:345.
TABLE 18.2
Steady-State Concentrations
of Glycolytic Metabolites
in Erythrocytes
Glucose is kept in the cell
by phosphorylation to G-6-P,
which cannot easily cross
the plasma membrane
Extracellular
fluid
Glucose
Cytoplasm
Glucose
Glucose-
6-phosphate
ADP
ATP
ANIMATED FIGURE 18.4 Phosphorylation of glucose to glucose-6-phosphate by ATP
creates a charged molecule that cannot easily cross the plasma membrane. See this figure animated at
www.cengage.com/login.
540 Chapter 18 Glycolysis
Hexokinase Binds Glucose and ATP with an Induced Fit In most organisms, hex-
okinase occurs in a single form: a two-lobed 50-kD monomer that resembles a
clamp, with a large groove in one side (Figure 18.6; see also Figure 13.24). Daniel
Koshland predicted, years before structures were available, that hexokinase would
undergo an induced fit (see Chapter 13), closing around the substrates ATP and
glucose when they were bound. Koshland’s prediction was confirmed when struc-
tures of the yeast enzyme were determined in the absence and presence of glucose
(Figure 18.6).
The human hexokinase isozymes I, II, and III are twice as big as those of lower
organisms. They are composed of two separate domains, each similar to the yeast
enzyme, and connected head to tail by a long ␣-helix (Figure 18.7). The sequence
Glucose
Glucose-6-phosphate
Fructose-6-phosphate
Glycolysis continues
Glucose-1-
phosphate
Pentose
phosphate
pathway
Glucosamine-
6-phosphate
Synthesis of
NADPH and
4-C, 5-C, and
7-C sugars
Glycogen
Glucuronate
Energy
storage in
liver and
muscles
Carbohydrate
synthesis
FIGURE 18.5 Glucose-6-phosphate is the branch point for several metabolic pathways.
Glucose
(a)
(b)
FIGURE 18.6 The (a) open and (b) closed states of yeast
hexokinase. Binding of glucose (green) induces a con-
formation change that closes the active site, as predict-
ed by Koshland (a: pdb id ϭ 1IG8; b:pdb id ϭ 1BDG).
(a) (b)
Glucose
FIGURE 18.7 (a) Mammalian hexokinase I contains an
N-terminal domain (top) and a C-terminal domain (bottom)
joined by a long ␣-helix. Each of these domains is similar in
sequence and structure to yeast hexokinase (pdb id ϭ 1CZA).
(b) Human glucokinase undergoes an induced fit upon
binding glucose (green). (Top: pdb id ϭ 1V4T; bottom: pdb
id ϭ 1V4S).
18.3 What Are the Chemical Principles and Features of the First Phase of Glycolysis? 541
and structure similarity apparently arose from the duplication and fusion of a pri-
mordial hexokinase gene. Interestingly, both halves of hexokinase II support catal-
ysis, but only the C-terminal half of isozymes I and III performs phosphorylation of
glucose. The N-terminal half, on the other hand, has apparently evolved into a form
that allosterically regulates the activity of the C-terminal half! Type IV hexokinase
(glucokinase) is similar in structure to the yeast enzyme, with a single clamp do-
main, a single active site, and a mass of 50 kD (Figure 18.7).
Reaction 2: Phosphoglucoisomerase Catalyzes the Isomerization
of Glucose-6-Phosphate
The second step in glycolysis is a common type of metabolic reaction: the isomer-
ization of a sugar. In this particular case, the carbonyl oxygen of glucose-6-phosphate
is shifted from C-1 to C-2. This amounts to isomerization of an aldose (glucose-6-
phosphate) to a ketose—fructose-6-phosphate (Figure 18.8). The reaction is neces-
sary for two reasons. First, the next step in glycolysis is phosphorylation at C-1, and the
hemiacetal OOH of glucose, would be more difficult to phosphorylate than a simple
primary hydroxyl. Second, the isomerization to fructose (with a carbonyl group at
position 2 in the linear form) activates C-3, facilitating C-C bond cleavage in the
fourth step of glycolysis. The enzyme responsible for this isomerization is phospho-
glucoisomerase, also known as phosphoglucose isomerase and glucose phosphate
isomerase. In humans, the enzyme requires Mg
2ϩ
for activity and is highly specific
for glucose-6-phosphate. The ⌬G°Ј is 1.67 kJ/mol, and the value of ⌬G under cellu-
lar conditions (Table 18.1) is Ϫ2.92 kJ/mol. This small value means that the reaction
operates near equilibrium in the cell and is readily reversible. Phosphoglucoiso-
merase proceeds through an enediol intermediate, as shown in Figure 18.8. Although
the predominant forms of glucose-6-phosphate and fructose-6-phosphate in solution
are the ring forms, the isomerase interconverts the open-chain form of G-6-P with
the open-chain form of F-6-P.
Phosphoglucoisomerase, with fructose-6-P (blue) bound
(pdb id ϭ 1HOX).
OH
OH
HO
O
O
H
OH H
OH
HO
OH
H
C
HO
H
H
H B
OH
O
HO
OH
H
CH
2
OPO
3
2
–
OH
CH
2
OPO
3
2
–
OH
–
2
O
3
POH
2
C
OH
CH
2
OH
.
.
H
H
H
H
B
.
.
OH
B
.
.
CH
2
OPO
3
2
–
H
H
H
H
C
B
.
.
H B
+
+
+
+
B
.
.
H
C
OH
Enediol
intermediate
H
.
.
H
OH
H
C
HO
H
B
CH
2
OPO
3
2
–
OH
H
H
.
.
O
B
.
.
CH
2
OH
E
E
E
E
E
E
E
E
1
3
2
ACTIVE FIGURE 18.8 The phosphoglucoiso-
merase mechanism involves opening of the pyranose ring (step 1),
proton abstraction leading to enediol formation (step 2), and pro-
ton addition to the double bond, followed by ring closure (step 3).
Test yourself on the concepts in this figure at www.cengage
.com/login.
542 Chapter 18 Glycolysis
Reaction 3: ATP Drives a Second Phosphorylation
by Phosphofructokinase—The Second Priming Reaction
The action of phosphoglucoisomerase, “moving” the carbonyl group from C-1 to C-2,
creates a new primary alcohol function at C-1 (see Figure 18.8). The next step in the
glycolytic pathway is the phosphorylation of this group by phosphofructokinase.
Once again, the substrate that provides the phosphoryl group is ATP. Like the hexo-
kinase/glucokinase reaction, the phosphorylation of fructose-6-phosphate is a prim-
ing reaction and is endergonic:
Fructose-6-P ϩ P
i
⎯⎯→fructose-1,6-bisphosphate (18.5)
⌬G°Јϭ16.3 kJ/mol
When coupled (by phosphofructokinase) with the hydrolysis of ATP, the overall re-
action becomes exergonic:
Fructose-6-P ϩ ATP ⎯⎯→fructose-1,6-bisphosphate ϩ ADP
(18.6)
⌬G°ЈϭϪ14.2 kJ/mol
⌬G (in erythrocytes) ϭϪ18.8 kJ/mol
At pH 7 and 37°C, the phosphofructokinase reaction equilibrium lies far to the
right. Just as the hexokinase reaction commits the cell to taking up glucose, the phos-
phofructokinase reaction commits the cell to metabolizing glucose rather than converting it
to another sugar or storing it. Similarly, just as the large free energy change of the
hexokinase reaction makes it a likely candidate for regulation, so the phosphofruc-
tokinase reaction is an important site of regulation—indeed, the most important
site in the glycolytic pathway.
Regulation of Phosphofructokinase Phosphofructokinase is the “valve” control-
ling the rate of glycolysis. In addition to its role as a substrate, ATP is also an allosteric
inhibitor of this enzyme. Thus, phosphofructokinase has two distinct binding sites
for ATP; a high-affinity substrate site and a low-affinity regulatory site. In the pres-
ence of high ATP concentrations, phosphofructokinase behaves cooperatively, plots
of enzyme activity versus fructose-6-phosphate are sigmoid, and the K
m
for fructose-
6-phosphate is increased (Figure 18.9). Thus, when ATP levels are sufficiently high
in the cytosol, glycolysis “turns off.” Under most cellular conditions, however, the
ATP concentration does not vary over a large range. The ATP concentration in
muscle during vigorous exercise, for example, is only about 10% lower than that
during the resting state. The rate of glycolysis, however, varies much more. A large
range of glycolytic rates cannot be directly accounted for by only a 10% change in
ATP levels.
AMP reverses the inhibition due to ATP, and AMP levels in cells can rise dramat-
ically when ATP levels decrease, due to the action of the enzyme adenylate kinase,
which catalyzes the reaction
ADP ϩ ADP 34 ATP ϩ AMP
with the equilibrium constant:
K
eq
ϭϭ0.44
(18.7)
[ATP][AMP]
ᎏᎏ
[ADP]
2
+
HHO
HOH
H
OH
CH
2
OH
–2
O
3
POCH
2
O
Mg
2+
HHO
HOH
H
OH
CH
2
OPO
3
2
––2
O
3
POCH
2
O
+
ΔG
erythrocyte
= –18.8 kJ/mol
ΔGЊ
'
= –14.2 kJ/mol
ADP
Fructose-6-phosphate
Phosphofructokinase
(PFK)
Fructose-1,6-bisphosphate
ATP
Phosphofructokinase with ADP (in orange) and
fructose-6-phosphate (in red) (pdb id ϭ 4PFK).
Go to CengageNOW and click
CengageInteractive to learn more about the regula-
tion of phosphofructokinase.
Reaction velocity
[Fructose-6-
p
hos
p
hate]
Low [ATP]
High [ATP]
FIGURE 18.9 At high [ATP], phosphofructokinase (PFK)
behaves cooperatively and the plot of enzyme activity
versus [fructose-6-phosphate] is sigmoid.High [ATP] thus
inhibits PFK, decreasing the enzyme’s affinity for fructose-
6-phosphate.