Biochemistry, 4th Edition P64 docx
Bạn đang xem bản rút gọn của tài liệu. Xem và tải ngay bản đầy đủ của tài liệu tại đây (760.32 KB, 10 trang )
20.2 What Are Reduction Potentials, and How Are They Used to Account for Free Energy Changes in Redox Reactions? 593
The smooth outer membrane is about 30% to 40% lipid and 60% to 70% protein
and has a relatively high concentration of phosphatidylinositol. The outer mem-
brane contains significant amounts of porin—a transmembrane protein, rich in
-sheets, that forms large channels across the membrane, permitting free diffusion
of molecules with molecular weights of about 10,000 or less. The outer membrane
plays a prominent role in maintaining the shape of the mitochondrion. The inner
membrane is richly packed with proteins, which account for nearly 80% of its
weight; thus, its density is higher than that of the outer membrane. The fatty acids
of inner membrane lipids are highly unsaturated. Cardiolipin and diphosphatidyl-
glycerol (see Chapter 8) are abundant. The inner membrane lacks cholesterol and
is quite impermeable to molecules and ions. Species that must cross the mitochon-
drial inner membrane—ions, substrates, fatty acids for oxidation, and so on—are
carried by specific transport proteins in the membrane. Notably, the inner mem-
brane is extensively folded (Figure 20.1). The folds, known as cristae, provide the
inner membrane with a large surface area in a small volume. During periods of ac-
tive respiration, the inner membrane appears to shrink significantly, leaving a com-
paratively large intermembrane space.
The Mitochondrial Matrix Contains the Enzymes of the TCA Cycle
The space inside the inner mitochondrial membrane is called the matrix, and it
contains most of the enzymes of the TCA cycle and fatty acid oxidation. (An im-
portant exception, succinate dehydrogenase of the TCA cycle, is located in the in-
ner membrane itself.) In addition, mitochondria contain circular DNA molecules,
along with ribosomes and the enzymes required to synthesize proteins coded within
the mitochondrial genome. Although some of the mitochondrial proteins are made
this way, most are encoded by nuclear DNA and synthesized by cytosolic ribosomes.
20.2 What Are Reduction Potentials, and How Are They Used
to Account for Free Energy Changes in Redox Reactions?
On numerous occasions in earlier chapters, we have stressed that NADH and reduced
flavoproteins ([FADH
2
]) are forms of metabolic energy. These reduced coenzymes
have a strong tendency to be oxidized—that is, to transfer electrons to other species.
(a) (b)
Matrix
Cristae
Intermembrane
space
Inner membrane
Outer membrane
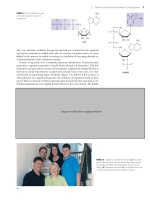
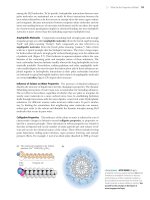
FIGURE 20.1 (a) A drawing of a mitochondrion with components labeled. (b) Tomography of a rat liver mito-
chondrion.The tubular structures in red, yellow, green,purple, and aqua represent individual cristae formed from
the inner mitochondrial membrane. (b, Frey,T. G., and Mannella, C. A.,2000.The internal structure of mitochondria. Trends in
Biochemical Sciences 25:319–324.)
594 Chapter 20 Electron Transport and Oxidative Phosphorylation
Oxidative phosphorylation converts the energy of electron transfer into the energy of
phosphoryl transfer stored in the phosphoric anhydride bonds of ATP. Just as the
group transfer potential was used in Chapter 3 to quantitate the energy of phospho-
ryl transfer, the standard reduction potential, denoted by Ᏹ
o
Ј, quantitates the ten-
dency of chemical species to be reduced or oxidized. The standard reduction poten-
tial difference describing electron transfer between two species,
is related to the free energy change for the process by
⌬G°ЈϭϪnᏲ⌬Ᏹ
o
Ј (20.2)
where n represents the number of electrons transferred; Ᏺ is Faraday’s constant,
96,485 J/V и mol; and ⌬Ᏹ
o
Ј is the difference in reduction potentials between the
donor and acceptor. This relationship is straightforward, but it depends on a stan-
dard of reference by which reduction potentials are defined.
Standard Reduction Potentials Are Measured in Reaction Half-Cells
Standard reduction potentials are determined by measuring the voltages generated
in reaction half-cells (Figure 20.2). A half-cell consists of a solution containing 1 M
concentrations of both the oxidized and reduced forms of the substance whose re-
duction potential is being measured and a simple electrode. (Together, the oxidized
and reduced forms of the substance are referred to as a redox couple.) Such a
sample half-cell is connected to a reference half-cell and electrode via a conductive
bridge (usually a salt-containing agar gel). A sensitive potentiometer (voltmeter) con-
nects the two electrodes so that the electrical potential (voltage) between them can
be measured. The reference half-cell normally contains 1 M H
ϩ
in equilibrium with
H
2
gas at a pressure of 1 atm. The H
ϩ
/H
2
reference half-cell is arbitrarily assigned a
standard reduction potential of 0.0 V. The standard reduction potentials of all other
redox couples are defined relative to the H
ϩ
/H
2
reference half-cell on the basis of the
sign and magnitude of the voltage (electromotive force, emf) registered on the po-
tentiometer (Figure 20.2).
If electron flow between the electrodes is toward the sample half-cell, reduction
occurs spontaneously in the sample half-cell and the reduction potential is said to
be positive. If electron flow between the electrodes is away from the sample half-cell
and toward the reference cell, the reduction potential is said to be negative because
electron loss (oxidation) is occurring in the sample half-cell. Strictly speaking, the
standard reduction potential, Ᏹ
o
Ј, is the electromotive force generated at 25°C and
pH 7.0 by a sample half-cell (containing 1 M concentrations of the oxidized and re-
duced species) with respect to a reference half-cell. (Note that the reduction po-
tential of the hydrogen half-cell is pH-dependent. The standard reduction poten-
tial, 0.0 V, assumes 1 M H
ϩ
. The hydrogen half-cell measured at pH 7.0 has an Ᏹ
o
Ј
of Ϫ0.421 V.)
Two Examples Figure 20.2a shows a sample/reference half-cell pair for measure-
ment of the standard reduction potential of the acetaldehyde/ethanol couple. Be-
cause electrons flow toward the reference half-cell and away from the sample half-cell,
the standard reduction potential is negative, specifically Ϫ0.197 V. In contrast, the
fumarate/succinate couple (Figure 20.2b) causes electrons to flow from the reference
half-cell to the sample half-cell; that is, reduction occurs, and the reduction potential
is thus positive. For each half-cell, a half-cell reaction describes the reaction taking
place. For the fumarate/succinate half-cell coupled to a H
ϩ
/H
2
reference half-cell, the
reaction occurring is indeed a reduction of fumarate:
Fumarate ϩ 2 H
ϩ
ϩ 2 e
Ϫ
⎯⎯→succinate Ᏹ
o
Ј ϭ ϩ0.031 V (20.3)
Reduced donor
Oxidized donor
Oxidized acceptor
Reduced acceptor
ne
Ϫ
Agar
bridge
Electron
flow
Electron
flow
Fumarate
Succinate
Agar
bridge
(a) Ethanol acetaldehyde
Electron
flow
Electron
flow
Potentiometer
–0.197 V
Ethanol
acetaldehyde
H
+
Reference
/1 atm H
2
Sample:
acetaldehyde/
ethanol
H
+
H
2
H
+
Reference
/1 atm H
2
Sample:
fumarate/
succinate
2
H
+
(b) Fumarate succinate
H
2
2
+0.031 V
ACTIVE FIGURE 20.2 Experimental
apparatus used to measure the standard reduction
potential of the indicated redox couples: (a) the
acetaldehyde/ethanol couple, (b) the fumarate/
succinate couple. Test yourself on the concepts in
this figure at www.cengage.com/login.
20.2 What Are Reduction Potentials, and How Are They Used to Account for Free Energy Changes in Redox Reactions? 595
However, the reaction occurring in the acetaldehyde/ethanol half-cell is the oxida-
tion of ethanol:
Ethanol⎯⎯→acetaldehyde ϩ 2 H
ϩ
ϩ 2 e
Ϫ
Ᏹ
o
ЈϭϪ0.197 V (20.4)
Ᏹ
o
Values Can Be Used to Predict the Direction of Redox Reactions
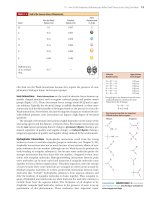
Some typical half-cell reactions and their respective standard reduction potentials are
listed in Table 20.1. Whenever reactions of this type are tabulated, they are uniformly
written as reduction reactions, regardless of what occurs in the given half-cell. The sign
of the standard reduction potential indicates which reaction really occurs when the
given half-cell is combined with the reference hydrogen half-cell. Redox couples that
Reduction Half-Reaction Ᏹ
o
(V)
ᎏ
1
2
ᎏ
O
2
ϩ 2 H
ϩ
ϩ 2 e
Ϫ
88n
H
2
O 0.816
Fe
3ϩ
ϩ e
Ϫ
88n
Fe
2ϩ
0.771
Photosystem P700 0.430
NO
3
Ϫ
ϩ 2 H
ϩ
ϩ 2 e
Ϫ
88n
NO
2
Ϫ
ϩ H
2
O 0.421
Cytochrome f (Fe
3ϩ
) ϩ e
Ϫ
88n
cytochrome f (Fe
2ϩ
) 0.365
Cytochrome a
3
(Fe
3ϩ
) ϩ e
Ϫ
88n
cytochrome a
3
(Fe
2ϩ
) 0.350
Cytochrome a(Fe
3ϩ
) ϩ e
Ϫ
88n
cytochrome a(Fe
2ϩ
) 0.290
Rieske Fe-S(Fe
3ϩ
) ϩ e
Ϫ
88n
Rieske Fe-S(Fe
2ϩ
) 0.280
Cytochrome c (Fe
3ϩ
) ϩ e
Ϫ
88n
cytochrome c (Fe
2ϩ
) 0.254
Cytochrome c
1
(Fe
3ϩ
) ϩ e
Ϫ
88n
cytochrome c
1
(Fe
2ϩ
) 0.220
UQH иϩH
ϩ
ϩ e
Ϫ
88n
UQH
2
(UQ ϭ coenzyme Q) 0.190
UQ ϩ 2 H
ϩ
ϩ 2 e
Ϫ
88n
UQH
2
0.060
Cytochrome b
H
(Fe
3ϩ
) ϩ e
Ϫ
88n
cytochrome b
H
(Fe
2ϩ
) 0.050
Fumarate ϩ 2 H
ϩ
ϩ 2 e
Ϫ
88n
succinate 0.031
UQ ϩ H
ϩ
ϩ e
Ϫ
88n
UQH и 0.030
Cytochrome b
5
(Fe
3ϩ
) ϩ e
Ϫ
88n
cytochrome b
5
(Fe
2ϩ
) 0.020
[FAD] ϩ 2 H
ϩ
ϩ 2 e
Ϫ
88n
[FADH
2
] 0.003–0.091*
Cytochrome b
L
(Fe
3ϩ
) ϩ e
Ϫ
88n
cytochrome b
L
(Fe
2ϩ
) Ϫ0.100
Oxaloacetate ϩ 2 H
ϩ
ϩ 2 e
Ϫ
88n
malate Ϫ0.166
Pyruvate ϩ 2 H
ϩ
ϩ 2 e
Ϫ
88n
lactate Ϫ0.185
Acetaldehyde ϩ 2 H
ϩ
ϩ 2 e
Ϫ
88n
ethanol Ϫ0.197
FMN ϩ 2 H
ϩ
ϩ 2 e
Ϫ
88n
FMNH
2
Ϫ0.219
FAD ϩ 2 H
ϩ
ϩ 2 e
Ϫ
88n
FADH
2
Ϫ0.219
Glutathione (oxidized) ϩ 2 H
ϩ
ϩ 2 e
Ϫ
88n
2 glutathione (reduced) Ϫ0.230
Lipoic acid ϩ 2 H
ϩ
ϩ 2 e
Ϫ
88n
dihydrolipoic acid Ϫ0.290
1,3-Bisphosphoglycerate ϩ 2 H
ϩ
ϩ 2 e
Ϫ
88n
Ϫ0.290
glyceraldehyde-3-phosphate ϩ P
i
NAD
ϩ
ϩ 2 H
ϩ
ϩ 2 e
Ϫ
88n
NADH ϩ H
ϩ
Ϫ0.320
NADP
ϩ
ϩ 2 H
ϩ
ϩ 2 e
Ϫ
88n
NADPH ϩ H
ϩ
Ϫ0.320
Lipoyl dehydrogenase [FAD] ϩ 2 H
ϩ
ϩ 2 e
Ϫ
88n
Ϫ0.340
lipoyl dehydrogenase [FADH
2
]
␣-Ketoglutarate ϩ CO
2
ϩ 2 H
ϩ
ϩ 2 e
Ϫ
88n
isocitrate Ϫ0.380
2 H
ϩ
ϩ 2 e
Ϫ
88n
H
2
Ϫ0.421
Ferredoxin (spinach) (Fe
3ϩ
) ϩ e
Ϫ
88n
ferredoxin (spinach) (Fe
2ϩ
) Ϫ0.430
Succinate ϩ CO
2
ϩ 2 H
ϩ
ϩ 2 e
Ϫ
88n
␣-ketoglutarate ϩ H
2
O Ϫ0.670
*Typical values for reduction of bound FAD in flavoproteins such as succinate dehydrogenase (see Bonomi, F., Pagani, S.,
Cerletti, P., and Giori, C.,1983. Modification of the thermodynamic properties of the electron-transferring groups in mito-
chondrial succinate dehydrogenase upon binding of succinate. European Journal of Biochemistry 134:439–445).
TABLE 20.1
Standard Reduction Potentials for Several Biological Reduction Half-Reactions
596 Chapter 20 Electron Transport and Oxidative Phosphorylation
have large positive reduction potentials have a strong tendency to accept electrons, and
the oxidized form of such a couple (O
2
, for example) is a strong oxidizing agent. Re-
dox couples with large negative reduction potentials have a strong tendency to un-
dergo oxidation (that is, donate electrons), and the reduced form of such a couple
(NADPH, for example) is a strong reducing agent.
Ᏹ
o
Values Can Be Used to Analyze Energy Changes in Redox Reactions
The half-reactions and reduction potentials in Table 20.1 can be used to analyze en-
ergy changes in redox reactions. The oxidation of NADH to NAD
ϩ
can be coupled
with the reduction of ␣-ketoglutarate to isocitrate:
NAD
ϩ
ϩ isocitrate ⎯⎯→NADH ϩ H
ϩ
ϩ ␣-ketoglutarate ϩ CO
2
(20.5)
This is the isocitrate dehydrogenase reaction of the TCA cycle. Writing the two half-
cell reactions, we have
NAD
ϩ
ϩ 2 H
ϩ
ϩ 2 e
Ϫ
⎯⎯→NADH ϩ H
ϩ
Ᏹ
o
ЈϭϪ0.32 V (20.6)
␣-Ketoglutarate ϩ CO
2
ϩ 2 H
ϩ
ϩ 2 e
Ϫ
⎯⎯→isocitrate
Ᏹ
o
ЈϭϪ0.38 V (20.7)
In a spontaneous reaction, electrons are donated by (flow away from) the half-
reaction with the more negative reduction potential and are accepted by (flow to-
ward) the half-reaction with the more positive reduction potential. Thus, in the pre-
sent case, isocitrate donates electrons and NAD
ϩ
accepts electrons. The convention
defines ⌬Ᏹ
o
Ј as
⌬Ᏹ
o
ЈϭᏱ
o
Ј (acceptor) Ϫ Ᏹ
o
Ј (donor) (20.8)
In the present case, isocitrate is the donor and NAD
ϩ
the acceptor, so we write
⌬Ᏹ
o
ЈϭϪ0.32 V Ϫ (Ϫ0.38 V) ϭϩ0.06 V (20.9)
From Equation 20.2, we can now calculate ⌬G°Ј as
⌬G°ЈϭϪ(2)(96.485 kJ/V и mol)(0.06 V)
(20.10)
⌬G°ЈϭϪ11.58 kJ/mol
Note that a reaction with a net positive ⌬Ᏹ
o
Ј yields a negative ⌬G°Ј, indicating a
spontaneous reaction.
The Reduction Potential Depends on Concentration
We have already noted that the standard free energy change for a reaction, ⌬G°Ј, does
not reflect the actual conditions in a cell, where reactants and products are not at
standard-state concentrations (1 M). Equation 3.13 was introduced to permit calcu-
lations of actual free energy changes under non–standard-state conditions. Similarly,
standard reduction potentials for redox couples must be modified to account for the
actual concentrations of the oxidized and reduced species. For any redox couple,
ox ϩ ne
Ϫ
34 red (20.11)
the actual reduction potential is given by
Ᏹ ϭ Ᏹ
o
Јϩ(RT/nᏲ) ln (20.12)
Reduction potentials can also be quite sensitive to molecular environment. The in-
fluence of environment is especially important for flavins, such as FAD/FADH
2
and
FMN/FMNH
2
. These species are normally bound to their respective flavoproteins;
the reduction potential of bound FAD, for example, can be very different from the
value shown in Table 20.1 for the free FAD/FADH
2
couple of Ϫ0.219 V. Problem 7 at
the end of the chapter addresses this case.
[ox]
ᎏ
[red]
20.3 How Is the Electron-Transport Chain Organized? 597
20.3 How Is the Electron-Transport Chain Organized?
As we have seen, the metabolic energy from oxidation of food materials—sugars, fats,
and amino acids—is funneled into formation of reduced coenzymes (NADH) and re-
duced flavoproteins ([FADH
2
]). The electron-transport chain reoxidizes the coen-
zymes and channels the free energy obtained from these reactions into the creation
of a proton gradient. This reoxidation process involves the removal of both protons
and electrons from the coenzymes. Electrons move from NADH and [FADH
2
] to mo-
lecular oxygen, O
2
, which is the terminal acceptor of electrons in the chain. The re-
oxidation of NADH,
NADH (reductant) ϩ H
ϩ
ϩ O
2
(oxidant)⎯⎯→NAD
ϩ
ϩ H
2
O (20.13)
involves the following half-reactions:
NAD
ϩ
ϩ 2 H
ϩ
ϩ 2 e
Ϫ
⎯⎯→NADH ϩ H
ϩ
Ᏹ
o
ЈϭϪ0.32 V (20.14)
ᎏ
1
2
ᎏ
O
2
ϩ 2 H
ϩ
ϩ 2 e
Ϫ
⎯⎯→H
2
O Ᏹ
o
Јϭϩ0.816 V (20.15)
Here, half-reaction 20.15 is the electron acceptor and half-reaction 20.14 is the elec-
tron donor. Then
⌬Ᏹ
o
Јϭ0.816 Ϫ (Ϫ0.32) ϭ 1.136 V (20.16)
and, according to Equation 20.2, the standard-state free energy change, ⌬G°Ј, is
Ϫ219 kJ/mol. Molecules along the electron-transport chain have reduction poten-
tials between the values for the NAD
ϩ
/NADH couple and the oxygen/H
2
O couple,
so electrons move down the energy scale toward progressively more positive reduc-
tion potentials (Figure 20.3).
Although electrons move from more negative to more positive reduction po-
tentials in the electron-transport chain, it should be emphasized that the electron
0
+200
+400
+600
–200
–400
Complex I
Complex II
Complex III
Complex IV
NAD
+
/NADH
FMN
(Fe/S)N1
(Fe/S)N4
(Fe/S)N3
(Fe/S)N2
Rieske Fe/S
(Fe/S)S1
(Fe/S)S3
FAD
Fum/Succ
UQ
10
b
L
b
H
Cu
A
c
1
a
3
c
a
(mV)
FIGURE 20.3 Ᏹ
o
Ј and Ᏹ values for the components of
the mitochondrial electron-transport chain.Values indi-
cated are consensus values for animal mitochondria.
Black bars represent Ᏹ
o
Ј; red bars, Ᏹ.
598 Chapter 20 Electron Transport and Oxidative Phosphorylation
carriers do not operate in a simple linear sequence. This will become evident
when the individual components of the electron-transport chain are discussed in
the following paragraphs.
The Electron-Transport Chain Can Be Isolated in Four Complexes
The electron-transport chain involves several different molecular species,
including:
1. Flavoproteins, which contain tightly bound FMN or FAD as prosthetic groups
and which may participate in one- or two-electron transfer events.
2. Coenzyme Q, also called ubiquinone (and abbreviated CoQ or UQ) (see Figure
20.5), which can function in either one- or two-electron transfer reactions.
3. Several cytochromes (proteins containing heme prosthetic groups [see Chapter
5], which function by carrying or transferring electrons), including cytochromes
b, c, c
1
, a, and a
3
. Cytochromes are one-electron transfer agents in which the
heme iron is converted from Fe
2ϩ
to Fe
3ϩ
and back.
4. A number of iron–sulfur proteins, which participate in one-electron transfers in-
volving the Fe
2ϩ
and Fe
3ϩ
states.
5. Protein-bound copper, a one-electron transfer site that converts between Cu
ϩ
and Cu
2ϩ
.
All these intermediates except for cytochrome c are membrane associated (either
in the mitochondrial inner membrane of eukaryotes or in the plasma membrane of
prokaryotes). Three types of proteins involved in this chain—flavoproteins,
cytochromes, and iron–sulfur proteins—possess electron-transferring prosthetic
groups.
The components of the electron-transport chain can be purified from the mito-
chondrial inner membrane. Solubilization of the membranes containing the electron-
transport chain results in the isolation of four distinct protein complexes, and the com-
plete chain can thus be considered to be composed of four parts: (I) NADH–coenzyme
Q reductase, (II) succinate–coenzyme Q reductase, (III) coenzyme Q–cytochrome c
reductase, and (IV) cytochrome c oxidase (Figure 20.4). Complex I accepts electrons
from NADH, serving as a link between glycolysis, the TCA cycle, fatty acid oxidation,
NADH–coenzyme Q
oxidoreductase
Succinate–coenzyme Q
oxidoreductase
Coenzyme Q–cytochrome c
oxidoreductase
Cytochrome c oxidase
Fatty acyl-CoA dehydrogenase
Electron-transferring
flavoprotein, FAD,
Fe-S centers
NADH dehydrogenase,
FMN,
Fe-S centers
Succinate dehydrogenase,
FAD (covalent),
Fe-S centers,
b-type heme
UQ/UQH
2
pool
Flavoprotein 3Flavoprotein 1
Flavoprotein 2
Sn-glycerophosphate
dehydrogenase
FAD,
Fe-S centers
Cytochrome bc
1
complex,
2 b-type hemes,
Rieske Fe-S center,
C-type heme (cyt c
1
)
Flavoprotein 4
Complex II
O
2
H
2
O
Cytochrome c
1
2
Complex I
Complex III
Cytochrome aa
3
complex,
2 a-type hemes,
Cu ions
Complex IV
FIGURE 20.4 An overview of the complexes and pathways in the mitochondrial
electron-transport chain.
(Adapted from Nicholls, D. G., and Ferguson, S. J., 2002. Bioener-
getics 3. London: Academic Press.)
20.3 How Is the Electron-Transport Chain Organized? 599
and the electron-transport chain. Complex II includes succinate dehydrogenase and
thus forms a direct link between the TCA cycle and electron transport. Complexes I
and II produce a common product, reduced coenzyme Q (UQH
2
), which is the sub-
strate for coenzyme Q–cytochrome c reductase (Complex III). As shown in Figure
20.4, there are two other ways to feed electrons to UQ: the electron-transferring
flavoprotein, which transfers electrons from the flavoprotein-linked step of fatty acyl-
CoA dehydrogenase, and sn-glycerophosphate dehydrogenase. Complex III oxidizes
UQH
2
while reducing cytochrome c, which in turn is the substrate for Complex IV,
cytochrome c oxidase. Complex IV is responsible for reducing molecular oxygen. Each
of the complexes shown in Figure 20.4 is a large multisubunit complex embedded
within the inner mitochondrial membrane.
Complex I Oxidizes NADH and Reduces Coenzyme Q
As its name implies, this complex transfers a pair of electrons from NADH to coen-
zyme Q, a small, hydrophobic, yellow compound. Another common name for this en-
zyme complex is NADH dehydrogenase. The complex (with an estimated mass of
980 kD) involves at least 45 polypeptide chains, one molecule of flavin mononu-
cleotide (FMN), and eight or nine Fe-S clusters, together containing a total of 20 to
26 iron atoms (Table 20.2). By virtue of its dependence on FMN, NADH–UQ reduc-
tase is a flavoprotein.
Although the precise mechanism of the NADH–UQ reductase is unknown, the
first step involves binding of NADH to the enzyme on the matrix side of the inner
mitochondrial membrane and transfer of electrons from NADH to tightly bound
FMN:
NADH ϩ [FMN] ϩ H
ϩ
⎯⎯→[FMNH
2
] ϩ NAD
ϩ
(20.17)
The second step involves the transfer of electrons from the reduced [FMNH
2
]
to a series of Fe-S proteins, including both 2Fe-2S and 4Fe-4S clusters (see page
577). The versatile redox properties of the flavin group of FMN are important
here. NADH is a two-electron donor, whereas the Fe-S proteins are one-electron
transfer agents. The flavin of FMN has three redox states—the oxidized, semi-
quinone, and reduced states. It can act as either a one-electron or a two-electron
transfer agent and may serve as a critical link between NADH and the Fe-S
proteins.
The final step of the reaction involves the transfer of two electrons from iron–
sulfur clusters to coenzyme Q. Coenzyme Q is a mobile electron carrier. Its isoprenoid
Mass Prosthetic
Complex (kD) Subunits Group Binding Site for:
NADH–UQ reductase 980 Ն45 FMN NADH (matrix side)
Fe-S UQ (lipid core)
Succinate–UQ reductase 140 4 FAD Succinate (matrix side)
Fe-S UQ (lipid core)
UQ–Cyt c reductase 250 9–10 Heme b
L
Cyt c (intermembrane
Heme b
H
space side)
Heme c
1
Fe-S
Cytochrome c 13 1 Heme c Cyt c
1
Cyt a
Cytochrome c oxidase 162 13 Heme a Cyt c (intermembrane
Heme a
3
space side)
Cu
A
Cu
B
TABLE 20.2
Protein Complexes of the Mitochondrial Electron-Transport Chain
600 Chapter 20 Electron Transport and Oxidative Phosphorylation
tail makes it highly hydrophobic, and it diffuses freely in the hydrophobic core of the
inner mitochondrial membrane. As a result, it shuttles electrons from Complexes I
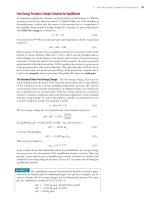
and II to Complex III. The redox cycle of UQ is shown in Figure 20.5. The structural
and functional organization of Complex I is shown in Figure 20.6.
Complex I Transports Protons from the Matrix to the Cytosol The oxidation of
one NADH and the reduction of one UQ by NADH–UQ reductase results in the net
O•
OH
CH
3
R
+
e
–
OH
H
3
CO
H
3
CO
CH
3
R
OH
Coenzyme Q, oxidized form
+
H
+
H
+
e
–
O
O
H
3
CO
H
3
CO
CH
3
(CH
2
CH C CH
2
)
10
H
CH
3
O
CH
3
O
CH
3
(a)
Semiquinone
intermediate
(QH •)
Coenzyme Q,
reduced form
(QH
2
, ubiquinol)
(Q, ubiquinone)
(b)
FIGURE 20.5 (a) The three oxidation states of coenzyme Q. (b) A space-filling
model of coenzyme Q.
HUMAN BIOCHEMISTRY
Solving a Medical Mystery Revolutionized Our Treatment of Parkinson’s Disease
A tragedy among illegal drug users was the impetus for a revolu-
tionary treatment of Parkinson’s disease. In 1982, several mysteri-
ous cases of paralysis came to light in southern California. The vic-
tims, some of them teenagers, were frozen like living statues,
unable to talk or move. The case was baffling at first, but it was
soon traced to a batch of synthetic heroin that contained MPTP
(1-methyl-4-phenyl-1,2,3,6-tetrahydropyridine) as a contaminant.
MPTP is rapidly converted in the brain to MPP
ϩ
(1-methyl-4-
phenylpyridine) by the enzyme monoamine oxidase B. MPP
ϩ
is a
potent inhibitor of mitochondrial Complex I (NADH–UQ reduc-
tase), and it acts preferentially in the substantia nigra, an area of
the brain that is essential to movement and also the region of the
brain that deteriorates slowly in Parkinson’s disease.
Parkinson’s disease results from the inability of the brain to
produce sufficient quantities of dopamine, a neurotransmitter.
Neurologist J. William Langston, asked to consult on the treat-
ment of some of these patients, recognized that the symptoms of
this drug-induced disorder were in fact similar to those of parkin-
sonism. He began treatment of the patients with
L-dopa, which is
decarboxylated in the brain to produce dopamine. The treated pa-
tients immediately regained movement. Langston then took a
bold step. He implanted fetal brain tissue into the brains of several
of the affected patients, prompting substantial recovery from the
Parkinson-like symptoms. Langston’s innovation sparked a revolu-
tion in the use of tissue implantation for the treatment of neu-
rodegenerative diseases.
Other toxins may cause similar effects in neural tissue. Timothy
Greenmyre at Emory University has shown that rats exposed to the
pesticide rotenone (see Figure 20.27) over a period of weeks expe-
rience a gradual loss of function in dopaminergic neurons and then
develop symptoms of parkinsonism, including limb tremors and
rigidity. This finding supports earlier research that links long-term
pesticide exposure to Parkinson’s disease.
MPTP MPP
+
Cell death
in substantia nigr
a
Monoamine
oxidase B
N
H
H
H
HCH
3
H
H
H
+
N
CH
3
+
20.3 How Is the Electron-Transport Chain Organized? 601
transport of protons from the matrix side to the cytosolic side of the inner mem-
brane. The cytosolic side, where H
ϩ
accumulates, is referred to as the P (for posi-
tive) face; similarly, the matrix side is the N (for negative) face. Some of the energy
liberated by the flow of electrons through this complex is used in a coupled process
to drive the transport of protons across the membrane. (This is an example of ac-
tive transport, a phenomenon examined in detail in Chapter 9.) Available experi-
mental evidence suggests a stoichiometry of four H
ϩ
transported per two electrons
passed from NADH to UQ.
Complex II Oxidizes Succinate and Reduces Coenzyme Q
Complex II is perhaps better known by its other name—succinate dehydrogenase,
the only TCA cycle enzyme that is an integral membrane protein in the inner
mitochondrial membrane. This complex (Figure 20.7) has a mass of 124 kD and
is composed of two hydrophilic subunits, a flavoprotein (Fp, 68 kD) and an
iron–sulfur protein (Ip, 29 kD), and two hydrophobic, membrane-anchored sub-
units (15 kD and 11 kD), which contain one heme b and provide the binding site
for UQ. Fp contains an FAD covalently bound to a His residue (see Figure 19.12),
and Ip contains three Fe-S centers: a 4Fe-4S cluster, a 3Fe-4S cluster, and a 2Fe-2S
cluster. When succinate is converted to fumarate in the TCA cycle, concomitant re-
duction of bound FAD to FADH
2
occurs in succinate dehydrogenase. This FADH
2
NADH
+
+ H
+
2 H
+
2 H
+
2 H
+
(a)
2 H
+
2 H
+
FMN
FMNH
2
2 Fe-S
centers
2 Fe-S
centers
UQ
UQH
2
NAD
+
e
–
2
e
–
2
(b)
12
13
7/11/14
8/10
(c)
N1a
N6a
N3
FMN
N1b
N6b
N4
N5
N7
N2
ACTIVE FIGURE 20.6 (a) Structural organization of mammalian Complex I, based on electron
microscopy, showing functional relationships within the L-shaped complex. Electron flow from NADH to
UQH
2
in the membrane pool is indicated. (b) Structure of the hydrophilic domain of Complex I from Thermus
thermophilus is shown on a model of the membrane-associated complex (pdb id ϭ 2FUG).The locations of
individual subunits are indicated. (c) Arrangement of the redox centers in Complex I.The various iron–sulfur
centers of Complex I are designated by capital N. (Part a adapted from Janssen, R. J., Nijtmans, L. G., van den Heuvel, L. P.,
and Smeitink, J.A., 2006. Mitochondrial complex I: Structure, function, and pathology. Journal of Inherited Metabolic Diseases
29:499–515; and parts b and c adapted from Figure 1 of Sazanov, L., and Hinchliffe, P., 2006.Structure of the hydrophilic
domain of respiratory Complex I from Thermus thermophilus. Science 311:1430–1436.)
Test yourself on the concepts in
this figure at www.cengage.com/login.
602 Chapter 20 Electron Transport and Oxidative Phosphorylation
transfers its electrons immediately to Fe-S centers, which pass them on to UQ. Elec-
tron flow from succinate to UQ,
Succinate ⎯⎯→ fumarate ϩ 2 H
ϩ
ϩ 2 e
Ϫ
(20.18)
UQ ϩ 2 H
ϩ
ϩ 2 e
Ϫ
⎯⎯→ UQH
2
(20.19)
Net rxn: Succinate ϩ UQ ⎯⎯→ fumarate ϩ UQH
2
⌬Ᏹ
o
Јϭ0.029 V (20.20)
yields a net reduction potential of 0.029 V. (Note that the first half-reaction is writ-
ten in the direction of the e
Ϫ
flow. As always, ⌬Ᏹ
o
Ј is calculated according to Equa-
tion 20.8.) The small free energy change of this reaction does not contribute to the
transport of protons across the inner mitochondrial membrane.
This is a crucial point because (as we will see) proton transport is coupled with ATP
synthesis. Oxidation of one FADH
2
in the electron-transport chain results in synthesis
of approximately two molecules of ATP, compared with the approximately three
ATPs produced by the oxidation of one NADH. Other flavoproteins can also supply
(a)
UQ
UQH
2
Intermembrane
space
Matrix
Complex III
Complex II
2Fe
2+
2Fe
3+
FAD
Succinate Fumarate
FADH
2
2 H
+
3Fe4S
4Fe4S
2Fe2S
Heme b
(b) (c)
Heme b
Fe-S
centers
FAD
ACTIVE FIGURE 20.7 (a) A scheme for
electron flow in Complex II. Oxidation of succinate
occurs with reduction of [FAD]. Electrons are then
passed to Fe-S centers and then to coenzyme Q (UQ).
Proton transport does not occur in this complex. (b) The
structure of Complex II from pig heart (pdb id ϭ 1ZOY).
(c) The arrangement of redox centers. Electron flow is
from bottom to top. Test yourself on the concepts in
this figure at www.cengage.com/login.