the essence of chromatography
Bạn đang xem bản rút gọn của tài liệu. Xem và tải ngay bản đầy đủ của tài liệu tại đây (39.37 MB, 927 trang )
The
essence
of
chromatography
Colin
F.
Poole
Department of Chemistry, Wayne State University, Detroit, MI 48202, USA
2003
ELSEVIER
Amsterdam - Boston - London - New York - Oxford - Paris
San Diego - San Francisco - Singapore - Sidney - Tokyo
ELSEVIER SCIENCE B.Y.
Sara Burgerhartstraat 25
P.O. Box 211,1000 AE Amsterdam, The Netherlands
© 2003 Elsevier Science B.Y. All rights reserved.
This work is protected under copyright by Elsevier Science, and the following terms and conditions apply to its use:
Photocopying
Single photocopies of single chapters may be made for personal use as allowed by national copyright laws. Permission of the
Publisher and payment of a fee is required for all other photocopying, including multiple or systematic copying, copying for
advertising or promotional purposes, resale, and all forms of document delivery. Special rates are available for educational
institutions that wish to make photocopies for non-profit educational classroom use.
Permissions may be sought directly from Elsevier Science via their homepage () by selecting
'Customer support' and then 'Permissions'. Alternatively you can send an e-mail to: , or fax to:
(+44) 1865853333.
In the USA, users may clear permissions and make payments through the Copyright Clearance Center, Inc., 222 Rosewood
Drive. Danvers, MA 01923. USA; phone: (+ I) (978) 7508400, fax: (+ I) (978) 7504744, and in the UK through the Copyright
Licensing Agency Rapid Clearance Service (CLARCS). 90 Tottenham Court Road, London W
IP
aLP.
UK; phone: (+44)
207631 5555; fax: (+44) 207 631 5500. Other countries may have a local reprographic rights agency for payments.
Derivative Works
Tables of contents may be reproduced for internal circulation, but permission of Elsevier Science is required for external
resale or distribution of such material.
Permission of the Publisher is required for all other derivative works, including compilations and translations.
Electronic Storage or Usage
Permission of the Publisher is required to store or use electronically any material contained in this work, including any chapter
or part of a chapter.
Except as outlined above. no part of this work may be reproduced. stored in a retrieval system or transmitted in any form or by
any means. electronic, mechanical,
photocopying,
recording or otherwise, without prior written permission
of
the Publisher.
Address permissions requests to: Elsevier Science Global Rights Department, at the fax and e-mail addresses noted above.
Notice
No responsibility is assumed by the Publisher for any injury and/or damage to persons or property as a matter of products
liability, negligence or otherwise. or from any use or operation of any methods, products. instructions or ideas contained in
the material herein. Because of rapid advances in the medical sciences, in particular, independent verification of diagnoses
and drug dosages should be made.
First edition 2003
Library of Congress Cataloging in Publication Data
A catalog record from the Library of Congress has been applied for.
British Library Cataloguing in Publication Data
A catalogue record from the Britisb Library has been applied for.
ISBN:
0444501983
(hardbound)
ISBN:
044450199
I (paperback)
® The paper used in this publication meets the requirements of ANSIINISO Z39.48-1992 (Permanence of Paper).
Printed in The Netberlands.
v
Contents
Preface . ix
Chapter
1. General Concepts in Column Chromatography 1
1.1. Introduction . . . . . . . . . . . . . . . . . 2
1.2. Family Tree of Chromatographic Methods
2
1.3. Zone Migration .
6
1.4.
Retention
8
1.5. Band Broadening
24
1.6.
Resolution
51
1.7. Separation Time .
59
1.8. Principles of Quantification. 62
1.9. References .
72
Chapter 2. The Column in Gas Chromatography
79
2.1. Introduction . . .
80
2.2. Mobile Phases
83
2.3. Stationary Phases
86
2.4. Retention in Gas-Liquid Chromatography. 120
2.5. Preparation and Evaluation of Open Tubular Columns
142
2.6. Preparation and Evaluation of Packed
Columns.
156
2.7.
References
162
Chapter 3. Instrumental Aspects of Gas Chromatography . 171
3.1. Introduction . . . . 172
3.2. Pneumatic Systems
172
3.3. Thermal Zones
176
3.4. Sample Handling Devices
177
3.5. Sample Inlets . 180
3.6. Supercritical Fluid Inlets .
203
vi The Essence
of
Chromatography
3.7. Vapor Sample Inlets .
3.8. Coupled-Column Gas Chromatography
3.9. Column Connectors and Flow Splitters
3.10.
Detectors.
3.11. References . . . . . . . . . . . . . . . .
Chapter
4. The Column in Liquid
Chromatography
4.1. Introduction . . . . . . . .
4.2. Column Packing Materials
4.3. Retention Mechanisms
4.4. Method Development .
4.5. Column
Preparation.
4.6.
References
Chapter
5.
Instrumental
Aspects of Liquid
Chromatography
5.1. Introduction .
5.2. Solvent Delivery
Systems.
5.3. Sample Inlets .
5.4. Guard and Scavenger
Columns.
5.5. Column Temperature Control.
5.6. Coupled-Column Systems
5.7.
Detectors
5.8. Postcolumn Reaction Systems
5.9. Indirect Detection
5.1
O.
References . . . . . . . . . . .
Chapter
6. Thin-Layer
Chromatography
.
6.1. Introduction . . . . . . . . . . . .
6.2. Attributes of Layers and Columns
6.3. Theoretical Considerations
6.4. Stationary Phases . . . . . . . . .
6.5. Sample Application .
6.6. Multimodal (Coupled Column-Layer) Systems
6.7. Development Techniques
6.8. Method Development
6.9. Detection
6.10. References . . . . . .
Chapter
7. Supercritical Fluid
Chromatography.
7.1. Introduction .
7.2. Mobile Phases
204
216
224
225
257
267
269
270
300
362
393
413
431
432
434
441
449
449
451
455
487
490
491
499
500
501
504
520
527
529
531
541
552
562
569
570
573
Contents
vii
7.3. Stationary Phases . .
580
7
A. Kinetic Optimization
582
7.5.
Retention
587
7.6. Instrumental Aspects
596
7.7. Related Techniques
608
7.8.
References
611
Chapter 8. Capillary-Electromigration Separation Techniques
619
8.1. Introduction . . . . . . . . . . . . . . . . 620
8.2. Capillary Electrophoresis . . . . . . . . .
623
8.3. Micellar Electrokinetic Chromatography 644
804.
Capillary Electrochromatography
659
8.5. Capillary Gel Electrophoresis
668
8.6. Capillary Isoelectric Focusing
671
8.7. Capillary Isotachophoresis
673
8.8. Method Development . 676
8.9. Instrumental Aspects 684
8.10. References .
706
Chapter 9. Spectroscopic Detectors for Identification and Quantification 719
9.1. Introduction . 720
9.2. Mass Spectrometry .
721
9.3. Fourier Transform Infrared Spectrometry 767
904.
Nuclear Magnetic Resonance Spectroscopy. 779
9.5. References . 785
Chapter 10. Separation of Stereoisomers 793
10.1. Introduction . . . . . . . . . . . . . . 794
10.2. Enantioselectivity and Absolute Configuration 797
10.3. Separation of Enantiomers . . 800
lOA. Chiral Stationary Phases . . . . 802
10.5. Chiral Mobile Phase
Additives.
821
10.6. Complexation Chromatography 830
10.7. Separation of Enantiomers as Covalent Diastereomer Derivatives. 834
10.8. Liquid-Crystalline Stationary Phases 837
10.9.
References.
. . . . . . . . . . . . . . . . . . . . . . . . . . 839
Chapter 11. Laboratory-Scale Preparative Chromatography 847
11.1. Introduction . . . . . . . . . . . . 848
11.2. Thin-Layer Chromatography . . . 848
11.3. Column Liquid Chromatography. 850
Vlll
The Essence ofChromatography
11.4. Supercritical Fluid Chromatography . 884
11.5. Gas Chromatography .
886
11.6. Countercurrent Chromatography .
889
11.7. References .
893
Subject Index
901
IX
Preface
The knowledge base of chromatography continued to expand throughout the 1990s
owing to its many applications to problems of contemporary interest in industry and
life and environmental sciences. Organizing this information into a single text for a
diverse group of scientists has become increasingly difficult. The present book stemmed
from the desire to revise an earlier work, "Chromatography Today", published in 1991.
It
was soon realized that a simple revision would not provide the desired result of a
contemporary picture of the practice of chromatography at the turn of the century. The
only workable solution was to start afresh, maintaining the same general philosophy and
concept for "Chromatography Today" where possible, while creating essentially a new
book. In particular, both time and space constraints dictated that to cover in equal depth
the diverse separation techniques in current use, it would not be possible to cover sample
preparation techniques to the same extent as "Chromatography Today". The division
I made here was to include automated and on-line methods with instrumentation, and
treat them in a comprehensive manner, while widely used manual laboratory operations
are not treated at all, albeit that these techniques are an integral part of laboratory
life. This allowed, for example, the addition of a comprehensive and separate chapter
on capillary-electromigration separation techniques, and greater emphasis on modern
approaches for data analysis, compared with "Chromatography Today".
In writing this book, I had in mind that it would present a comprehensive
survey of modern chromatographic and capillary electrophoretic techniques at a level
commensurate with the needs of a textbook for teaching post-baccalaureate courses
in the separation sciences. In addition, it would fulfill the need for a self-study guide
for professional scientists wishing to refresh their background in this rapidly growing
field. The chapters follow a modular format to allow instructors to select components to
their liking to make up a typical one-semester course. For the professional scientist, the
extensive cross-referencing and comprehensive index should allow individual topics to
be quickly found, and the extensive bibliography to be used for entry into the primary
scientific literature. Where possible, frequently searched for characteristic properties of
separation systems are collected in tables, to allow the book to be used as a stand-alone
resource for the professional scientist.
Colin
F. Poole
Chapter 1
General Concepts in Column
Chromatography
1.1. Introduction . . . . . . . . . . . . . . . . . 2
1.2. Family Tree of Chromatographic Methods
2
1.3. Zone Migration .
6
1.4. Retention .
8
1.4.1. Influence of Mobile Phase Physical Properties
9
1.4.2. Property Estimations . . . . . . .
12
1.4.3. Linear Free Energy Relationships
13
1.4.4. Exothermodynamic Relationships
19
1.4.5. General Elution Problem .
23
1.5. Band Broadening .
24
1.5.1. Flow Through Porous Media .
26
1.5.2. Rate Theories
29
1.5.3. Reduced Parameters
38
1.5.4. Extracolumn Sources 44
1.5.5. Isotherm Effects . . .
47
1.5.6. Peak Shape Models .
49
1.6. Resolution. . . . . . . . . .
51
1.6.1. Relationship to Column Properties.
52
1.6.2. Objective Functions . . . .
54
1.6.3. Peak Capacity .
56
1.6.4. Statistical Overlap Models
59
1.7. Separation Time .
59
1.8. Principles of Quantification .
62
1.8.1. Signal Characteristics.
63
1.8.2. Integration Methods
65
1.8.3. Relative
Composition.
70
1.9. References. . . . . . . . .
.'.
72
2
The Essence ofChromatography
1.1 INTRODUCTION
The Russian botanist M. S. Tswett is generally credited with the discovery of chroma-
tography around the turn
of
the century [1,2]. He used a column
of
powdered calcium
carbonate to separate green leaf pigments into a series
of
colored bands by allowing a
solvent to percolate through the column bed. He also coined the name chromatography
(color writing) from the Greek for color (chroma) and write (graphein) to describe the
process. However, column liquid chromatography as described by Tswett was not an
instant success, and it was not until its rediscovery in the early 1930s that it became an
established laboratory method. Chemists at this time were limited to such laboratory
tools as crystallization, liquid-liquid distribution and distillation for separations and
new techniques were needed for the rapid isolation
of
pure components from natural
products and to support the development
of
increasingly sophisticated approaches
to organic synthesis. Although many scientists made substantial contributions to
the evolution
of
modern chromatography, not least among these is A. J. P. Martin
who received the Nobel prize in 1952 for the invention
of
partition chromatography
(with
R. L. M. Synge) and in the same year with A. T. James he introduced the
technique of gas-liquid chromatography. The 1940s saw a rapid expansion in the use
of
chromatographic methods in the laboratory but the introduction and development
of
gas-liquid chromatography in the 1950s represented a significant milestone, ushering
in the era
of
instrumental methods
of
separation which spawned the many variations
of
modern chromatography in use today. Further milestones in the evolution
of
chromatographic separation methods are summarized in Table 1 [3-5]. Individual
profiles
of
the early pioneers
of
chromatography are collected in ref. [6-8].
1.2 FAMILY TREE OF CHROMATOGRAPHIC METHODS
Since chromatography has evolved into a large number
of
applied methods it is no
simple task to provide a meaningful comprehensive definition. Chromatography is
essentially a physical method
of
separation in which the components to be separated
are distributed between two phases, one
of
which is stationary (stationary phase)
while the other (the mobile phase) moves in a definite direction [9,10]. This definition
suggests that chromatographic separations have three distinct features: (a) they are
physical methods
of
separation; (b) two distinct phases are involved, one of which is
stationary while the other is mobile; and (c) separation results from differences in the
distribution constants of the individual sample components between the two phases.
The definition could be broadened to allow for the fact that it is not essential that
one phase is stationary, although this may be more experimentally convenient. What is
important, is that either the rate
of
migration or direction
of
migration
of
the two phases
are different
[II].
Micellar electrokinetic chromatography (MEKC) is an example
of
a separation technique based on differential migration in a two-phase system. The
above definition excludes all separations that occur by differential migration in a
3
»
General Concepts in Column Chromatography
Table
l.l
Some significant time frames in the evolution of modern chromatography
Date
Associated development
1903 • Original description of column liquid chromatography by Tswett
1931 • Column liquid chromatography rediscovered by Lederer and co-workers at a time more
receptive for its establishment as a standard laboratory method.
1938
• Ion-exchange column liquid chromatography introduced.
It came to prominence as a
distinct chromatographic technique during the Second World War (1939-1945) as a separation
procedure for the rare earth and transuranium elements.
1941
• Column liquid-liquid partition chromatography introduced as a faster and more efficient
separation method than countercurrent distribution chromatography.
1944
• Paper chromatography introduced as a fast, simple and convenient method for analytical
separations based on partition chromatography. Now largely replaced by thin-layer chro-
matography.
Mid-I 940s
• Gel electrophoresis developed for the separation of charged analytes in a stabilizing gel
matrix. Later became an important method for the separation of biopolymers.
Early-1950s
• Immobilized layers and standardized sorbents leads to the popularization of thin-layer
chromatography as a faster and more convenient method than column liquid chromatography
for analytical separations. Fine-particle layers introduced in the mid- I970s were responsible
for the development of high performance (instrumental) thin-layer chromatography.
1952
• Gas-liquid chromatography is described by James and Martin and begins the development of
instrumental chromatographic methods. Gas chromatography provided a major improvement
in the separation of volatile compounds eclipsing established methods at that time. It remains
the most widely used chromatographic technique for the fast and efficient separation of
thermally stable and volatile compounds today.
1958
• Column liquid size-exclusion chromatography using controlled porosity dextran gels
introduced by Flodin and Porath. This became an important approach for the separation
(or characterization) of polymers based on size differences as well as for the estimation of
molecular weights.
1962
• Klesper introduced supercritical fluids as mobile phase for column chromatography but
limited development took place until the early 1980s when Lee introduced open tubular
columns. Most supercritical fluid separations today use packed columns of small internal
diameter.
Mid-1960s
• Giddings introduces the technique of field flow fractionation for the separation of particles
and continues to develop the theory and technology of its many variants (fields) over the next
30 years.
1967
• Affinity chromatography introduced by Porath and co-workers for the isolation of biological
polymers based on the specificity of their interactions with appropriate immobilized ligands.
Late-1960s
• The introduction of pellicular sorbents catalyzed the development of high pressure
liquid chromatography. It was not until the mid-1970s that rapid development took place
with the introduction of porous microparticle sorbents. By the 1980s high pressure liquid
chromatography was well established as the most popular condensed phase separation
technique in modern chromatography.
1970
• Everaerts and co-workers introduced capillary isotachophoresis for the concentration and
separation of ions.
1970s
• Ito and co-workers commenced a number of advances in counter current chromatography
using centrifugal and planetary motion for liquid-liquid separations.
Mid-1970s
• Small and co-workers introduced ion chromatography based on the integration of ion-
exchange chromatography with conductivity detection for the analysis of ions. This method
is now the most common chromatographic technique for the analysis of inorganic ions.
4 The Essence
of
Chromatography
Table 1.1
(Continued)
Date
Associated development
Early-1980s
• Jorgenson and co-workers popularized the use of zone electrophoresis in capillary columns
for the fast and efficient separation of ions and biopolymers.
1984 • Terabe introduced the method of micellar electrokinetic chromatography (MEKC) using
surfactant-containing buffers in a capillary electrophoresis apparatus. Over the next decade
MEKC matured into an important method for the electroseparation of neutral compounds.
Late-1980s
• Rediscovery of capillary electrochromatography. Pioneering work by Knox leads to the
evolutionary development of this technique during the 1990s.
single-phase system, such as capillary electrophoresis (CE). Useful chromatographic
separations require an adequate difference in the strength of physical interactions for
the sample components in the two phases, combined with a favorable contribution
from system transport properties that control the movement within and between phases.
Several key factors are responsible, therefore, or act together, to produce an acceptable
separation. Individual compounds are distinguished by their ability to participate
in common intermolecular interactions in the two phases, which can generally be
characterized by an equilibrium constant, and is thus a property predicted from chemical
thermodynamics. During transport through or over the stationary phase differential
transport resulting from diffusion, convection, turbulence, etc., result in dispersion of
solute zones around an average value, such that they occupy a finite distance along
the stationary phase in the direction of migration. The extent of dispersion restricts the
capacity of the chromatographic system to separate, and independently of favorable
thermodynamic contributions to the separation, there are a finite number of dispersed
zones that can be accommodated in the separation. Consequently, chromatographic
separations depend on a favorable contribution from thermodynamic and kinetic
properties of the compounds to be separated.
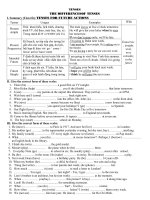
A convenient classification of chromatographic techniques can be made in terms of
the physical state of the phases employed for the separation, Figure 1.1. When the
mobile phase is a gas and the stationary phase a solid or liquid the separation techniques
are known as gas-solid chromatography (GSC) or gas-liquid chromatography (GLC),
respectively. Gas-liquid chromatography is the more popular separation mode and is
often simply referred to as gas chromatography (GC). When the mobile phase is a
supercritical fluid and the stationary phase either a solid or immobilized liquid the
separation technique is called supercritical fluid chromatography (SFC). For gas and
supercritical fluid chromatography the dominant separation mechanisms are partitioning
between bulk phases and interfacial adsorption. To classify separation techniques
with a liquid mobile phase a wider range of separation mechanisms needs to be
considered and is commonly used as the basis of classification. Also, true liquid-liquid
separation systems are not important because of their limited stability and experimental
inconvenience. Modern liquid chromatography is dominated by the use of inorganic
oxides with organic functional groups chemically bonded to their surface, known as
bonded phases, and to a lesser extent porous polymers. When the stationary phase is
5
General Concepts in Column Chromatographv
I
RAPHyl
I
I
GAS
SUPERCRITICAL
LIQUID
FLUID
I
I
I
I
I
SOLID
LIQUID
SOLID
SOLID
LIQUID
MICELLES
(GSC)
(GLC)
(SFC)
(LLC)
(MEKC)
t
I
I
I I
I
ADSORPTION
SIZE
EXCLUSION
ION
EXCHANGE
I
AFFINITY
SORPTION SORPTION
(LSC)
(SEC)
(IEC)
(AC)
(RPC)
(CEC)
I
Figure 1.1. Family tree of column chromatographic methods. GSC = gas-solid chromatography; GLC =
gas-liquid chromatography; SFC = supercritical fluid chromatography; LLC = liquid-liquid chromatography;
MEKC
= micellar electrokinetic chromatography; LSC = liquid-solid chromatography; SEC = size- exclusion
chromatography; IEC
= ion-exchange chromatography; AC = affinity chromatography; RPC = reversed-phase
chromatography; and CEC
= capillary electrochromatography.
a solid and interfacial adsorption the dominant separation mechanism the technique is
referred to as liquid-solid chromatography (LSC).
If
the stationary phase is a solid with
a controlled pore size distribution and solutes are separated by size differences then
the technique is referred to as size-exclusion chromatography (SEC).
If
the stationary
phase is a solid with immobilized ionic groups and the dominant separation mechanism
is electrostatic interactions between ions in the mobile phase and those on the stationary
phase then the technique is referred to as ion-exchange chromatography (lEC) or ion
chromatography (IC).
If
the stationary phase is a solid with immobilized molecular
recognition sites in which the dominant separation mechanism is the three-dimensional
specificity of the interaction between the molecular recognition site and the sample
then the technique is referred to as affinity chromatography (AC). Reversed-phase
chromatography (RPC) is a particular form of bonded-phase chromatography in which
the mobile phase is more polar than the stationary phase (for most practical applications
the mobile phase is an aqueous solution). Reversed-phase chromatography is the most
popular separation mode in modern liquid chromatography being applicable to a wide
range of neutral compounds of different polarity. In addition, by exploiting secondary
chemical equilibria in the mobile phase, ionic compounds are easily handled by ion
suppression, ion pairing, or complexation.
In the normal operating mode in gas, supercritical fluid and liquid chromatography
the stationary phase is contained in a rigid container, usually a tube of various
6
The Essence a/Chromatography
dimensions, called a column, through which the mobile phase is forced to migrate
by external pressure. Alternatively, the bulk flow
of
mobile phase containing an
electrolyte can be induced by an external electric field through the process known as
electroosmosis.
When
a column containing a stationary phase is used and the movement
of
the mobile phase is caused by electroosmosis the separation technique is called
electrochromatography, or since columns
of
capillary dimensions are essential for this
technique, capillary electrochromatography (CEC). Ionic surfactants can form micelles
as a continuous phase dispersed throughout a buffer.
In an electric field these charged
micelles move with a different velocity or direction to the flow
of
bulk electrolyte.
Neutral solutes
can
be separated if their distribution constants between the micelles and
buffer are different by the technique known as micellar electrokinetic chromatography
(MEKC). Ionic solutes in CEC and
MEKC
are influenced by the presence
of
the electric
field and are separated by a combination of chromatography and electrophoresis. All the
above processes are considered examples of column chromatography.
If
the stationary
phase is distributed as a thin layer on a (usually) flat support, such as a sheet of glass
or plastic, and the mobile phase is allowed to ascend through the layer (usually) by
capillary forces then this method is referred to as planar or thin-layer chromatography
(TLC). TLC has largely replaced paper chromatography (PC) in contemporary practice
owing to the poorer separation characteristics
of
the latter,
1.3 ZONE MIGRATION
Transport
of
solute zones in column chromatography occurs entirely in the mobile
phase. Transport is an essential component of the chromatographic system since the
common arrangement for the experiment employs a sample inlet and detector at
opposite ends of the column with sample introduction and detection occurring in the
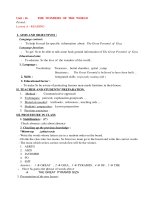
mobile phase. There are three basic approaches for achieving selective zone migration
in column chromatography, Figure 1.2 [12].
Infrontal analysis, the sample is introduced
continuously onto the column as a component of the mobile phase. Each solute is
retained to a different extent as it reaches equilibrium with the stationary phase until,
eventually, the least retained solute exits the column followed by other zones in turn,
each of which contains several components identical to the solutes in the zone eluting
before it [13]. Ideally the detector output will be comprised
of
a series
of
rectangular
steps
of
increasing height. Frontal analysis is used to determine sorption isotherms
for single component or simple mixtures and to isolate a less strongly retained trace
component from a major component. Quantification
of
each component in a mixture is
difficult and at the end of the experiment, the column is contaminated by the sample. For
these reasons frontal analysis is used only occasionally for separations. Frontal analysis
is the basis
of
solid-phase extraction techniques used for the collection of contaminants
from air and water by sorption onto short sorbent beds.
In displacement chromatography the sample is applied to the column as a discrete
band and a substance (or mobile phase component) with a higher affinity for
7 General Concepts in Column Chromatography
Mobile phase
•
A+B+C
Stationary
phase
•
~ +
Frontal
Elution analysis
I
C •
A+B+C
B
~+B
A
~
!
«.»
~
C
JAl/BUCl
y:(ABjABl;)
:m:
, .
Figure 1.2. Mode of zone displacement in column chromatography.
the stationary phase than any of the sample components, called the displacer, is
continuously passed through the column. The displacer pushes sample components
down the column, and if the column is long enough, a steady state is reached, and a
succession of rectangular bands
of
pure components exit the column. Each component
displaces the component ahead of it, with the last and most strongly retained component
being forced along by the displacer. At the end
of
the separation the displacer must be
stripped from the column if the column is to be reused. Displacement chromatography
is used mainly in preparative and process chromatography, where high throughputs of
pure compounds can be obtained (section 11.3.5) [12]. Depending on the experimental
conditions the contact boundary between zones may not be discrete and the collection
of
pure material may be restricted to the central region of the displaced zones.
In elution chromatography the mobile and stationary phase are normally at equi-
librium. The sample is applied to the column as a discrete band and sample com-
ponents are successively eluted from the column diluted by mobile phase. The mo-
bile phase must compete with the stationary phase for the sample components and for
a separation to occur the distribution constants for the sample components resulting
from the competition must be different. Elution chromatography is the most conve-
nient method for analysis and is commonly used in preparative-scale chromatography.
8
The Essence
of
Chromatography
Today elution development has become synonymous with the word chromatography
itself.
The information obtained from a chromatographic experiment is contained in the
chromatogram. When the elution mode is used this consists of a plot of (usually)
detector response (y-axis) as a continuous function of time or volume of mobile phase
passed through the column (x-axis). The chromatogram contains a number of peaks
of various sizes rising from a baseline. Many representative examples can be found
throughout this text. Information readily extracted from the chromatogram includes
an indication of sample complexity from the number of observed peaks; qualitative
identification of sample components from the accurate determination of peak position;
quantitative assessment of the relative concentration or amount of each component
from their peak areas; and characteristic physical properties of either the solute or the
chromatographic system from peak positions and profiles. The fundamental information
of the chromatographic process that can be extracted from the chromatogram forms
basis of the remainder of this chapter.
1.4 RETENTION
The position of a peak in a chromatogram is characterized by its retention time (tR) or
retention volume (VR).Retention volumes are fundamentally more correct than time but
require further experimental information for their determination. We will come to this
shortly, and consider only the directly observable measurement of time for the present.
The retention time is made up of two components. The time that the solute spends in the
mobile phase and the time it spends in the stationary phase. All solutes spend the same
time in the mobile phase, which is simply the time required by an unretained solute,
that is a solute that does not interact with the stationary phase, to travel through the
chromatographic system. This time is called the column hold-up time, tM, (sometimes
referred to as the dead time although hold-up time is preferred). It represents the time
required by the mobile phase entering the column to reach the detector and in volume
terms is equivalent to the volume of streaming mobile phase contained in the column.
In liquid and supercritical fluid chromatography a fraction of the mobile phase can be
trapped in the pores of the column packing and is stagnant. The volume of stagnant
mobile phase is considered part of the stationary phase and thus the column hold-up
volume is less than the volume of liquid or fluid filling the column. For a gas the
column hold-up volume and the unoccupied volume of the column are identical. The
time the solute spends in the stationary phase is called the adjusted retention time, ta ' (or
adjusted retention volume, VR') and is calculated by difference from the retention time
(volume) and the column hold-up time (volume). Since for convenience the retention
time of a substance is determined from the moment of injection as time zero, we arrive
at the simple relationship (Eq. 1.1) combining the independent contributions to the
observed retention time
(Ll)
9 General Concepts in Column Chromatography
For the optimization of chromatographic separations and in the formulation of
theoretical models the retention factor (sometimes referred to as the capacity factor), k,
is more important than retention time. The retention factor is the ratio of the time a
substance spends in the stationary phase to the time it spends in the mobile phase
(Eq. 1.2)
(1.2)
If
the distribution constant is independent of the sample amount then the retention factor
is also equal to the ratio of the amounts of substance in the stationary and mobile phases.
At equilibrium the instantaneous fraction of a substance contained in the mobile phase
is 1 / (1
+ k) and in the stationary phase k / (1 + k). The retention time and the retention
factor are also related through Eq. (1.3)
tR =tM (1 + k) =(L / u) (1 + k)
( 1.3)
where L is the column length, and u the average mobile phase velocity. The distribution
constant for a substance in the chromatographic system is equal to the product of the
retention factor and the phase ratio (K
=
k~).
The phase ratio,
~,
is defined as the ratio of
the volume of mobile phase and stationary phases in the column for a partition system,
or the ratio of the volume of the mobile phase to the surface area of the stationary phase
for an adsorption system, respectively.
The relative retention of any two peaks in the chromatogram is described by the
separation factor,
a, given by Eq.
(1.4)
(1.4)
By convention, the adjusted retention time or retention factor of the later eluting of
the two peaks is made the numerator in Eq.
(1.4); the separation factor, consequently,
always has values greater than or equal to 1.0. The separation factor is a measure of
the selectivity of a chromatographic system.
In thermodynamic terms it is related to
the difference in free energy of the retention property responsible for the separation
and is a term widely used in method development for defining systems with useful
separation properties. To maintain a useful thermodynamic meaning the separation
factor must be determined for fixed and constant experimental conditions, for example,
constant temperature in gas chromatography and constant mobile phase composition in
liquid chromatography. The separation factor is sometimes called the selectivity factor,
selectivity or relative retention.
1.4.1 Influence of Mobile Phase Physical Properties
In pressure-driven systems a pressure gradient exists between the column inlet and out-
let resulting in a change in volume-dependent terms over the length of the column
10 The Essence of' Chromatography
Table 1.2
Calculation of retention volumes in gas chromatography
Experimental data for calculation: retention time tR
= 12.61 min; column hold-up time tM = 0.23 min;
carrier gas flow rate at column outlet Fa
= 21.78 rnl/rnin; column temperature T
c
= 121°C (394.2 K);
ambient temperature Ta
= 23°C (296.2 K); ambient pressure Po = 754.5 mm Hg; column head pressure
PG
= 62.9 mm Hg; P
w
= vapor pressure of water at T
a
(available in handbooks of physical constants); and
weight
ofliquid
phase WL =1.5115 g
• Calculation of the gas compressibility correction factor j
j
= 3 / 2 [(P
2
- I) / (p3 - I) where P is the relative pressure (ratio of the column inlet pressure Pi to the outlet
pressure
PO).
Pi = PG + Po and P = (62.9 + 754.5) / 754.5 = 1.0834
j
= 3 / 2 (0.1737 / 0.2715) = 0.9596
• Calculation of the carrier gas flow rate at the column temperature from the flow rate measured at the column
outlet Fa. If measurements are made with a soap-film meter it is necessary to correct the flow rate for the
difference between the dry gas (column) and water saturated gas (meter) measurements. Fe is the corrected
carrier gas flow rate.
Fe
= Fa [T
c
ITal
[I - (P
w
/
Poll = 21.78 [394.2/296.21 [I - (21.068/754.5)1 = 28.18
mll
min.
• Column hold-up volume corresponding to the hold-up time is VM and after correction for compressibility
of the carrier gas is the corrected hold-up volume VMo. The latter is equivalent to the gas phase volume of
the column at the average column pressure and temperature. VM
= tM Fe = (0.23) (28.18) = 6.48 ml and VMo
= j VM = (0.9596) (6.48) = 6.22 m1.
• The retention volume (VR) is the volume of mobile phase entering the column between sample injection
and the emergence of the peak maximum for the substance of interest. The corrected retention volume (VR
0)
is the retention volume corrected for the compressibility of the carrier gas. VR = tR Fe = (12.61) (28.18) =
355.3 ml and VR° = j VR = (0.9596) (355.3) = 341 ml.
• The adjusted retention volume (VR') is the retention volume corresponding to the adjusted retention time
and the net retention volume (VN) is the adjusted retention volume corrected for the compressibility of the
carrier gas. VR'
= tR' Fe = (12.61 - 0.23) (28.18) = 348.9 ml and VN = j VR' = (0.9596) (348.9) = 334.8 ml.
• The specific retention volume (VgO)is the net retention volume per gram of stationary phase (either liquid
phase or solid adsorbent) at the column temperature. V
gO
= VN / WL = (334.8) / (1.5115) = 221.5 ml/g. [the
specific retention volume corrected to O°C is Vg
= VgO(273.2 / Tell
that depends on the compressibility of the mobile phase. Mobile phase compressibil-
ity varies over a wide range with gases being the most compressible, liquids the least,
and supercritical fluids in between. The mobile phase compressibility correction fac-
tor, j, allows the calculation of the average mobile phase velocity and solute retention
volumes at the average column pressure from the experimentally measured inlet and
outlet pressures in gas chromatography. The process is outlined for the example given in
Table 1.2. The selection and correct use of the compressibility correction factor has gen-
erated some debate [14-19]. The gas compressibility correction factor can be specified
for the column length or the solute residence time, and for ideal and non-ideal behavior
of the carrier gas, all of which are different [19]. Typical usage, the conversion of vol-
umes measured at the column outlet under ambient conditions into the corresponding
volumes at the pressure averaged over the column length, assuming near ideal behavior
,
General Concepts in Column Chromatography I I
for the carrier gas, is illustrated in Table 1.2. In gas-solid chromatography, the situation
is somewhat different: gas and analyte molecules must compete for adsorption sites
on the stationary phase and distribution constants are likely to be pressure dependent
reflecting the influence of different gas density gradients over the column. Corrected
retention volumes, therefore, are unlikely to be invariant of the column inlet pressure.
The identity of the carrier gas should also
playa
more significant role in establishing
the relative retention order in gas-solid chromatography, as generally observed [20].
Not only variations in the pressure at constant temperature influence column-to-
column retention data: the role of the column hold-up volume as well as the mass
of stationary phase present in the column is also important. The net retention volume
calculated from the adjusted retention volume corrects for the column hold-up volume
(see Table 1.2). The specific retention volume corrects for the different amount of
stationary phase present in individual columns by referencing the net retention volume
to unit mass of stationary phase. Further correction to a standard temperature
of
DoC
is discouraged [16-19]. Such calculations to a standard temperature significantly
distort the actual relationship between the retention volumes measured at different
temperatures. Specific retention volumes exhibit less variability between laboratories
than other absolute measures of retention. They are not sufficiently accurate for solute
identification purposes, however, owing to the accumulation
of
multiple experimental
errors in their determination. Relative retention measurements, such as the retention
index scale (section 2.4.4) are generally used for this purpose. The specific retention
volume is commonly used in the determination of physicochemical properties by gas
chromatography (see section 1.4.2).
It
is normal practice to assume that the typical carrier gases used for gas chromatog-
raphy are ideal. This allows volume corrections to be made using the ideal gas laws
and for gas-solute interactions to be ignored in the interpretation of retention properties.
For the most exact work, it may be necessary to allow for non-ideal behavior of the
gas phase by applying a correction for solute-gas phase interactions [21,22]. For carrier
gases that are insoluble in the stationary phase and at moderate column inlet pressures
Eq. (1.5) is a reasonable approximation
In VN
=In
VN(O)
+ 0.75 [(2B12 -
VI)
/ RT
c
]
[(P
4
-
1) / (P
3
-
1)] Po
(1.5)
where
VN(O)
is the net retention volume at zero column pressure drop,
Btl
the second
interaction virial coefficient of the solute with the carrier gas, V I the solute molar
volume at infinite dilution in the stationary phase (commonly replaced by the bulk
molar volume), R the universal gas constant, P the relative pressure and Po the pressure
at the column outlet (see Table 1.2 for definitions). Under normal operating conditions
errors due to assuming ideality of the gas phase for simple carrier gases like hydrogen,
helium and nitrogen are small, however, they increase with high solute concentrations,
large column pressure drops, and low temperatures. Virial corrections are usually made
only when it is desired to calculate exact thermodynamic constants from retention
volume measurements. Alternatively, high-pressure gas chromatography can be used
12 The Essence
of
Chromatography
to calculate virial coefficients. The number of accurately determined virial coefficients
is small and limits the general application
ofEq.
(1.5).
Liquids are far less compressible than gases and for the majority of applications the
influence of the column pressure drop on the retention factor in liquid chromatography
is ignored. Since the column pressure drop in normal and ultrahigh pressure liquid
chromatography is relatively large this practice might be questionable in some cases
[23-26]. The observed retention factor when calculated from retention time is an average
value reflecting the retention factor gradient over the length of the column. The observed
(average) retention factor has been shown to vary linearly with the inlet pressure in
a solute-specific manner. The slope is usually shallow and unless retention factors
are compared at large inlet pressure differences average retention factor values are
nearly constant. However, it is now clear that retention factors are not invariant of
pressure over the full range of inlet pressures used in modern liquid chromatography,
and this has some implications for determining physicochemical properties by liquid
chromatography but is less important for analysis.
Fluids are highly compressible and density gradients along the column associated
with the column pressure drop result in significant retention factor changes as a
function of local density. These changes are complex and usually modeled by empirical
relationships (section 7.5).
1.4.2 Property Estimations
Gas chromatography is widely used to determine solution and adsorption thermody-
namic properties [21,22,27-32]. Compared to classical static methods it has several
advantages. Measurements can be made for impure samples, very small sample sizes
are sufficient, and easy variation of temperature is provided. For the most exact mea-
surements precise flow, pressure, and temperature control is needed that may require
modification to a standard analytical gas chromatograph. The free energy, enthalpy, and
entropy of mixing or solution, and infinite dilution solute activity coefficients can be
determined from retention measurements made at infinite dilution (Henry's law region)
in which the value of the activity coefficient (also the gas-liquid distribution constant)
can be assumed
to have a constant value. At infinite dilution the solute molecules are
not sufficiently close to exert any mutual attractions, and the environment of each may
be considered to consist entirely of solvent molecules. The activity coefficient and the
specific retention volume are related by V
g =(273.2 R) / (M2YIPI
O
)
where M2 is the
molecular weight of the solvent, YI the solute activity coefficient at infinite dilution,
and
Pj ? the saturation vapor pressure of the pure solute at the given temperature. Ide-
ally, activity coefficients calculated from the above relationship should be corrected for
fugacity (solute-solute interactions), imperfect gas behavior, and interfacial adsorption.
The first two corrections may introduce errors of ca. 1-5% in the value of the activity co-
efficient depending on the circumstances of the measurement; ignoring the importance
of interfacial adsorption as a retention mechanism may make values for the activity
coefficient completely meaningless (section 2.4.1). Typical infinite dilution activity co-
efficients for nonionic solvents, used in gas chromatography, have values in the range
13
General Concepts in Column Chromatography
0.3 to 50 [29,31]. Positive deviations from Raoult's law
(Yl > I) are common for the
high-molecular-weight solvents generally used in gas chromatography. Activity coeffi-
cients much less than one indicate strong solute-stationary phase interactions.
The gas-liquid distribution constant (KL), moles of solute per unit volume of liquid
I
moles of solute per unit volume of gas phase, is evaluated from the specific retention
volume using the relationship V
g
= (273.2
Kj
) I (TcPc) where Pc is the liquid phase
density at the column temperature [32]. Alternatively, extrapolation of the net retention
volume measured at several different phase loadings to an infinite stationary phase
volume allows the gas-liquid distribution constant to be obtained independent of
accompanying contributions from interfacial adsorption (section 2.4.1). The gas-liquid
distribution constant can then be used to calculate values of the specific retention volume
that are corrected for contributions to retention arising from interfacial adsorption. Also
the partial molar Gibbs free energy of solution for a solute at infinite dilution
(~GO)
in
the stationary phase can be obtained directly from the gas-liquid distribution constant
using
~Go
=-RTcln KL. From the slope of a plot of log Vg against the reciprocal of the
column temperature over a narrow temperature range, 10-30 K, the enthalpy of solution
is obtained. The entropy for the same process is obtained from a single value of the
specific retention volume and the value of the enthalpy of solution calculated as just
described [34-36].
Compared to gas chromatography liquid chromatography is used far less for
physicochemical measurements [37,38]. Inadequate knowledge of the true composition
of the stationary phase and the absence of quantitative models for the accurate
description of retention are the principal reasons for this. A few exceptions are
the determination of equilibrium constants that affect the form of a solute in the
mobile phase (ion dissociation, complexation, confirmation, etc.) Also, indirect property
determinations based on quantitative structure - activity relationships (QSAR) and
quantitative structure - property relationships (QSPR) [39-43]. QSAR and QSPR
relationships are based on the identification of an empirical correlation between a
retention property in a chromatographic system, usually the retention factor and
another (usually) equilibrium property of a chemical or biological system. Typical
examples include the octanol-water distribution constant, the distribution of compounds
across biological membranes, aquatic toxicity of organic compounds, the soil-water
distribution constant, etc. These relationships are often, although not exclusively, of
the form log P
=a log k + b where P is some equilibrium dependent property and a and
b are empirical regression constants. Once the correlation equation is established using
known values of log P further values of log P can be estimated from the correlation
equation by measuring their chromatographic retention. This provides an inexpensive
and rapid method for estimating properties that are difficult and expensive to determine
by direct measurement.
1.4.3 Linear Free Energy Relationships
The free energy of transfer of a solute between two phases can be described as the linear
sum of contributing processes delineated by a suitable model. For chromatographic
14 The Essence
of
Chromatography
and liquid-liquid distribution systems a cavity model provides a general approach for
characterizing the contribution of solvent-solvent and solvent-solute interactions to
equilibrium properties [44,45]. Firstly, a cavity of a suitable size to accommodate the
solute is constructed in the solvent, with the solvent molecules in the same state as in
the bulk solvent. The energy required for this process depends on the forces holding
the solvent molecules together, and the solute's size. Cavity formation requires work
and opposes solute transfer. In the second step the solvent molecules are reorganized
into their equilibrium position round the solute. The free energy for this process is
approximately zero and can be neglected. Although it should be pointed out, however,
that the enthalpy and entropy of reorganization may be considerable - the free energy
is effectively zero because of compensation, as in the melting of ice at
a°e.
Finally,
the solute is inserted into the cavity and various solute-solvent interactions are set
up. For nonionic solutes these are identified as dispersion, induction, orientation, and
hydrogen bonding.
If
two condensed phases are involved in the equilibrium then the
free energy of transfer is equivalent to the difference in cavity formation and solute-
solvent interactions in the two phases. For transfer from an ideal gas phase to a solvent
at infinite dilution the free energy of transfer is equal to the difference in free energy of
cavity formation in the solvent and the strength of solute-solvent interactions.
To move from a qualitative to a quantitative picture the individual free energy
contributions to the solvation process identified above must be delineated in a
quantitative form. Within the framework of a linear free energy relationship the
contributions of individual intermolecular interactions are represented as the sum of
product terms made up of solute factors (descriptors) and complementary solvent factors
(system constants). Thus a solute has a certain capability for a defined intermolecular
interaction and its contribution to the solution free energy is the product of the capability
of the solute and solvent for that interaction. Kamlet, Taft and their co-workers [44,46]
developed one of the earliest general approaches to the quantitative characterization of
solute-solvent interactions based on solvatochromism. Solvatochromic parameters were
defined by the influence of environment (solvent effects) on the absorption spectra of
select compounds and normalized to provide roughly equivalent scales. This method
has been widely used to determine the dipolarity/polarizability
(rr *), the hydrogen-
bond acidity
((1) and hydrogen-bond basicity (B) of common solvents [47]. Kamlet,
Taft and their co-workers extended their solvatochromic parameters to solute effects,
assuming that the solvent parameters could be taken as an estimate of solute properties.
This is at best a rough approximation. In a bulk solvent, each molecule is surrounded
by molecules like itself, while as a solute it is surrounded by solvent molecules that
are different to it. Compounds, such as alcohols, that are highly associated as solvents
are expected to behave differently as monomeric solute molecules. However, there
are also fundamental limitations to this approach. The solvatochromic parameters are
related to spectroscopic energy differences, that is the influence of solvent effects on
the ground and excited states of the selected indicator compounds, which are not free
energy processes
per
se. Secondly, although some parameter estimate rules have been
developed, there is no protocol for the determination of the Kamlet-Taft parameters for
15 General Concepts in Column Chromatography
additional (especially solid) compounds.
Inorder to construct a correlation equation that
has a sound physical interpretation, it is necessary that the various descriptors should
be related
to Gibbs free energy. Descriptors meeting this requirement were developed
by Abraham and co-workers [45,48-51] and are to be preferred to the solvatochromic
parameters for chromatographic retention studies and for wider application to solute
properties that can be characterized by a distribution constant. Before describing
Abraham's solvation parameter model, it is necessary to reiterate that the solute
descriptors for the solvation parameter and solvatochromic models are not the same,
although they are often mistaken or misused as such in the contemporary literature. The
solvation parameter model is also unrelated to the solubility parameter model.
The solvation parameter model for distribution between two condensed phases,
Eq. (1.6) or (1.6a), and transfer from the gas phase to a solvent, Eq. (1.7) or (1.7a),
are set out below in the form generally used in chromatography.
log SP
=c +
mVx
+rR2 +
sJt~
+
aL(l~
+
bL~~
(1.6)
log SP
= c + vV + eE + sS +
aA
+ bB
(1.6a)
log SP
=c + rR2 +
sJt~
+
a:E(l~
+
b:E~~
+ !log L
l6
(1.7)
log SP = c + eE + sS +
aA
+ bB + IL
(1.7a)
Eqs. (1.6) and (1.6a) and (1.7) and (1.7a) are identical but written with different sym-
bols. Eqs. (1.6) and (1.7) have been commonly used in the literature following Abra-
ham's description of the solvation parameter model. Recently, Abraham has suggested
replacement of these equations with (1.6a) and (1.7a) to simplify representation of the
model [52,53].
It
is likely that Eqs. (1.6a) and (1.7a) will replace Eqs. (1.6) and (1.7) as
the general representation of the solvation parameter model in the future.
SP is some free energy related solute property such as a distribution constant, reten-
tion factor, specific retention volume, relative adjusted retention time, or retention index
value. Although when retention index values are used the system constants (lowercase
letters in italics) will be different from models obtained with the other dependent vari-
ables. Retention index values, therefore, should not be used to determine system prop-
erties but can be used to estimate descriptor values. The remainder of the equations is
made up of product terms called system constants
(r, s, a, b, I, m) and solute descriptors
(R2,
Jt~
,
:E(l~
,
:E~~
, log L
16
,
Vx).
Each product term represents a contribution from
a defined intermolecular interaction to the solute property. The contribution from cavity
formation and dispersion interactions are strongly correlated with solute size and cannot
be separated if a volume term, such as the characteristic volume
lVx in Eq. (1.6) or V
in Eq. (l.6a)] is used as a descriptor. The transfer of a solute between two condensed
phases will occur with little change in the contribution from dispersion interactions and
the absence of a specific term in Eq. (1.6) to represent dispersion interactions is not a
serious problem. For transfer of a solute from the gas phase to a condensed phase this
16 The Essence
of
Chromatography
Table 1.3
Calculation of solute descriptor values for the solvation parameter model
• Calculation of McGowan's characteristic volurne.Vv (or V), for toluene
Atomic volumes: C
= 16.35, H = 8,71, N = 14,39,
0=
12,43, F = 10,48, Si = 26,83, P = 24.87, S = 22.91, CI
= 20.95, B = 18.23, Br = 26.21, I = 34.53. Subtract 6.56 for each bond of any type.
Toluene
= 7 carbon atoms + 8 hydrogen atoms - 15 bonds = 114,45 + 69.68 - 98,40 = 85.73 in cm
3.mot
l
.
After scaling
Vx
= 0.857 in crn' .mol-I/l 00.
• Calculation of the excess molar refraction,
R2 (or E), for toluene using Eq. (1.8). The refractive index for
toluene
(11)
at 20°C (sodium D-line) = 1.496
R2 = 8.57 (0.292) + 0.5255 - 2.832 (0.857) = 0.601 in cm
3.mol-
11l0.
• Estimation of solute descriptors for 2,6-dimethoxyphenol from liquid-liquid distribution constants.
Vx
and
R
2
were calculated as above giving 1.1743 and 0.840, respectively. Other solute descriptors were obtained as
the best-tit values from the distribution systems given below
Distribution system log K(calc.) log K(exp.) Best-tit values
Water-octanol 1.10 1.15
J"[~
La~
L~~
Water-ether 0.79 0.74 1,41 0.13 0.71
Water-olive oil 0.56 0.57
Water-hexadecane -0.35 -0.36
Water-cyclohexane -0.15 -0.15
is no longer the case and the solvation equation must be set up to account for the contri-
bution of dispersion interactions to the free energy of solute transfer. Abraham handled
this problem by defining a second descriptor for the contribution of cavity formation
and dispersion interactions [log L
16 in Eq. (1.7) or L in Eq. (1.7a)]. This term includes
not only solute-solvent dispersion interactions, but also the cavity effect making the Vx
term in Eq. (1.6) redundant. For general applications Eq. (1.6) is the form of the model
suitable for characterizing chromatographic retention in systems with two condensed
phases, such as liquid and micellar electrokinetic chromatography. Eq. (1.7) is suitable
for characterizing retention in gas chromatography, and more generally in two phase
systems were one component is a gas.
The solute descriptors used in Eq. (1.6) and (1.7) must be free energy related
properties to correlate with chromatographic retention.
It
is also important that the
solute descriptors are accessible for a wide range of compounds by either calculation
or simple experimental techniques, otherwise the models would lack practical utility.
cm
3.mol-
1
/
McGowan's characteristic volume, Vx or V in units of 100, can be
calculated for any molecule whose structure is known by simple summation rules,
Table 1.3 [49,54]. Each atom has a defined characteristic volume and the molecular
volume is the sum of all atomic volumes less 6.56 cm
3.mor
l
for each bond, no matter
whether single, double or triple. For complex molecules the number of bonds, B, is
easily calculated from the algorithm B
= N - I + R where N is the total number of atoms,
and R is the number of rings. Log L
16 or L is the solute gas-liquid distribution constant
(also referred to as the Ostwald solubility coefficient) on hexadecane at 298
K. For
volatile solutes it can be determined directly [50]. For all compounds of low volatility,
it is determined by back calculation from gas chromatographic retention measurements
17 General Concepts in Column Chromatography
on nonpolar stationary phases at any convenient temperature [56-60]. Suitable stationary
phases are those for which the system constants
a
~
b
~
s
~
0 in Eq. (1.7).
The solute excess molar refraction, Rz or E, models polarizability contributions from
n- and rr-electrons, The solute molar refraction is too closely related to solute size to
be used in the same correlation equation as Vx. To avoid correlation between the molar
refraction and Vx, an excess molar refraction, Rz, was defined as the molar refraction
for the given solute, less the molar refraction for an n-alkane of the same characteristic
volume [61,62]. The excess molar refraction is simply calculated from the refractive
index of the solute at 20°C for the sodium D-line,
lj,
as indicated by Eq. (1.8)
(1.8)
The units used for Vx in Eq. (1.8) are cm'
.mol!
1100,
and therefore R
z
is given
in
cm mol'! 1 10. The use
of
Eq. (1.8) to calculate the excess molar refraction
is straightforward for liquids but even for solids refractive index values are easily
estimated using available software for molecular property estimations.
In addition. Rz,
like the molar refraction, is almost an additive quantity, and values for solids can be
estimated through addition
of
fragments with known Rz values [45,63-65].
In developing the solvation parameter model Abraham and coworkers commenced
the process by defining descriptors for solute hydrogen-bond acidity
(Ct~
)and solute
hydrogen-bond basicity
(~~
). The superscript (H) indicates the origin
of
the scale
and the subscript (2) that the descriptors are solute properties. Initially these solute
descriptors were determined from 1:1 complexation constants measured in an inert
solvent [66,67]. These studies also led to scales that had a zero origin. A problem
still remained, however, when these descriptors were used to characterize distribution
processes. The influence
of
solute structure on the distribution process will be a
consequence of hydrogen bonding
of
the solute to any surrounding solvent molecules,
not just to one. What are needed are scales
of
"summation" or "overall" hydrogen
bonding that refer to the propensity
of
a solute to interact with a large excess
of
solvent molecules. These hydrogen-bond descriptors are denoted as L
Ct~
and L
~~
to
distinguish them from the 1:
I descriptors. New values
of
the effective hydrogen bonding
solute descriptors are now determined in conjunction with other solute descriptors
using liquid-liquid distribution and chromatographic measurements [49,68,69]. A minor
complication is that certain solutes (sulfoxides, anilines, pyridines) show variable
hydrogen-bond basicity in distribution systems where the organic phase absorbs
appreciable amounts of water [68]. A new solute descriptor
I:~~
was defined for these
solutes and should be used in octanol-water distribution systems, for example, and for
reversed-phase and micellar electrokinetic chromatography. For the same solutes
L
~~
should be used for all other applications and always for gas chromatography. Except for
the solute types indicated above, the two hydrogen-bond basicity scales are identical.
It
should also be noted that the scales of hydrogen-bond acidity and basicity are generally
unrelated to proton transfer acidity and basicity expressed by the pK
a
scale.
It would be useful to have descriptors that were related to the propensity
of
a solute to
engage in dipole-dipole and induced dipole-dipole interactions.
In the event, it proved