An assessment of water quality in the Lower Mekong Basin pptx
Bạn đang xem bản rút gọn của tài liệu. Xem và tải ngay bản đầy đủ của tài liệu tại đây (2.11 MB, 90 trang )
An assessment of water quality in the
Lower Mekong Basin
MRC Technical Paper
No. 19
November 2008
Meeting the Needs, Keeping the Balance
ISSN: 1683-1489
JER Co4
'
MRC
%'-
14&E O
Mekong River CommissionMRC
1"48LE
Mekong River Commission
An assessment of water quality in the
Lower Mekong Basin
MRC Technical Paper
No. 19
November 2008
11
Published in Vientiane, Lao PDR in November 2008 by the Mekong River Commission
Cite this document as:
MRC (2008) An assessment of water quality in the Lower Mekong Basin. MRC Technical
Paper No.19. Mekong River Commission, Vientiane. 70 pp.
ISSN: 1683-1489
The opinions and interpretation expressed within are those of the author and do not necessarily
reflect the views of the Mekong River Commission.
Editors: E. Ongley and T.J. Burnhill
Graphic design: T.J. Burnhill
Cover photograph: Khoi Tran Minh
© Mekong River Commission
184 Fa Ngoum Road, Unit 18, Ban Sithane Neua, Sikhottabong District,
Vientiane 01000, Lao PDR
Telephone: (856-21) 263 263 Facsimile: (856-21) 263 264
E-mail:
Website: www.mrcmekong.org
Table of Contents
Summary xiii
Introduction 1
1.1 Background 1
1.2
Sources of pollution
3
Methodology
9
2.1 Station network 9
2.2
Benchmark station selection
11
2.3 Data partitioning according to discharge 14
2.4Trend analysis 16
2.5 Water-quality indices and guideline values 16
Water quality assessment 21
3.1 Effects of river discharge on water quality 21
3.2Water quality indices 22
3.3
Trends of individual parameters
31
3.4Transported loads 34
Transboundary water quality
39
4.1 Transboundary areas 39
4.2Transboundary pollution within the Lower Mekong Basin 40
4.3
Transboundary pollution from China
42
Issues concerning water quality in the Lower Mekong Basin 43
5.1 Salinity 43
5.2Acidification 49
5.3 Eutrophication 51
Conclusions
57
References 61
Appendix 1. Primary stations 65
Appendix 2. Secondary stations 67
Appendix 3. Delta stations 69
111
iv
Table of figures
Figure 1.1The Mekong River Basin.
2
Figure 1.2Major ion profiles from tributaries on the Khorat Plateau in 2003.
8
Figure 2.1Development of the station network. 9
Figure 2.2 WQMN in the Lower Mekong Basin, indicating stations sampled in 2005. 10
Figure 2.3 WQMN in the Delta area, indicating stations sampled in 2005. 11
Figure 2.4Definition of the wet and dry seasons, using the hydrograph at Kratie
as an example. 15
Figure 2.5Seasonal variation in conductivity at Chiang Saen. 15
Figure 3.1Normalised flow and concentrations of Calcium and total-P for mainstream
stations in the LMB. 21
Figure 3.2
Median values for WQ classes for mainstream and tributary stations for
the period 2000-2005. 23
Figure 3.3Median values for WQ classes the Delta stations, for the period 2000-2005. 24
Figure 3.4 WQI trends for a selected number of mainstream stations. 28
Figure 3.5 WQI trends for a selected number of tributary stations. 29
Figure 3.6 WQI for tributary stations: Comparison between 1986-2004 and 2005. 30
Figure 3.7 WQI for tributary stations: Comparison between 1986-2004 and 2005. 30
Figure 3.8Example of a time series: Change of nitrate+ nitrite concentrations with time
atChauDoc. 31
Figure 3.9
Selected parameters at mainstream stations (upstream to downstream).
33
Figure 3.10 Distribution of annual transported loads of calcium, silica, sodium, and
chloride at mainstream stations. 35
Figure 3.11 Annual transport of sodium at six mainstream stations. 36
V
vi
Figure 3.12 Annual transport of inorganic nitrogen and total phosphorus at mainstream
stations (upstream to downstream) for 15 year period.
37
Figure 3.13 Annual transport of CODMII at mainstream stations over a 15-year period.
38
Figure 4.1Assessment of transboundary transport of nitrate-N, total-P and CODMII
between selected transboundary locations: Vientiane and Nakhon Phanom,
Pakse and Kratie, and Koh Khel and Chau Doc. 41
Figure 5.1Variation between dry and rainy season in conductivity (salinity) for
selected stations in the Ca Mau peninsula. 44
Figure 5.2Variation in conductivity at Vinh Thaun. 45
Figure 5.3Conductivity values for stations at high and low tide during the same
sampling day. 46
Figure 5.4Changes over time for conductivity (salinity) for a selected number of stations.47
Figure 5.5
Changes over time for conductivity (salinity) for a selected number of
tributary stations from the Khorat Plateau. 48
Figure 5.6The relationship between pH and conductivity. 49
Figure 5.7The relationship between aluminium concentrations and pH-values for
Delta stations.
50
Figure 5.8
The relation between chloride concentration and CODMII for Delta stations. 51
Figure 5.9
The ratio PO4-P/total-P for different types of water in the LMB.
52
Figure 5.10 The relationship between total-N and total-P.
52
Figure 5.11 Concentrations of TSS, total P-PO4P) and CODM in the LMB.
53
Figure 5.12 Comparison of (median) total-P concentrations for the three types of stations
for 1986-2004 and 2005. 55
Figure 5.13 Annual median nitrate-N concentrations for the three types of stations.
Comparison between long-term conditions (1986-2004) and 2005.
55
Figure 5.14 Total-N/total-P ratio for the three types of stations in the LMB. 56
Table of tables
Table 1.1Use of fertilizers in the LMB, (MRC 2003). 6
Table 1.2Losses from paddy rice fields. 6
Table 1.3Estimate of losses of nutrients from agriculture within the LMB. 6
Table 2.1Parameters of the MRC WQMN. 10
Table 2.2
Mainstream benchmark stations. 13
Table 2.3
Tributary benchmark stations. 13
Table 2.4Delta benchmark stations. 14
Table 2.5
Schematic table indicating low flow months for selected stations. 15
Table 2.6Comparison of guideline values relative to the MRC database. 16
Table 2.7
Salinity guidelines for agricultural use of water. 18
Table 3.1Water quality indices for Primary Stations on the mainstream.
25
Table 3.2
Water quality indices for Primary Stations on tribuaries. 26
Table 3.3
Water quality indices for Primary Stations on the Delta. 26
Table 3.4Stations for which transported load can be calculated. 34
Table 3.5
Comparison of median values of selected parameters at mainstream stations
of Vientiane and Nakhon Phanom, with the Nam Songkhram. 37
Table 5.1Conductivity data (mS/m) for the worst affected Delta stations. 43
vii
This paper is based on the work of Anders Wilander, who was contracted to undertake the
review by the Environment Programme of the MRC. The paper was technically edited by
Edwin Ongley, who also provided some of the technical basis for the assessment including
recommendations on water-quality indexes, threshold values for MRC-monitored parameters,
and some assessment methodology. The paper has also been edited to conform to the style of
the MRC Technical Paper series.
ix
x
Abbreviations and acronyms
BOD
Biological Oxygen Demand
CCME Canadian Council of Ministers of the Environment
CERN
China Educational and Research Network
CIIS China Information Services
COD
Chemical Oxygen Demand
DO Dissolved Oxygen
EU
European Union
EEA European Environment Agency
FAO
Food and Agriculture Organization of the United Nations
GEF Global Environment Facility
LMB Lower Mekong Basin
MRC Mekong River Commission
NPSs Non-point sources
PCDD/Fs Dibenzo-p-dioxins/dibenzo furans
RTAG Regional Technical Advisory Group
STATID Station identification
TN Total Nitrogen
TP Total Phosphorus
WQIai
Water Quality Index for aquatic life
WQIhj
Water Quality Index for human impact
WQIag
Water Quality Index for agricultural uses
WQMN Water Quality Monitoring Network
xi
xii
Summary
Water quality is one of the key factors affecting the environmental health of the Mekong river
system. As the livelihoods of most of the 60 million people who live in the Lower Mekong
Basin (LMB) wholly or partly depend on aquatic resources, the environmental health of the
river is a major concern to the governments of the countries in the basin. In 1985, the Mekong
River Commission (MRC) established the Water Quality Monitoring Network (WQMN)
to provide an ongoing record of the water quality of the river, its major tributaries, and the
Mekong Delta. The number of stations sampled has varied over the years since the inception
of the network. Ninety stations were sampled during 2005. Of these, 55 are designated
'Primary Stations' as they have basin wide, or transboundary, significance. The remaining 35
are designated 'Secondary Stations'. Twenty-three of the Primary Stations are located on the
mainstream, (17 on the Mekong, and 6 on the Bassac), 23 on tributaries, and 9 on the Delta.
This report documents an assessment of data recorded from 1985 to 2005 or, in some cases,
the sub-set of data recorded from 2000 to 2005. Three main categories of water-quality indexes
(WQI) are used: (i) for the protection of aquatic life (WQIai) (ii) for human impact (WQIhj), and
(iii) for agricultural use (QWIag) Each WQI category is subdivided into classes according to
the number of chemical parameters (DO, pH, etc.) that meet guideline thresholds. The classes
are: (i) WQIai: High Quality, Good Quality, Moderate Quality, Poor Quality; (ii) WQIh: Not
Impacted, Slightly Impacted, Impacted, Severely Impacted, and (iii) WQIag: No Restrictions,
Some Restrictions, Severe Restrictions.
In the mainstream and tributaries, the WQIai is mostly High Quality. However, in the Delta
only one station is classed as High Quality and two others are Good Quality. Of the remainder,
four are Moderate Quality, and one is Poor Quality. Signs of significant human impact on water
quality (WQIhj) are observed at stations in the uppermost part of the LMB and downstream
of Phnom Penh. The lower index values at the downstream stations reflect higher population
densities, particularly in the highly populated and intensively farmed Delta. At all but one of
Delta stations the WQIhi is classed as Severely Impacted. In the mainstream and tributaries, the
WQIa1 is consistently at the level of No Restrictions. However, at some stations on the Cau Mau
peninsular of the Delta, the WQIa1 is classed as Severe Restrictions.
Three major sources of pollution are evaluated:
1. UrbanAreas. The total discharge from urban areas is 150,000-170,000 tonnes year of
BOD, 24,000-27,000 tonnes/year of total-N, and 7200-8 100 tonnes/year of total-P.
Sewage water from part of Vientiane is collected and discharged to oxidation ponds and
then into the That Luang Marsh. The marsh acts as a 'natural treatment facility', which
reduces both BOD and nutrients. Part of the sewage from Phnom Penh is also discharged
into a wetland downstream. Discharge from rural areas increases the sewage load to the
Mekong and tributaries.
An assessment of water quality in the Lower Mekong Basin
xiv
Industrial wastewater. Industrial development has the potential to increase substantially
the pressure on aquatic resources in the future. At present no information is available on
industrial discharges.
Agriculture. Estimates based on available data suggests a loss of about 225,000 tonnes of
nitrogen and 37,000 tonnes of phosphorus per year. However, these losses are unevenly
distributed; more than 40% of each is likely to be lost from agriculture in northeastern
Thailand and the Delta.
There is no strong evidence for transboundary pollution within the LMB (i.e. between the
Lao PDR and Thailand, the Lao PDR and Cambodia, and Cambodia and Viet Nam). However,
there is some evidence for transboundary transmission of pollutants from the Upper Mekong
Basin into the LMB.
There is no sign of any significant basin-wide trends for any parameter. With the continuing
development of both agriculture (increased use of fertilisers) and urbanisation there is reason to
expect changes in water quality in some tributaries. It is possible that reforestation of areas in
the Khorat Plateau will lead to water-quality improvement.
There are three principal water quality issues in the Lower Mekong Basin:
Salinity. High salinities caused by saltwater intrusion are nearly ubiquitous in the
Delta (but not on the mainstreams of the Mekong and Bassac Rivers). Fifty-four of the
stations analysed have a maximum conductivity greater than the threshold of Some
Restrictions in the WQIagi (for general agricultural use). For nine of these (all of which
are located on the Ca Mau peninsula of the Delta) the WQIagi is at the level of Severe
Restrictions. However, most stations have a short period of No Restrictions for general
irrigation (Sth percentile i.e. statistically less frequent than one month per year). There
is a clear difference between the dry and rainy seasons at most stations. In some of the
Thai tributaries (Nam Kam, Nam Chi, and Nam Mun) improvements in salinity reflect
regulation of the flow of water, which allows higher flow during the most severe part of
the dry season.
Acidification. When exposed to air (oxygen) sulphate soils in the Delta produce sulphuric
acid, which leaches to the canal system. The most severely affected area is the Plain of
Reeds, but similar effects are recorded in some areas in Cambodia. The situation in the
Plain of Reeds seems to improve in the western parts of the canal system that are close to
the Mekong. Further east, there are still times of the year when extremely low pH-values
are measured.
Eutrophication. There is a significant increase in the total-P concentrations at the
mainstream stations, while no such difference is found for the tributaries. At the Delta
stations, there is also a significant increase in total-P concentrations in samples collected
during 2005. Although the concentrations of nitrogen and phosphorus generally are lower
than the threshold values for WQIa1 there most likely is an effect on algae, periphyton
(attached algae on substrata such as stones), and floating aquatic vegetation. It is evident
that the tributaries usually have a surplus of nitrogen, while there is a 'balance' in the
mainstream. Some Delta stations also seem to have surplus nitrogen.
KEY WORDS: Mekong, Lower Mekong Basin, Mekong Delta, water quality, Water Quality
Index, pollution, transboundary issues.
Summary
xv
An assessment of water quality in the Lower Mekong Basin
xvi
1.Introduction
1.1
Background
The livelihoods of most of the 60 million people who live in the Lower Mekong Basin (LMB)
depend to some extent on the water resources of the Mekong River. These livelihoods rely on
the environmental health of the Mekong River and its tributaries remaining in good condition.
Water quality is a key factor in determining environmental health. Under the guidance of
the Mekong River Commission, the four lower riparian countries (the Lao PDR, Thailand,
Cambodia and Viet Nam) have monitored the water quality of the LMB since 1985 (monitoring
of the Cambodian component began in 1993).
The Mekong River is the longest river in South East Asia, the twelth longest in the world,
and the tenth largest by discharge (Dai and Trenberth, 2002). It rises on the Tibetan Plateau and
flows southward through China, Myanmar, the Lao PDR, Thailand, Cambodia and Viet Nam,
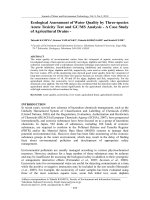
where it discharges into the South China Sea (Figure 1.1). The catchment of the river, which has
an area of 795,000 km2, is functionally divided into two: the Upper Mekong Basin (that flows
southwards through China, where it is called the Lancang River), and the Lower Mekong Basin,
which includes parts of the Lao PDR, Thailand, Cambodia and Viet Nam (Figure 1.1). The river
forms the border between the Lao PDR and Myanmar in the transition zone between the upper
and lower basins. The Mekong River Basin Diagnostic Study (MRC, 1997) and the State of the
Basin Report (MRC, 2003) provide further information on the basin, its water-related resources,
and its inhabitants.
The hydrology of the Mekong system is dominated by the annual monsoon cycle, such that
the discharge during the wet season (from June to November) may be up to twenty times greater
than during the dry season (December to May). Geography also plays an important role in the
annual variation of discharge, as the contribution to the flow coming from the Upper Mekong
Basin varies according to the season. For example, at Kratie (in Cambodia) the so-called
'Yunnan Component' compromises 40% of the dry season flow, but only 15% of the wet season
flow (MRC, 2005). In contrast, 50% of the sediment discharged into the South China Sea from
the Mekong comes from China (MRC, 2004).
An additional hydrological complication occurs downstream near Phnom Penh, where the
Tonle SapGreat Lake system enters the Mekong. During the rainy season excess water from
the Mekong flows 'upstream' in the Tonle Sap and into the Great Lake, causing expansion of
the water body by up to 70% and creating extensive wetlands around the entire lake. During the
dry season, water drains out of the Great Lake back into the Mekong system and then into the
Delta, thereby adding to low flow discharges in the region downstream of Phnom Penh.
Page 1
An assessment of water quality in the Lower Mekong Basin
Page 2
South of Phnom Penh the Mekong divides into the complex distributary system that forms
the Mekong Delta. Here, salinities of up to 1 g/L can extend 70 km upstream of the river mouth,
and tidal influences can be measured as far upriver as Phnom Penh. In the Delta reverse flows
occur daily during the tidal cycle.
The Mekong's complex hydrology makes water-quality monitoring and interpretation
difficult, especially in mainstream stations below Kratie.
Figure 1.1 The Mekong River Basin.
The Mekong's catcbment is geographically diverse. The basin is mountainous in China,
in the north of the Lao PDR, and along the frontier between Viet Nam and the Lao PDR and
Cambodia. The Khorat Plateau, mainly in Thailand, is a vast agricultural area situated on
salt deposits that can affect water quality locally. The tropical Great Lake of Cambodia and
the Tonle Sap river form a unique lacustrine and wetland complex. The water quality of this
complex has been monitored by the MRC since 1993 and as part of a special study on nutrient
and sediment budgets undertaken by the MRC's Water Utilisation Programme'. However, there
has been no systematic or substantial scientific study of the nutrient dynamics of the Great Lake
and it is not known with certainty if the lake is N or P limited. It is known that there is extensive
anoxia in the wetlands surrounding the lake, probably due to oxygen consumption by intensive
Myan ma
0 3OOKr
Li
Upper Mekong Basin
i 1Lower Mekong Basin
China
1 Some of the material in this chapter is taken from MRC (2007a) and from Ongley (2008). The MRC report focuses on toxic
chemicals and is a companion volume to this present paper.
bacterial decay of organic matter in this zone. It is not known if nutrient loadings from the
surrounding land are transported through the wetlands into this shallow lake, or if these loads
are consumed within the wetlands. Despite anoxic conditions, the wetlands are enormously
productive and fish species are adapted to these conditions. The area downstream of Phnom
Penh and the Delta is dominated by agriculture and is densely populated. Caged fish culture,
although prevalent throughout the basin, is particularly intense in the Delta region.
The MRC's Water Quality Monitoring Network (WQMN) has been evaluated several times,
most recently by Lyngby et al. (1997). Ongley (2008) provided an analysis of certain aspects
of water quality in the LMB. However, this current paper is the first attempt to provide a
comprehensive analysis of the entire database covering the period 1985 2005. It focuses on the
main parameters included in the databasemajor ions, nutrients, and certain physicochemical
attributes, such as pH and salinity. The programme does not include toxic chemicals (metals,
pesticides, industrial chemicals, etc.). These were investigated in a special diagnostic study and
have been reported elsewhere (MRC, 2007a).
1.2
Sources of pollution
Upper Mekong Basin
The provincial government of the Yunnan Province in the People's Republic of China, located
immediately upstream of the Chinese/Lao border, is reported to have inspected 1042 industrial
enterprises in the basin in 2000, and shut down four of these (CIIS, 2002). Since 1986, the
Simao Paper Plant and the Lanping Lead-Zinc Mine have been built on the banks of the
Lancang (Mekong) River. In addition to these industrial enterprises, a number of hydropower
stations, including those at Manwan, Dachaoshan, and Jinhong, have been built (or are almost
complete) on the Lancang. Four more hydropower stations are under construction or are
planned for the next 20 years (including Xiaowan, located 550 km upstream of the Chinese/
Lao border', and Nuozhadu). Chinese data for water quality of the Lancang are not accessible
and not shared with the MRC. However, Chinese news sources (e.g. CIlS, 2002) frequently
report that the water of the Lancang meets international standards for drinking water (for
those parameters for which Chinese agencies routinely monitor). MRC (2007a) notes that
ecotoxicological assessment carried out for the MRC on the Lao side of the Chinese border
suggests that at this site there is some toxicity that requires further investigation.
Lower Mekong Basin
In the LMB, there are few sources of pollution that contribute directly to the Mekong.
Thailand's contribution to pollution in the basin is mainly limited to salt leaching from
the subsurface of the Khorat Plateau. There are no data that suggest that areas of irrigated
1 The largest hydroelectric dam in China after the Three Gorges Dam on the Yangtze River, CERN (2002).
Introduction
Page 3
An assessment of water quality in the Lower Mekong Basin
Page 4
agriculture or the limited industrial development in Thailand within the Mekong Basin are
significant contributors of pollution to the mainstream of the Mekong.
Municipal wastewater
The two largest urban areas (Vientiane in the Lao PDR, and Phnom Penh in Cambodia) are
of concern as they lie on the banks of the Mekong. Currently, Vientiane, a city of less than
500,000 inhabitants, discharges its municipal sewage into the That Luang Marsha wetland
that discharges into the Mekong River some distance downstream of Vientiane. This discharge
is small at this time and is not thought to pose any immediate risk to the mainstream of the
Mekong. However, development of Vientiane city (including substantial land reclamation in the
That Luang Marsh for urban and industrial purposes) is a concern, and may pose greater threats
to the mainstream in the future.
Phnom Penh, a city of approximately 1.7 million inhabitants, also discharges much of
its urban sewage into a series of wetlands that drain into the Bassaca distributary of the
Mekong. Additionally, certain industrial and municipal discharges as well as storm-water
runoff, discharge directly into the Tonle Sapa tributary of the Mekong. The MRC (2007),
reports local pollution of an industrial nature in the Tonle Sap at Phnom Penh. However, it is
not certain whether or not this poses any significant risk either locally or downstream. There is a
substantial riparian population in Phnom Penh that occupies housing located on piles along the
margin of the river. There are also a number of floating villages on the Great Lake of Cambodia.
These populations discharge domestic sewage directly into the water column. However, the
loading and significance of these discharges are not known.
Using population statistics and data on urban sanitation coverage' for year 2000 for the LMB
(MRC, 2003), and person equivalent loads of BOD, total-N and total-P, total municipal waste
load is estimated at 150,000 170,000 tonnes/year of BOD, 24,000-27,000 tonnes/year of
total-N, and 7200-8100 tonnes/year of total-P.2 However, much of this load is not transported
directly to rivers insofar as 'black water' (human excreta) in many urban areas (e.g., most of
Vientiane) is disposed through domestic septic/leaching systems or collected by truck from
household holding tanks and deposited into municipal lagoons, and leaching pits (for grey
water). Therefore, the actual municipal waste load discharged to rivers should be less than the
estimated amounts.
Person equivalent loads.
Substance g/person/day
BOD 30
Total-P
2.4
Total-N 8
1 'Coverage' includes septic systems, pour/flush latrines, pit toilets as well as piped waste discharge (MRC, 2003).
2 The range of values is a result of varying estimates of urban sanitation coverage.
In the Mekong Delta, the Vietnamese cities of Tan Chau and Chau Doc, on the Mekong and
the Bassac Rivers respectively, are major urban centres and are subject to tidal influences. River
pollution identified at these locations is probably attributable to local sources, but there has
been no definitive work on transboundary transport of pollutants from upstream. Analysis of
transboundary risk concluded that the current data could neither support nor deny the presence
of transboundary pollution between Cambodia and Viet Nam (Hart et al., 2001).
Industrial development
The scale of industrial development in the LMB is relatively low. There are no data or specific
information on the role of industry in water pollution of the mainstreams of the Mekong or
Bassac rivers. The MRC (2007a) reports that in 2003 and 2004 the full suite of industrial
contaminants was below detection level in water samples. Analysis of these same contaminants
in bottom sediment found that a small number of sites in the downstream component showed
minor effects of industrial contamination.
Agriculture and non-point source pollution
Fertiliser
Agriculture has developed substantially in the LMB since the start of water quality monitoring,
with an increase in paddy fields of nearly 40% overall, and a doubling og paddy-field area in
Viet Nam (MRC, 1988, 2003). Both the increase in yield and area cropped has led to large
increases in production of paddy rice. In the past decade alone, rice production has increased
tremendouslyby 81% in Cambodia, 38% in the Lao PDR, 33% in northeast Thailand, and
(over four years) by 27% in Viet Nam (MRC 2003). Some of this increase is due to cultivation
of larger areas, but there has also been a major increase in use of fertilizers (Table 1.1).
Agriculture, therefore, is a potential contributor of nutrients to rivers in the LMB. In addition to
the expansion and intensification of paddy rice production, there is also significant production
of other crops such as maize, cassava and sugar cane.
Little is known about losses of nutrients from agriculture in tropical climates and none about
such losses in the LMB. A literature search (Table 1.1) for comparable types of agriculture
provides a basis for estimating nutrient loss for the LMB. The composition of fertilizers used
in the LMB also is not known, but it is likely in the order of 30% N and 10% P. In Viet Nam
there are fertilizers with a N content of 10 18% and a P content of 5 16%. A large portion of
applied fertilizer is probably urea with a N content of 46%.
Introduction
Page 5
Page 6
Table 1.2 Losses from paddy rice fields. Application as kg/ha/year (Data from literature search.)
Losses of nutrients are correlated with fertilizer application. Using conservative values
for losses of 20% and 10% for N and P respectively, and a fertilizer composition of 30% N
and 10% P, the estimated loss of N and P is shown in Table 1.3. These losses are unevenly
distributed, with more than 40% of each likely to be lost in northeast Thailand and in the Delta.
Table 1.3 Estimate of losses of nutrients from agriculture within the LMB.
Cambodia 474
79
Lao PDR 486 81
Thailand 108,102 18,017
VietNam 116,076 19,346
Non-point sources
There have been no studies of the effects of non-point source pollution on the water quality of
the Mekong River. There is anecdotal evidence of the use of mercury in artisanal placer gold
extraction upstream of the Great Lake of Cambodia and in the mainstream in the Lao PDR
and possibly in some tributaries of the Mekong. Large-scale caged fish culture that lines the
banks of the Mekong and Bassac rivers downstream of the Cambodian! Viet Nam border are
likely sources of non-point source pollutants. In-stream caged fish culture occurs elsewhere
throughout much of the LMB, but it is not on such a large scale. Discharge of human waste
from all river vessels plying the Mekong, especially tour boats in the reach extending upstream
from Luang Prabang (Lao PDR) to the China border, and accidental spills from river barge
traffic, are water quality threats. Recent hydraulic works to enhance barge traffic on the Mekong
in the section between China and northern Lao PDR may increase the potential to potential for
An assessment of water quality in the Lower Mekong Basin
Table 1.1 Use offertilizers in the LMB, (MRC 2003).
Country
Total t/year Total t/year Use in kg/ha/year Use in kg/ha/year
1989 1999 1989 1999
Cambodia
Lao PDR
Thailand
VietNam
3000
3000
818,800
563,000
7900
8100
1,801,700
1,934,600
0.1
0.4
39.8
88.2
2.1
8.5
100.1
263.2
Total 1,387,800 3,752,300
Korea 155-210 30-52 57-65 8.8-9.4
China 64 42
Korea 20 10
Country Application N Application P Loss N % Loss P %
Country Loss N t/year Loss Pt/year
Total
225,138 37,523
Introduction
marine spills. Other types of pollution from non-point sources, such as residual dioxins/furans
from use of Agent Orange during the American War, were detectable in bottom sediments at
low levels at some downstream sites (MRC, 2007a).
Mining
Mining activities are likely to increase in the LMB. At present, mining is intensive in parts of
the Lao PDR and in areas of Cambodia near the Thai border. There is currently no information
on water quality issues arising from the extraction and processing of ores. Large-scale gold
extraction uses cyanide, although well-constructed retention dams control leaching of cyanide
and other heavy metals. In the LMB, the main potential problems with mining are likely to be
associated with catastrophic failure of retention dams (tailings dams), poorly constructed or
managed retention dams, and spill of chemicals such as cyanide during transport on the Mekong
river. The MRC (2007a) reports that the diagnostic study could not find cyanide in water or
bottom sediments above the detection limit. Artisanal placer (gold) mining using mercury
could be an issue in the LMB, but mercury associated with sediments has been found above the
'Threshold Effects Level' at only three downstream sites (MRC, 2007a). This mercury may be
from industrial sources.
Exploration for oil and gas in Cambodia, the Lao PDR, and Thailand could lead to water-
quality problems if commercial quantities of hydrocarbons are found.
Toxic organic contaminants and pesticides
Until recently there has been very limited research or other data on organic contaminants in
the Mekong River Basin. Evidence presented at the 2' Asia Pacific International Conference
on Pollutants Analysis and Control indicates that there is little evidence of persistent organic
pesticides even in parts of the basin where it is known there has been high levels of use
(e.g. agricultural pesticides used intensively in parts of Thailand). In a recent major study of
contaminants, the MRC (2007a) reported on organic contaminants in water and on bottom
sediments, including polychlorinated dibenzo-p-dioxins/dibenzo furans (PCDD/Fs). Generally,
the level of organic contaminant pollution is very low with most contaminants being less than
levels of detection. Pesticides in water were not detectable, however analysis of pesticides on
sediments is inconclusive due to the detection limits being well above thresholds of biological
concern. Limited bioassay analysis indicates low levels of toxicity at a few sites (MRC, 2007a).
Salinity and Acidification
Salinity has been frequently identified as a potential pollution issue. Two areas are notable for
their high salinities. The first is the Khorat Plateau in Thailand, where the natural leaching of
rock salt drains via the Nam Mun into the Mekong at Khong Chiam. The second is in the Delta,
where saline intrusion is common Although the MRC (2007a) found abundant evidence of
Page 7