Advances in Steel Structures - part 4 potx
Bạn đang xem bản rút gọn của tài liệu. Xem và tải ngay bản đầy đủ của tài liệu tại đây (642.67 KB, 10 trang )
10 D.A. Nethercot and J.S. Hensman
STEP 1
Define frame geometry
STEP 2
Define load types and magnitude
(1) Gravity
(2) wind
NOTE: This flow chart is not a design procedure.
It should be used only as a 'first check', to
determine if the wind-moment method outlined
in this document is a suitable design method for
the frame in question.
STEP 3
Design composite beams as
simply supported with a capacity
of 0.9Mp
STEP 4
Estimate required column
sections
I.
I
,
I
I
The frame design is likely to be controlled
by SLS sway. However, a suitable frame
design may still be achieved using the
wind-moment method.
Consider increasing the member sizes.
l
STEP 5
Predict the SLS sway using
the method in Section 5 Design the frame as rigid, or include
vertical bracing.
~ ~ ~ Using the wind-moment method to
~" Is the t~alframe ~ Is the to!al frame ~ design this frame for ULS is likely
sway <.n:.~uu: / ~ sway <h:200? J " to result in unsatisfactory SLS
~ sway behaviour~
~
Yes
~ ] Using the wind-moment method to
~. ~ ~_ _ ~ _. [design this frame for the ULS is likely]
to result in unsatisfactory inter-storey I
sway behaviour. Design frame as I
rigid at the 1st storey level, or include I
~e ~ vertical bracing.
s ~ es I
I
/
Design the frame using the I The bottom storey SLS sway is likely
wind-moment method,as ] to control the frame design.
detailed in this document. Increasing the column section sizes
may resolve this problem; if not then
it may be appropriate to use an
alternative method.
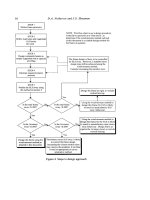
Figure 4 Steps in design approach
Unbraced Composite Frames." Application of the Wind Moment Method 11
critical for the design of internal columns when heavy imposed loads are present on long span
beams.
For beam design under gravity loading an end restraint moment of 10% of the maximum sagging
moment in the beam should be assumed. For horizontal loading, frame analysis should be by the
"portal method".
Composite beams should be Class 1 designed for 90% of their plastic moment of resistance at mid-
span. This provision has been introduced so as to ensure that adequate rotation capacity is present
in the composite connections to develop the required span moment. Previous studies, Li, Choo
and Nethercot, (1995), Nethercot, Li and Choo, (1995), have shown both that the available rotation
capacity of composite connections is limited and that the non-linear relationship between beam span
design moment and the amount of moment redistribution necessary to achieve this substantially
reduces the rotational demands on the connections.
Columns, which are assumed to be of bare steel, should be designed by the usual interaction
formula approach. Effective lengths for in-plane and out of plane checks should be taken as 1.5L
and 1.0L respectively. Column end moments should allow for both the end restraint moment due
to partial fixity when considering gravity loading and the moments calculated due to horizontal
loading.
Connections must be designed for both maximum hogging and minimum sagging loads in
recognition of the fact that wind loading can reverse.
The parametric study indicated deflections under serviceability loading to be of the order of 30%
greater than those calculated assuming rigid joints due to the greater overall flexibility of the frames
with semi-rigid connections. Rather than permit the use of any method for the determination of
sway deflections, a development of that proposed by
Wood and Roberts, (1975), that employed a simple graphical technique is proposed. In this way the
common drift limit of h/300 recommended by BS5950: Part 1 and EC3 may be achieved. In
addition to considering the behaviour of the complete frame, it is important to check each individual
story. The first story is likely to be the most critical, typically accounting for the percentage of total
frame sway indicated in Table 3.
CONCLUSIONS
Based on the findings of a careful numerical study that employed a synthesis of the best currently
available scientific evidence, proposals for the application of the Wind Moment Method to the
design of a restricted range of unbraced composite frames have been made. In application, these
closely follow the established procedure of the SCI Design Guide for bare steel frames. The
background study has, however, recognised the need to properly consider the behaviour of both the
composite beams and the composite connections; it has also recognised the desirability of using
less than fully rigid column bases. In deriving the design procedure, account has been taken of
industry wishes, important practical differences in the likely configuration of composite frames
from steel frames and recent changes in the general structural design climate in the UK.
12
REFERENCES
D.A. Nethercot and J.S. Hensman
Ackroyd, M (1987), Design of flexibly connected unbraced steel building frames,
Journal
Constructional Steel Research,
No 8, pp 261-286.
Ackroyd, M H and Gerstle, K H (1982), Behaviour of type II steel frames,
Journal of the Structural
Division ASCE,
Vol. 108, No 7, pp 1541-1556.
Ahmed, B and Nethercot, D A (1997), Design of composite flush end-plate connections,
The
Structural Engineer,
Volume 75, No. 14, pp 233-244.
Anderson, D, Reading S, J and Kavianpour, K (1991),
Wind-moment design for unbraced frames,
The Steel Construction Institute, Publication No 082.
Hensman, J S (1998),
Investigation of the wind moment method for unbraced composite frames,
MPhil thesis, Department of Civil Engineering, University of Nottingham.
Hensman, J S and Nethercot, D A, (2000a) Utilisation of test data for column bases when
addressing overall frame response: a review,
Advances in Structural Engineering,
to be published
Hensman, J S and Nethercot, D A, (2000b) "Numerical studies of composite sway frames:
Generation of Data to Validate Wind Moment Method of design",
to be published.
Kavianpour, K (1990),
Design and analysis of unbraced steel frames,
PhD thesis, University of
Warwick.
Li, T Q, Choo, B S and Nethercot, D A (1995), Determination of Rotation Capacity Requirements
for Steel and Composite Beams,
Journal of Constructional Steel Research,
Vol. 32, pp. 303-332.
Li, T Q, Nethercot, D A and Choo, B S (1993), Moment curvature relations for steel and composite
beams,
Steel Structures, Journal of Singapore Structural Steel Society,
Volume 4, No. 1, pp 35-51.
Nethercot, D A, Li, T Q and Choo, B S (1995), Required Rotations and Moment-Redistribution for
Composite Frames and Continuous Beams,
Journal of Constructional Steel Research,
Vol. 35. No.
2, pp. 121-164.
Reading, S J (1989), Kavianpour, K (1990), Anderson, D, Reading S, J and Kavianpour, K (1991)
Investigation of the wind connection method,
MSc thesis, University of Warwick,
Wood, R H and Roberts, E H (1975), A graphical method of predicting sidesway in multistorey
buildings,
Proceedings Institution of Civil Engineers,
Part 2, Vol. 59, pp 353-272.
Ye Mei-Xin, Nethercot, D A and Li, T Q (1996), Non-linear finite element analysis of composite
frames,
Proceedings Institution of Civil Engineers, Structures and Buildings,
Volume 116, pp 244-
247.
A CUMULATIVE DAMAGE MODEL FOR
THE ANALYSIS OF STEEL FRAMES
UNDER SEISMIC ACTIONS*
Zu-Yan Shen I
~State Key Laboratory for Disaster Reduction in Civil Engineering,
Tongji University, Shanghai, 200092, China
ABSTRACT
Based on a series of experiments and theoretical analysis, a cumulative damage mechanics model of
steel under cyclic loading, hysteresis models for plane and space steel members with damage
cumulative effects and a cumulative damage model for steel frames under seismic actions are
presented. Using these cumulative damage models, the elasto-plastic response of steel framed
structures sustained the major shock and successive aftershocks of an earthquake can be calculated
and the performance of the structures can be predicted more precisely and more realistically. In order
to verify the theoretical results and the acceptability of the cumulative damage models, shaking table
tests were conducted by the author in the State Key Laboratory for Disaster Reduction in Civil
Engineering of Tongji University.
KEYWORDS
Cumulative damage model, Steel framed structures, Seismic response, Shaking table test
INTRODUCTION
The collapse of structures is usually due to the cumulation of damage to certain extent. In order to take
the cumulation of damage into account in analysis, damage mechanics has been developed,
Kachnov(1986). But up to now few of the research results have been used in the seismic analysis of
steel framed structures. Recently Shen and Dong (1997) suggested an experiment-based cumulative
damage mechanics model for steel subjected to cyclic loading. Shen et al (1998) derived a hysteresis
model for plane steel members with damage cumulative effects. Since these research results can take
the damage cumulative effects into consideration, it becomes possible to establish an analysis
approach for calculating the elasto-plastic response of steel framed structures sustained the major
shock and successive aftershocks of an earthquake.
~ National Key Projects on Basic Research and Applied Research: Applied Research on Safety and Durability of Major Construction
Projects
13
14 Z Y. Shen
In the paper, a cumulative damage model for steel framed structures under seismic actions is
established. The performance of the structures subjected to a major shock and successive aftershocks
of an earthquake can be analyzed and the extent of damage including the damage cumulation of the
structures after each shock can be calculated. Shaking table tests were conducted by the author in the
State Key Laboratory for Disaster Reduction in Civil Engineering of Tongji University for verifying
the theoretical analysis.
CUMUALTIVE DAMAGE MECHANICS MODEL OF STEEL UNDER CYCLIC LOADING
A cumulative damage mechanics model of steel under cyclic loading was established by the author,
Shen and Dong (1997). The model can be expressed as follows.
Damage index D is calculated by
" ~ C - 6g
D = (l-ill e'-eg +fl~ (11
C
-
6g
.= 6=" -
6g
where N is the number of half cycles which cause plastic strain, fl is the weight value, 6 p is the
P is the plastic strain during the ith half cycle, 6 p is the ultimate plastic strain of the material and 6.
largest plastic strain during all halfcycles.
The effects of damage on elastic modulus, yield strength and strain hardening coefficient are
E o
= (1-4D)E
tro = (1 - ~2D)tr,
(2)
where D is the damage index, D = 0 means no damage and D = 1 means complete failure of the
material, E and
E n are the
elastic modulus in respect of D = 0 and D, respectively, tr s is the
initial yield stress when D = O, try is the yield stress in respect of D, k 0 is the original strain
hardening Cbefficient and k (") is the strain hardening coefficient after the nth halfcycle. ~:~, ~:2 and ~3
are three material parameters.
And the cumulative damage mechanics model of the steel under cyclic loading is
for first half cycle
(3)
from the second half cycle,
Cumulative Damage Model for the Analysis of Steel
f! = erA.+, + ED(')(C CA.+, )
ac 2 -~-
b g + c
O'Cn+l -I-
k(')ED(')(c - Cc.+,)
I~176 - ~
to? '~
?'or. ~ < [era,,+ , -o" I < (2 + r/)cr~ <')
IOta.,+,- or] > (2 + r/)cr~ ~
(4)
15
where ~s and es are the initial yield stress and strain, CA~+, and eAn+~ axe the stress and strain at
unloading point A of the (n+ 1)th halfcycle, ~cn+, and ecn+, are the stress and strain at stress hardening
point C of the (n+l)th halfcycle, y and r/ are two material parameters and
a, band c are the
constants of the parabolic curve connecting the yielding point B and the stress hardening point C.
The cumulative damage mechanics model can be illustrated by Figure 1.
Figure 1: Hysteretic model of steel considering damage cumulation
For steel Q235, all the material parameters can be adopted according to Table 1.
TABLE 1
MATERIAL PARAMETERS FOR DAMAGE
MECHANIC MODEL OF STEEL Q235
0.0081 0.227 0.119 Eqn. 5 0.000073 1.44 0.041
- 0.014-016 t,m i+ 1 l:l'm I - I
(5)
PRECISE HYSTERESIS MODEL OF STEEL MEMBERS WITH DAMAGE CUMULATION
EFFECTS
Shen and Lu have developed a powerful integration method to calculate the behavior of steel members,
Shen and Lu (1983). The method can analyze strength problems and stability problems as well, taking
into account the effects of initial geometrical and physical imperfections including residual stresses of
the steel member and can give the complete load-deflection relationship of the member including both
the ascending and descending branches.
16
Z Y. Shen
Since the basic required input of the integration method is the stress-strain relationship of material, the
method can be used to obtain the hysteresis model of steel members with damage cumulation effects,
if we take the cumulative damage mechanics model of steel under cyclic loading as the input of the
method.
Two experiments conducted by the author, Li et al. (1999), were calculated for verifying the proposed
method. The material properties and the sectional dimension of the H section columns are shown in
Table 2. or, and 6, denote yield stress and yield strain, respectively, crb and 6,, are ultimate stress
and ultimate strain, respectively, b and h are the width and height of the section and t, and
tf are
the thickness of the web and the flange, respectively.
TABLE 2
MATERIAL PROPERTIES AND SECTIONAL DIMENSION
OF H-SECTION COLUMNS
E crs crb 6~ 6= h b
tf
t w
(MPa) (MPa) (MPa) (mm) (mm) (mm) (mm)
1.972x 10⁵ 290.08 440.67 0.00147 0.19978 176 160 8 8
The column specimens are cantilevers with length 1100mm. For specimen A, there are only two
horizontal forces acting at the top, and for specimen B, there are two horizontal forces and one
constant vertical force with magnitude 300kN acting at the top. The loading path of the specimens are
shown in Figure 2 and the comparison between calculation and tests can be seen in Figure 3, where
Px and Py are the horizontal forces applied on the top ends of the tested column specimens, and Dx
and Dy are
the corresponding horizontal displacements. In Figure 3, the test results are shown by
solid lines, and the calculated results by dashed lines. The comparison shows that using the method
proposed, a precise hysteresis curve can be obtained by theoretical analysis.
Figure 2: Loading path of the tested specimens
Cumulative Damage Model for the Analysis of Steel
17
Figure 3" Comparison of measured and calculated results
SIMPLIFIED HYSTERESIS MODEL OF STEEL MEMBERS WITH DAMAGE
CUMULATION
EFFECTS
In order to put the model into practice, the author has established a simplified hysteresis model for
plane steel members with damage cumulation effects, Shen et al. (1998). The model can be extended
to spatial steel members with damage cumulation effects.
The hysteresis parameter for a spatial member at nth loading can be expressed as the same as the
plane member, Shen at al. (1998), if the ~o denotes the yield function of the spatial member.
[k(1-~,D)
(for
(P < (Ps,n)
1
~o - fps,,
+(k-l)
] (for ~os., <(p < ~Op.,) (6)
J
(for q) > ~Op, n )
where D is called equivalent damage index of the cross-section to be substituted for the actual
damage,
.~ IDidA~
D - (7)
A
is the area of the ith subsection, D, is the damage index of the ith subsection. ~o is the yield
function for the spatial member. ~os, . and ~Op,, denote the value of initial yield and the perfect yield
during the nth loading, respectively, and k is the strain hardening coefficient. The yield function for
the spatial member has been developed by many authors, Chen and Austra (1976), Duan and Chen
(1990), Kitipomchai et al. (1991 ).
When damage and plastic yield occur at both ends of the spatial member, the elasto-plastic tangent
stiffness matrix can be expressed by the following equation
18
Z Y.
Shen
[KpD]
= [Ke]-[K,][G][E][L][E]r[G]r[K,]
(8)
where
[Ke]
is the elastic stiffness matrix of the spatial member element, [G],[E] and [L] can be
obtained from the reference, Li et al. (1999)
The same experiments mentioned in the above section can be used for verifying the simplified
hysteresis model for spatial members with damage cumulation effects. Figure 4 shows the comparison
of the test results and the calculated results using the simplified hysteresis model, in which the test
results are shown by solid lines and the calculated results by the dashed lines.
Figure 4: Comparison of tested results and calculated results
The comparison illustrates that the accuracy of the simplified hysteresis model is quite good and the
model is acceptable for practical analysis.
After every half cycle of loading the strain of every subsection can be calculated, the damage index
D~ of the subsection is obtained by using Eqn. 1 and hence the equivalent damage index /9 of the
member is also obtained by Eqn. 7. Summing up the equivalent damage of all previous half cycles of
loading, the cumulated damage index of the member can be obtained.
At the end of loading the cumulated damage index of specimen A and B are 0.121 and 0.305,
respectively.
The simplified hysteresis model not only can be used to imitate the actual hysteresis curves of spatial
members but also has several unique advantages.
First, it can be used to analyze the hysteresis behavior of a member with initial damage, if the initial
damage index is known. Second, it can get the damage index and emulated damage index of a
member after loading. And third, it can be used to analyze the behavior of members subjected to the
seismic loading more than one times.
NONLINEAR DYNAMIC ANALYSIS OF STEEL FRAMES WITH CUMULATIVE DAMAGE
EFFEXTS UNDER SEISMIC ACTION
Cumulative Damage Model for the Analysis of Steel 19
From the ealsto-plastic tangent stiffness matrix, Eqn. 8, for spatial steel member with damage
cttmualtion effects, the global tangent stiffness matrix [Kpo ] of the spatial steel frames can be easily
assembled. Then the deferential equation of dynamic equilibrium for the frames can be built as
follows
[M] {A6} + [C] {AS} + [Kpo] {A6} = [MI[E]{A6g } (9)
where [M] is the mass matrix of the structure, [C] is the damping matrix of the structure, {6} is
the displacement vector of the structure and {6g } is the acceleration vector of ground movement.
Solving the above equation, the displacement response of the structure can be determined. Through
the displacement, the damage index of each member can be calculated.
In order to verify the proposed method, a shaking table test was conducted by the author. Figure 5
shows the sketch of the spatial steel frame model used for shaking table test. All of the members are
H-typed cross-sections. Node numbers are given in Figure 5.
A3 ,1 ?/~ //~x,2
5
77
2400
Figure 5 Sketch of the frame model.
TABLE 3
MATERIAL PROPERTIES
E(MPa) o- s (MPa) o- b (MPa) 6s 6= ~' 6
2.03x 10⁵ 228.44 369.51 0.00113 0.204 64.76% 34.45%
TABLE 4
SECTIONAL DIMENSION OF H-SECTION BEAMS AND COLUMNS
b(mm) h(mm) tw (mm) t y (mm)
Beams 100 150 5 5
Columns 100 120 5 5
The material properties and the sectional dimension of the H-section members are shown in Table 3