You should spend about 20 minutes on this task 16 pptx
Bạn đang xem bản rút gọn của tài liệu. Xem và tải ngay bản đầy đủ của tài liệu tại đây (50.54 KB, 2 trang )
You should spend about 20 minutes on this task.
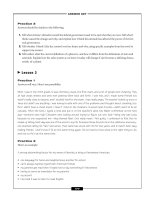
The graph above show information of employment rates across 6 countries
in 1995 and 2005.
Summarize the information by choosing and describe the main idea, and
make comparisons where appropriate.
You should write at least 150 words.
model answer:
The graph shows changes in employment rates in six countries between 1995 and
2005, for men and women. Overall more and more people of working age are
employed, and there have been significant improvements for women, although they
leg behind men in entering the workforce.
The most obvious trend in the graph is that women have lower employment rates in
most of the countries in the graph. For example, in Australia in 1995, 57 percent of
men could find work or retain a job, but only 27 percent of women. The difference
was even bigger in New Zealand, with 60 percent of women. Even in Switzerland and
Iceland, alightly more men than women were in the job market.
The second biggest trend in the graph is the improvement in employment between
1995 and 2005. In all countries shown, figures for both men and women improved.
The biggest change was in the United Kingdom, from 55 percent of men in 1995 to
73 percent over the ten years period.
Furthermore, the increases in employment rates for women were much higher in
New Zealand. The percentage of working women jumped from 25 percent to 42
percent, and in the United States from 45 percent to 61 percent over the decade.
In conclusion, all the countries in the graph showed at least a 12 percent increase in
employment rates of both men and women over the ten yeares. While men had
relatively higher employment rate throughout the period, more and more women
appear to be entering the labour market.