You should spend about 20 minutes on this task 17 pptx
Bạn đang xem bản rút gọn của tài liệu. Xem và tải ngay bản đầy đủ của tài liệu tại đây (45.05 KB, 2 trang )
You should spend about 20 minutes on this task.
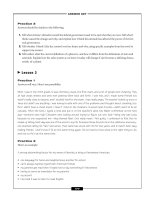
The line graph below gives information on cinema attendance in the UK.
Write a report for a university lecturer describing the information given.
You should write at least 150 words.
model answer:
The given line graph illustrates information on the percentage of people who went to
the movies in the United Kingdom between 1990 and 2010. The people's attendance
is divided into four different age groups.
Overall, younger people seemed to, and are predicted to, be more active in movie
going than their older counterparts. However, all four age groups showed a gradual
increase in attendance numbers during the given period, except for a slight drop
between 1995 and 2000.
To be specific, a larger percentage of people between the ages of 24 and 34 went to,
and are expected to, go to the cinema than those in any other age group.
Approximately 51% of the respondents from this age group are expected to attend
movies in 2010 compared with only 38% in 1990. Even in the group that had the
smallest number of movie goers, those between the ages of 44 and 54, there was an
increase of 6% in their attendance.
(161 words)