a study of injection locking and pulling in oscillator
Bạn đang xem bản rút gọn của tài liệu. Xem và tải ngay bản đầy đủ của tài liệu tại đây (793.54 KB, 10 trang )
IEEE JOURNAL OF SOLID-STATE CIRCUITS, VOL. 39, NO. 9, SEPTEMBER 2004
1415
A Study of Injection Locking and Pulling
in Oscillators
Behzad Razavi, Fellow, IEEE
Abstract—Injection locking characteristics of oscillators are de-
rived and a graphical analysis is presented that describes injection
pulling in time and frequency domains. An identity obtained from
phase and envelope equations is used to express the requisite os-
cillator nonlinearity and interpret phase noise reduction. The be-
havior of phase-locked oscillators under injection pulling is also
formulated.
Index Terms—Adler’s equation, injection locking, injection
pulling, oscillator nonlinearity, oscillator pulling, quadrature
oscillators.
I
NJECTION of a periodic signal into an oscillator leads
to interesting locking or pulling phenomena. Studied by
Adler [1], Kurokawa [2], and others [3]–[5], these effects have
found increasingly greater importance for they manifest them-
selves in many of today’s transceivers and frequency synthesis
techniques.
This paper describes new insights into injection locking and
pulling and formulates the behavior of phase-locked oscillators
under injection. A graphical interpretation of Adler’s equation
illustrates pulling in both time and frequency domains while
an identity derived from the phase and envelope equations
expresses the required oscillator nonlinearity across the lock
range.
Section II of the paper places this work in context and
Section III deals with injection locking. Sections IV and V
respectively consider injection pulling and the required oscil-
lator nonlinearity. Section VI quantifies the effect of pulling
on phase-locked loops (PLLs) and Section VII summarizes the
experimental results.
I. G
ENERAL CONSIDERATIONS
Oscillatory systems are generally prone to injection locking
or pulling. As early as the 17th century, the Dutch scientist
Christiaan Huygens, while confined to bed by illness, noticed
that the pendulums of two clocks on the wall moved in unison if
the clocks were hung close to each other [6]. He postulated that
the coupling of the mechanical vibrations through the wall drove
the clocks into synchronization. It has also been observed that
humans left in isolated bunkers reveal a “free-running” sleep-
wake period of about 25 hours [7] but, when brought back to
the nature, they are injection-locked to the Earth’s cycle.
Manuscript received December 16, 2003; revised March 17, 2004.
The author is with the Department of Electrical Engineering, University of
California, Los Angeles, CA 90095 USA (e-mail: ).
Digital Object Identifier 10.1109/JSSC.2004.831608
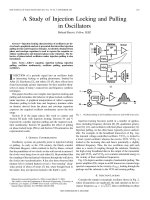
Fig. 1. Oscillator pulling in (a) broadband transceiver and (b) RF transceiver.
Injection locking becomes useful in a number of applica-
tions, including frequency division [8], [9], quadrature genera-
tion [10], [11], and oscillators with finer phase separations [12].
Injection pulling, on the other hand, typically proves undesir-
able. For example, in the broadband transceiver of Fig. 1(a),
the transmit voltage-controlled oscillator,
, is locked to
a local crystal oscillator whereas the receive VCO,
,is
locked to the incoming data and hence potentially a slightly
different frequency. Thus, the two oscillators may pull each
other as a result of coupling through the substrate. Similarly,
the high-swing broadband data at the output of the transmitter
may pull
and as it contains substantial energy in
the vicinity of their oscillation frequencies.
Fig. 1(b) depicts another example of undesirable pulling. The
power amplifier (PA) output in an RF transceiver contains large
spectral components in the vicinity of
, leaking through the
package and the substrate to the VCO and causing pulling.
II. I
NJECTION LOCKING
Consider the simple (conceptual) oscillator shown in Fig. 2,
where all parasitics are neglected, the tank operates at the res-
onance frequency
(thus contributing no phase
0018-9200/04$20.00 © 2004 IEEE
1416 IEEE JOURNAL OF SOLID-STATE CIRCUITS, VOL. 39, NO. 9, SEPTEMBER 2004
Fig. 2. (a) Conceptual oscillator. (b) Frequency shift due to additional phase
shift. (c) Open-loop characteristics. (d) Frequency shift by injection.
shift), and the ideal inverting buffer follows the tank to create a
total phase shift of 360
around the feedback loop. What hap-
pens if an additional phase shift is inserted in the loop, e.g., as
depicted in Fig. 2(b)? The circuit can no longer oscillate at
because the total phase shift at this frequency deviates from 360
by . Thus, as illustrated in Fig. 2(c), the oscillation frequency
must change to a new value
such that the tank contributes
enough phase shift to cancel the effect of
. Note that, if the
buffer and
contribute no phase shift, then the drain current
of
must remain in phase with under all condi-
tions.
Now suppose we attempt to produce
by adding a sinu-
soidal current to the drain current of
[Fig. 2(d)]. If the am-
plitude and frequency of
are chosen properly, the circuit in-
deed oscillates at
rather than at and injection locking
occurs. Under this condition,
and must bear a phase
difference [Fig. 3(a)] because: 1) the tank contributes phase at
, rotating with respect to the resultant current,
, and 2) still remains in phase with and hence out
of phase with respect to
, requiring that form an angle
with
. (If and were in phase, then would also be
in phase with
and thus with ). The angle formed be-
tween
and is such that becomes aligned with
(and ) after experiencing the tank phase shift, ,at .
In order to determine the lock range (the range of
across
which injection locking holds), we examine the phasor diagram
of Fig. 3(a) as
departs from . To match the increasingly
greater phase shift introduced by the tank, the angle between
and must also increase, requiring that rotate coun-
terclockwise [Fig. 3(b)]. It can be shown that
(1)
(2)
Fig. 3. Phase difference between input and output for different values of
and
.
which reaches a maximum of
(3)
if
(4)
Depicted in Fig. 3(c), these conditions translate to a 90
angle
between the resultant and
, implying that the phase differ-
ence between the “input,”
, and the output, , reaches a
maximum of
. To compute the value of cor-
responding to this case, we first note that the phase shift of the
tank in the vicinity of resonance is given by (Section III-A)
(5)
and recognize from Fig. 3(c) that
and
. It follows that
(6)
(This result is obtained in [3] using a different approach.) We
denote this maximum difference by
, with the understanding
that the overall lock range is in fact
around .
1
The dependence of the lock range upon the injection level,
, is to be expected: if decreases, must form a greater
angle with
so as to maintain the phase difference between
and at [Fig. 3(d)]. Thus, the circuit moves closer to
the edge of the lock range.
As a special case, if
, then (2) reduces to
(7)
1
We call the “one-sided” lock range.
RAZAVI: STUDY OF INJECTION LOCKING AND PULLING IN OSCILLATORS 1417
Fig. 4. Phase shift in an injection-locked oscillator.
implying that is small and . Equations (5)
and (7) therefore give
(8)
for the input-output phase difference across the lock range. As
evident from Fig. 3(c), for
this difference reaches
90
at the edge of the lock range, a plausible result because if
the zero crossings of the input fall on the peaks of the output,
little phase synchronization occurs. The lock range in this case
can be obtained from (6) or (8):
(9)
The subtle difference between (6) and (9) plays a critical role in
quadrature oscillators (as explained below).
Fig. 4 plots the input-output phase difference across the lock
range. In contrast to phase-locking, injection locking to
mandates operation away from the tank resonance.
1) Application to Quadrature Oscillators: With the aid of a
feedback model [13] or a one-port model [14], it can be shown
that “antiphase” (unilateral) coupling of two identical oscillators
forces them to operate in quadrature. It can also be shown [14]
that this type of coupling (injection locking) shifts the frequency
from resonance so that each tank produces a phase shift of
(10)
where
denotes the current injected by one oscillator into
the other and
is the current produced by the core of each
oscillator. Use of (5) therefore gives the required frequency shift
as
(11)
Interestingly, (9) would imply that each oscillator is pushed
to the edge of the lock range, but (6) suggests that for, say,
Fig. 5. (a) Injection-locked divider. (b) Equivalent circuit.
, the lock range exceeds (9) by 3.3%. In other
words, for a 90
phase difference between its input and output,
an injection-locked oscillator need not operate at the edge of the
lock range.
2) Application to Dividers: Fig. 5(a) shows an injec-
tion-locked oscillator operating as a
stage [15]. While
previous work has treated the circuit as a nonlinear function to
derive the lock range [15], it is possible to adopt a time-variant
view to simplify the analysis. Switching at a rate equal to the
oscillation frequency,
and form a mixer that translates
to , with the sum component suppressed by the
tank selectivity. Thus, as depicted in Fig. 5(b), injection of
at into node is equivalent to injection of (where
is the mixer conversion gain) at directly into the
oscillator. If
and switch abruptly and the capacitance at
node
is neglected, then , and (9) can be written as
(12)
If referred to the input, this range must be doubled:
(13)
Confirmed by simulations, (13) represents the upper bound on
the lock range of injection-locked dividers.
III. I
NJECTION PULLING
If the injected signal frequency lies out of, but not very far
from the lock range, the oscillator is “pulled.” We study this
behavior by computing the output phase of an oscillator under
low-level injection.
A. Phase Shift Through a Tank
For subsequent derivations, we need an expression for the
phase shift introduced by a tank in the vicinity of resonance. A
second-order parallel tank consisting of
, , and exhibits
a phase shift of
(14)
1418 IEEE JOURNAL OF SOLID-STATE CIRCUITS, VOL. 39, NO. 9, SEPTEMBER 2004
Since , and
,wehave
(15)
If the current flowing through the tank contains phase modula-
tion, i.e.,
, then the phase shift can be
obtained by replacing
in (15) with the instantaneous input fre-
quency,
:
(16)
Valid for narrow-band phase modulation (slowly-varying
),
this approximation holds well for typical injection phenomena.
B. Oscillator Under Injection
Consider the feedback oscillatory system shown in Fig. 6,
where the injection is modeled as an additive input. The output
is represented by a phase-modulated signal having a carrier fre-
quency of
(rather than ). In other words, the output is
assumed to track the input except for a (possibly time-varying)
phase difference. This representation is justified later. The ob-
jective is to calculate
, subject it to the phase
shift of the tank, and equate the result to
.
The output of the adder is equal to
(17)
(18)
The two terms in (18) cannot be separately subjected to the tank
phase shift because phase quantities do not satisfy superposition
here. Thus, the right-hand side must be converted to a single
sinusoid. Factoring
and defining
(19)
we write
(20)
Since
and ,wehave
,
and hence
(21)
Upon traveling through the LC tank, this signal experiences
a phase shift given by (16):
(22)
Fig. 6. LC oscillator under injection.
Equating this result to , we obtain
(23)
We also note from (19) that
(24)
(25)
(26)
It follows from (23), (24), and (26) that
(27)
(28)
Originally derived by Adler [1] using a somewhat different ap-
proach, this equation serves as a versatile and powerful expres-
sion for the behavior of oscillators under injection.
Under locked condition,
, yielding the same result
as in (9) for the lock range. If
, the equation must
be solved to obtain the dependence of
upon time. Note that
is typically quite small because, from (28), it reaches a
maximum of only
. That is, varies slowly
under pulling conditions.
Adler’s equation can be rewritten as
(29)
Noting that
, making a
change of variable
, and carrying out the inte-
gration, we arrive at
(30)
where
.
2
This paper introduces a
graphical interpretation of this equation that confers insight into
the phenomenon of injection pulling.
2
Interestingly, is equal to the geometric mean of (the
difference between
and the upper end of the lock range) and
(the difference between and the lower end of the lock range).
RAZAVI: STUDY OF INJECTION LOCKING AND PULLING IN OSCILLATORS 1419
Fig. 7. Phase variation of an injection-pulled oscillator.
C. Quasi-Lock
Let us first examine the above result for an input frequency
just below the lock range, i.e.,
but
. Under this condition, is relatively small,
and the right-hand side of (30) is dominated by the first term
so long as is less than one, approaching a
large magnitude only for a short duration [Fig. 7(a)]. Noting that
the cycle repeats with a period equal to
, we plot as shown in
Fig. 7(b). The key observation here is that
is near 90 most of
the time—as if the oscillator were injection-locked to the input
at the edge of the lock range. At the end of each period and the
beginning of the next period,
undergoes a rapid 360 change
and returns to the quasi-lock condition [Fig. 7(c)].
We now study the spectrum of the pulled oscillator. The spec-
trum has been analytically derived using different techniques
[4], [5], but additional insight can be gained if the results in
Fig. 7 are utilized as the starting point. The following obser-
vations can be made. 1) The periodic variation of
at a rate of
implies that the output beats with the input, exhibiting side-
bands with a spacing of
. Note that is a function of both
and (and hence the injection level). 2) Since the
oscillator is almost injection-locked to the input for a large frac-
tion of the period, we expect the spectrum to contain significant
energy at
.
Redrawing Fig. 7(b) with the modulo-
transitions at the end
of each period removed [Fig. 8(a)] and writing the instantaneous
Fig. 8. Instantaneous frequency and spectrum of an injection-pulled oscillator.
frequency of the output as ,
we obtain the result depicted in Fig. 8(b). The interesting point
here is that, for
below the lock range, the instantaneous
frequency of the oscillator goes only above
, exhibiting a
peak value of
as obtained from (28). That is, the output
spectrum contains mostly sidebands above
.
We now invoke a useful observation that the shape of the spec-
trum is given by the probability density function (PDF) of the
instantaneous frequency [16]. The PDF is qualitatively plotted
in Fig. 8(c), revealing that most of the energy is confined to
the range
and leading to the actual spectrum in
Fig. 8(d). The magnitude of the sidebands drops approximately
linearly on a logarithmic scale [4], [5].
Is it possible for one of the sidebands to fall at the natural
frequency,
? The following must hold: ,
where
is an integer. Thus, . Since
is out of the lock range, the left side of this equation exceeds
unity and no value of
can place a sideband at . We therefore
say the oscillator is “pulled” from its natural frequency. This
1420 IEEE JOURNAL OF SOLID-STATE CIRCUITS, VOL. 39, NO. 9, SEPTEMBER 2004
Fig. 9. Pulling behavior for injection somewhat far from the lock range.
also justifies the use of —rather than —for the carrier
frequency of the output in Fig. 6.
D. Fast Beat
It is instructive to examine the results obtained above as
deviates farther from the lock range while other parameters re-
main constant. Rewriting (30) as
(31)
we recognize that the vertical offset decreases whereas the slope
of the second term increases. The right-hand side therefore ap-
pears as depicted in Fig. 9(a), yielding the behavior shown in
Fig. 9(b) for
. Thus, compared to the case illustrated in Fig. 7:
1) the beat frequency increases, leading to a wider separation of
sidebands; 2)
stays relatively constant for a shorter part of the
period and exhibits a faster variation at the beginning and end;
and 3) the instantaneous frequency is near
for a shorter du-
ration [Fig. 9(c)], producing a smaller spectral line at this fre-
quency. In fact, if
is sufficiently far from , the energy at
Fig. 10. One-port representation of an oscillator under injection.
falls below that at the next sideband [Fig. 9(d)].
Eventually, the components at
and have approx-
imately equal levels [4], [5].
Interestingly, the analyses in [4] and [5] only reveal the spec-
trum in Fig. 9(d). On the other hand, the approach presented
here, particularly the use of the PDF of the instantaneous fre-
quency, correctly predicts both quasi-lock and fast beat condi-
tions.
In quadrature oscillators, pulling may occur if the frequency
mismatch between the two cores exceeds the injection lock
range. With insufficient coupling, the oscillators display a
behavior similar to that depicted in Figs. 7 and 9. Note that the
resulting sidebands are not due to intermodulation between the
two oscillator signals. For example, the spacing between the
sidebands is a function of the coupling factor.
IV. R
EQUISITE
OSCILLATOR
NONLINEARITY
Our analysis of injection locking and pulling has thus far ig-
nored nonlinearities in the oscillator. While this may imply that
a “linear” oscillator
3
can be injection pulled or locked, we know
from the superposition principle that this cannot happen. Specif-
ically, a linear oscillator would simply generate a sinusoid at
in response to an initial condition and another at is response
to the input. To resolve this paradox, we reexamine the oscilla-
tory system under injection, seeking its envelope behavior.
In this case, it is simpler to model the oscillator as a one-
port circuit consisting of a parallel tank and a mildly nonlinear
negative conductance (Fig. 10), where
represents the loss of
the tank. For example,
and the inverting buffer in Fig. 2(a)
constitute a negative
cell. In this circuit
(32)
Now let us assume
and
, where denotes the
envelope of the output. Substituting the exponential terms in
(32) and separating the real and imaginary parts, we have
(33)
(34)
3
A linear oscillator can be defined as one in which the loop gain is exactly
unity for all signal levels.
RAZAVI: STUDY OF INJECTION LOCKING AND PULLING IN OSCILLATORS 1421
To simplify these equations, we assume: 1) the envelope varies
slowly and by a small amount; 2) the magnitude of the envelope
can be approximated as the tank peak current produced by the
circuit, , multiplied by the tank resistance
;3) ;4)
where applicable; and 5) the phase and its derivatives vary
slowly. Equations (33) and (34) thus reduce to
(35)
(36)
The first is Adler’s equation, whereas the second expresses the
behavior of the envelope.
To develop more insight, let us study these results within the
lock range, i.e., if
. Writing
gives the following useful identity:
(37)
For
(38)
that is, the circuit responds by weakening the
circuit (i.e.,
allowing more saturation) because the injection adds in-phase
energy to the oscillator. On the other hand, for
,
we have
, as if there is no injection. Fig. 11 illustrates
the behavior of
across the lock range.
While derived for a mildly-nonlinear oscillator, the above re-
sult does suggest a general effect: the oscillator must spend less
time in the linear regime as
moves closer to .A“linear”
oscillator therefore does not injection lock.
V. P
HASE NOISE
The phase noise of oscillators can be reduced by injection
locking to a low-noise source. From a time-domain perspective,
the “synchronizing” effect of injection manifests itself as cor-
rection of the oscillator zero crossings in every period, thereby
lowering the accumulation of jitter. This viewpoint also reveals
that the reduction of phase noise depends on the injection level,
and it reaches a maximum for
[Fig. 12(a)] (where the
zero crossings of
greatly impact those of ) and a min-
imum for
[Fig. 12(b)] (where the zero crossings
of
coincide with the zero-slope points on ).
Using the one-port model of Fig. 10 and the identity ex-
pressed by (38), we can estimate the phase noise reduction
in a mildly nonlinear oscillator that is injection-locked to a
noiseless source. As depicted in Fig. 13, the noise of the tank
and the
cell can be represented as a current source .In
the absence of injection, the (average) value of
cancels
, and experiences the following transimpedance:
(39)
Fig. 11. Variation of across the lock range.
Fig. 12. Conceptual illustration of effect of injection locking on jitter (a) in
the middle and (b) at the edge of the lock range.
Fig. 13. Model for studying phase noise.
Thus, is amplified by an increasingly higher gain as the noise
frequency approaches
.
4
Now suppose a finite injection is applied at the center of the
lock range,
. Then, (38) predicts that the overall tank
admittance rises to
. In other words,
the tank impedance seen by
at falls from infinity (with no
injection) to
under injection locking. As the fre-
quency of
deviates from continues to dom-
inate the tank impedance up to the frequency offset at which
the phase noise approaches that of the free-running oscillator
(Fig. 14). To determine this point, we equate the free-running
noise shaping function of (39) to
and note that
and
(40)
Thus, the free-running and locked phase noise profiles meet at
the edges of the lock range.
4
For very small frequency offsets, the noise shaping function assumes a
Lorentzian shape and hence a finite value.
1422 IEEE JOURNAL OF SOLID-STATE CIRCUITS, VOL. 39, NO. 9, SEPTEMBER 2004
As illustrated in Fig. 12(b), if the input frequency deviates
from
, the resulting phase noise reduction becomes less pro-
nounced. In fact, as
approaches either edge of the lock
range,
drops to zero, raising the impedance seen by
the noise current.
In CMOS technology, it is difficult to rely on the phase noise
reduction property of injection locking. Since the lock range is
typically quite narrow and since the natural frequency of oscil-
lators incurs significant error due to process variations and poor
modeling, the locking may occur near the edge of the lock range,
thereby lowering the phase noise only slightly. For example, if
the two-sided lock range is equal to
% and the natural fre-
quency of the oscillator varies by
% with process and tem-
perature, then, in the worst case, the injection locking occurs at
. It follows from (37) and the above obser-
vations that the impedance seen by the noise falls from infinity
to
, yielding a 4.4-dB degradation in the phase
noise compared to the case of
.
VI. I
NJECTION PULLING IN
PHASE-LOCKED OSCILLATORS
The analysis in Section III deals with pulling in nominally
free-running oscillators, a rare case of practical interest. Since
oscillators are usually phase-locked, the analysis must account
for the correction poduced by the PLL. In this section, we as-
sume the oscillator is pulled by a component at
while phase-
locked so as to operate at
. We also assume that the oscillator
control has a gain of
and contains a small perturbation,
, around a dc level.
Examining the derivations in Section III for a VCO, we ob-
serve that (19) and (21) remain unchanged. In (22), on the other
hand, we must now add
to . For small pertur-
bations,
can be neglected in the denominator of
and
(41)
Equating the phase of (41) to
and noting that (24) and
(26) can be shown to still hold, we have
(42)
Fig. 15 shows a PLL consisting of a phase/frequency detector
(PFD), a charge pump (CP), and a low-pass filter (
and ),
and the VCO under injection. Since with a low injection level,
the PLL remains phase-locked to
, it is more meaningful to
express the output phase as
rather than . Thus,
and
(43)
(44)
where it is assumed
radian. This approximation is rea-
sonable if pulling does not excessively corrupt the PLL output.
Fig. 14. Reduction of phase noise due to injection locking.
Fig. 15. PLL under injection pulling.
The above result can now be used in a PLL environment. In
Fig. 15, the PFD, CP, and loop filter collectively provide the
following transfer function:
(45)
where the negative sign accounts for phase subtraction by the
PFD. We therefore have
(46)
Substituting for
in (44) and differentiating both sides with
respect to time, we obtain
(47)
where
. This reveals that the PLL behaves
as a second-order system in its response to injection pulling.
Defining
(48)
(49)
we have
(50)
where
denotes the phase of the transfer function at a frequency
of
.
5
5
A dual-loop model developed by A. Mirzaei arrives at a similar result but
with a different value for the peak amplitude of the cosine [17].
RAZAVI: STUDY OF INJECTION LOCKING AND PULLING IN OSCILLATORS 1423
Fig. 16. (a) LC VCO. (b) Die photograph.
Fig. 17. Measured spectrum of free-running oscillator under injection. (a) Quasi-lock. (b) Fast beat.
Fig. 18. Measured spectrum of (a) free-running oscillator under injection, and (b) phase-locked oscillator under injection.
Equation (50) leads to several interesting and important
observations. First, the VCO output phase is modulated sinu-
soidally, thereby creating only two symmetric sidebands (for
low injection). The sidebands reside at
, i.e., at
and . Second, (46) suggests that the control voltage
also varies sinusoidally at a frequency of
, possibly serving
as a point for monitoring the strength of pulling. Third, the
peak value of
in (50) and hence the sideband magnitudes
vary with
; in fact, they approach zero for both
and , assuming a peak in between. This is because
the PLL suppresses the effect of pulling if
is well
within the loop bandwidth and the oscillator pulling becomes
less significant if
is large.
The bandpass behavior of the peak phase in (50) stands in
sharp contrast to the response of PLLs to additive phase at the
output of the VCO. For example, the VCO phase noise experi-
ences a high-pass transfer to the output.
The symmetry of sidebands can also be interpreted with the
aid of the relationship between the shape of the spectrum and the
PDF of the instantaneous frequency,
. If the sidebands were
1424 IEEE JOURNAL OF SOLID-STATE CIRCUITS, VOL. 39, NO. 9, SEPTEMBER 2004
Fig. 19. Measured profile of sidebands.
asymmteric, so would the PDF of be. That is, would
spend more time at one of its extremes. The PLL would then
apply a greater correction at that extreme, eventually creating a
symmetric spectrum.
The foregoing analysis assumes a first-order loop filter and
continuous-time loop operation. The addition of a second ca-
pacitor from the oscillator control line to ground and the dis-
crete-time nature of the loop lead to sideband magnitudes that
are somewhat different from those predicted by (50). For this
reason, circuit simulations are often necessary to determine the
sideband levels accurately.
VII. E
XPERIMENTAL RESULTS
A 1-GHz charge-pump phase-locked loop including a cir-
cuit has been designed and fabricated in 0.35-
m CMOS tech-
nology. Fig. 16(a) shows the LC oscillator and the method of in-
jection, with the transistor widths shown in microns (the lengths
are equal to 0.35
m), and Fig. 16(b) depicts the die photo.
The distinction between quasi-lock and fast beat cases is
demonstrated in the spectra of Fig. 17 for the free-running oscil-
lator. Here, the injected level is approximately 38 dB below the
oscillation level
6
and the lock range is equal to 1.5 MHz. In-
deed, for injection 110 kHz outside the lock range, [Fig. 17(a)],
the sideband at
displays the largest magnitude. As
further deviates from the lock range (710 kHz outside the lock
range), the component at
becomes dominant.
Fig. 18(a) and (b) compares the output spectrum before and
after phase-locking, respectively. Here, the injected level is ap-
proximately 53 dB below the oscillation level. As the analysis
in Section III predicts, the sidebands become symmetric after
the loop is closed. The left sideband in Fig. 18(b) is located at
and is slightly larger than the right one. This is because
also feeds through the oscillator to the output. In other words,
if
is moved to above , then the right sideband becomes
larger. Measurements also confirm that the spectrum remains
symmetric even for a very small charge pump current—but the
sidebands rise in both magnitude and number.
Fig. 19 plots the profile of the sidebands as
varies from
to large values, confirming the bandpass behavior of pulling.
These results agree well with simulations. The theoretical pre-
dictions overestimate the peak of this profile by about 7 dB.
6
This is derived from the measured lock range: .
REFERENCES
[1] R. Adler, “A study of locking phenomena in oscillators,” Proc. IEEE,
vol. 61, pp. 1380–1385, Oct. 1973.
[2] K. Kurokawa, “Injection locking of microwave solid-state oscillators,”
Proc. IEEE, vol. 61, pp. 1336–1410, Oct. 1973.
[3] L. J. Paciorek, “Injection locking of oscillators,” Proc. IEEE, vol. 53, pp.
1723–1727, Nov. 1965.
[4] H. L. Stover, “Theoretical explanation of the output spectra of unlocked
driven oscillators,” Proc. IEEE, vol. 54, pp. 310–311, Feb. 1966.
[5] M. Armand, “On the output spectrum of unlocked driven oscillators,”
Proc. IEEE, vol. 59, pp. 798–799, May 1969.
[6] A. E. Siegman, Lasers. Mill Valley, CA: University Science Books,
1986.
[7] R. R. Ward, The Living Clocks. New York: Alfred Knopf, 1971.
[8] V. Manassewitsch, Frequency Synthesizers, 3rd ed. New York: Wiley,
1987.
[9] E. Normann, “The inductance-capacitance oscillator as a frequency di-
vider,” in Proc. IRE, vol. 24, Oct. 1946, pp. 799–803.
[10] C. J. M. Verhoeven, “A high-frequency electronically tunable quadrature
oscillator,” IEEE J. Solid-State Circuits, vol. 27, pp. 1097–1100, July
1992.
[11] A. Rofougaran et al., “A 900 MHz CMOS LC oscillator with quadrature
outputs,” in IEEE ISSCC Dig. Tech. Papers, Feb. 1996, pp. 392–393.
[12] J. Kim and B. Kim, “A low phase noise CMOS LC oscillator with a ring
structure,” in IEEE ISSCC Dig. Tech. Papers, Feb. 2000, pp. 430–431.
[13] T. P. Liu, “A 6.5 GHz monolithic CMOS voltage-controlled oscillator,”
in IEEE ISSCC Dig. Tech. Papers, Feb. 1999, pp. 404–405.
[14] B. Razavi, Design of Integrated Circuits for Optical Communica-
tions. New York: McGraw-Hill, 2002.
[15] H. R. Rategh and T. H. Lee, “Superharmonic injection-locked frequency
dividers,” IEEE J. Solid-State Circuits, vol. 34, pp. 813–821, June 1999.
[16] H. E. Rowe, Signals and Noise in Communication Systems. Princeton,
NJ: Van Nostrand, 1965.
[17] A. Mirzaei, private communication.
Behzad Razavi (S’87–M’90–SM’00–F’03) received
the B.Sc. degree in electrical engineering from Sharif
University of Technology, Tehran, Iran, in 1985 and
the M.Sc. and Ph.D. degrees in electrical engineering
from Stanford University, Stanford, CA, in 1988 and
1992, respectively.
He was an Adjunct Professor at Princeton Univer-
sity, Princeton, NJ, from 1992 to 1994, and at Stan-
ford University, Stanford, CA, in 1995. He was with
AT&T Bell Laboratories and Hewlett-Packard Labo-
ratories until 1996. Since 1996,he has been Associate
Professor and subsequently Professor of electrical engineering at the University
of California, Los Angeles. He si the author of Principles of Data Conversion
System Design (IEEE Press, 1995), RF Microelectronics (Prentice Hall, 1998)
(also translated into Japanese), Design of Analog CMOS Integrated Circuits
(McGraw-Hill, 2001) (also translated into Chinese and Japanese), and Design of
Integrated Circuits for Optical Communications (McGraw-Hill, 2003), and the
editor of Monolithic Phase-Locked Loops and Clock Recovery Circuits (IEEE
Press, 1996), and Phase-Locking in High-Performance Systems (IEEE Press,
2003). His current research includes wireless transceivers, frequency synthe-
sizers, phase locking and clock recovery for high-speed data communications,
and data converters.
Dr. Razavi received the Beatrice Winner Award for Editorial Excellence at
the 1994 IEEE International Solid-State Circuits Conference (ISSCC), the best
paper award at the 1994 European Solid-State Circuits Conference, the Best
Panel Award at the 1995 and 1997 ISSCC, the TRW Innovative Teaching Award
in 1997, and the Best Paper Award at the IEEE Custom Integrated Circuits Con-
ference in 1998. He was the co-recipient of both the Jack Kilby Outstanding
Student Paper Award and the Beatrice Winner Award for Editorial Excellence
at the 2001 ISSCC. He has been recognized as one of the top ten authors in the
50-year history of ISSCC. He served on the Technical Program Committees of
the ISSCC from 1993 to 2002 and the VLSI Circuits Symposium from 1998
to 2002. He has also served as Guest Editor and Associate Editor of the IEEE
J
OURNAL OF
SOLID-STATE CIRCUITS, IEEE T
RANSACTIONS ON CIRCUITS AND
SYSTEMS, and the International Journal of High Speed Electronics.Heisan
IEEE Distinguished Lecturer.