A guide to writing in economics
Bạn đang xem bản rút gọn của tài liệu. Xem và tải ngay bản đầy đủ của tài liệu tại đây (1.05 MB, 63 trang )
A Guide to Writing
in Economics
Prepared by Paul Dudenhefer, Writing Tutor, EcoTeach
Center and Department of Economics, Duke University
Second Edition ©2007 by Paul Dudenhefer
2
A Guide to Writing in Economics
Prepared by Paul Dudenhefer, Writing Tutor, EcoTeach Center
and Department of Economics, Duke University
Introduction 4
Part I: Writing and Scholarly Argumentation 5
1. Writing a Paper—a Good Paper 6
2. The Paper as a Whole 7
3. Making Arguments: Claim, Reasons, Evidence—or, How to Ace that
Essay Exam 8
4. Making
Economic
Arguments 10
Part II: The Writing of Economics: A Discipline-Specific Exami-
nation 12
5. Writing about Evidence 13
5a. Writing about Models 13
5b. Writing about Data 14
5c. Reporting Data and Results in Tables 15
5d. Tables and Text: Writing about Your Results 17
6. Writing Literature Reviews 19
7. Writing History-of-Thought Papers 20
8. Writing Book Reviews 21
9. Writing Abstracts 22
Part III: Bookends: Introductions and Conclusions 24
10. Introductions 25
10a. General Content of Introductions 25
10b. Yes, But How to Actually Begin a Paper? 28
10c. Introductions: Summing Up 31
11. Conclusions 31
Part IV: Economists Do It With . . .
Style
? 34
Part V: Eight Principles of Clear, Cohesive, and Coherent Writ-
ing 37
3
Part VI: Final Words 44
Appendices
Genres of Economics Writing 46
Sample Model Section 48
Sample Data Sections 52
Sample Literature Review 55
Sample Book Review 57
Sample Introduction 59
4
Introduction
When I tell people that I am the writing tutor for the economics department, I am usually met
with a surprised reaction. And why not? Most people associate writing with the English depart-
ment and, only to a slightly lesser extent, with the other disciplines in the humanities; they do
not normally associate writing with economics and the other sciences. You may be one of them.
You may be asking yourself, What does writing have to do with economics? Well, a lot, as it
turns out. Economists, as much or even more than other scholars and analysts, write. Although
we may think of economics as involving problem sets or mathematics, the fact nevertheless re-
mains that the results of economic research are “written up.” At least three-fourths of econom-
ics articles, especially empirical papers, is text, not equations or tables. Assistant economics
professors must publish articles to earn tenure; economic staffers at research institutes and other
financial organizations write reports and other documents; economists hired as research consult-
ants produce written reports detailing their results; members of the president’s Council of Eco-
nomic Advisers write reports and briefings. The list could go on. “In talking about the econo-
mist’s craft,” says Richard Schmalensee, an economist at MIT, “it is almost impossible to over-
state the importance of clear and persuasive writing.” Writing is as much a part of economics as
models and data sets.
What follows is a writing manual for the Department of Economics at Duke University.
As such, it responds to the writing demands of the undergraduate curriculum at Duke. But it
also discusses writing in a more general way, for writing in economics involves a mix of gen-
eral principles of writing and discipline-specific conventions of writing. The manual is divided
into six parts. The first part, “Writing and Scholarly Argumentation: A Broad View,” addresses
aspects of paper writing in general, including a discussion of how to make economic arguments.
Part II, “The Writing of Economics: A Discipline-Specific Examination,” looks at how to write
certain genres of economics papers: empirical papers (in the discussion about evidence), litera-
ture reviews, abstracts, and so forth. The third part examines introductions and conclusions.
What kinds of information are usually contained in an introduction, and how is it organized?
How should one end a paper? In part IV we consider style: its virtues and vices. Part V offers a
few principles that can promote good writing. A few closing remarks are presented in Part VI.
You’ll find examples of economics writing in a series of appendices at the end of the
manual. Most of these samples have been annotated in an effort to point out clearly the conven-
tions and features that are present in economics writing.
5
Part I
Writing and Scholarly
Argumentation
1. Writing a Paper—a Good Paper
2. The Paper as a Whole
3. Making Arguments: Claim, Reasons,
Evidence—or, How to Ace that Essay
Exam
4. Making
Economic
Arguments
6
Part I: Writing and Scholarly Argumentation: A Broad View
Writing a paper is one of the most intellectually exciting, satisfying, and challenging enterprises
you will undertake as a student at Duke. It is also a highly complex cognitive and scholarly task
that requires planning and a felicitous attitude. Our writing problems often arise when we fail to
acknowledge and respect the writing process for the sophisticated, unpredictable, and time-
consuming endeavor that it is. In this part of the manual, I will offer a few tips that I hope will
help you write a successful paper—or at least help you retain your wits as you go through the
process.
1. Writing a Paper—a Good Paper
Let’s begin by addressing the two most important things that should be kept in mind about writ-
ing papers.
First, writing a paper—a good paper—takes time. By good, I don’t mean an “A” paper:
lots of papers get A’s that are not necessarily good. (The relationship between the grade a paper
receives and the quality of the paper is a separate issue that I will not discuss here. Any good
paper is quite likely to earn an A; but not all A papers are good.) By a good paper, I mean a pa-
per that most fully fulfills its potential, meets the expectations established by the paper itself,
and, most important, communicates with its intended reader. To produce a good paper takes
time. How much time? Probably more than you may realize. To give you the right order of
magnitude, for a term paper of twenty pages or so, I’m talking dozens of hours here: hours
spent thinking about the paper, researching the paper, trying things out on paper (brainstorming,
or freewriting, or just plain noodling around), writing a first draft of the paper, revising the pa-
per, revising the paper again, proofreading the paper—and not necessarily in the order listed
here. I’m not saying that you can’t pull an all-nighter and write a paper that will get an A;
chances are, you have already done that, maybe several times. But I am saying that you cannot
pull an all-nighter and write a good paper, a paper that represents the best that you can do.
Second, writing a paper is a recursive process: it often involves one step forward, two
steps back, in which certain steps—drafting, researching, revising, outlining, etc.—are repeated
and revisited. In junior high school and even in high school, writing was probably taught as a
linear process: first you pick a topic, then you read about your topic, then you write an outline
of your paper, then you write a first draft of your paper, then you revise your paper, and finally
you proofread your paper, in that order. But research shows that that’s not the way the majority
of adults write. Adults write using a recursive process. You may begin writing before you even
know for sure what you want to write about. You may research your topic and begin writing,
only to stop and research your topic some more. You may write certain parts of your paper out
of order (for example, you may write the introduction last). You may write a draft, then outline
it, and see that you need more material or more evidence. You may begin drafting a paper, de-
cide you need to take an entirely different tack, and start drafting again. The combinations are
too numerous to count.
Give it time, and relish the recursiveness. If you do those two, you are off to a good
start. Here are a few other pieces of advice to help you along.
7
Adopt learning as a goal. In our concern about grades, we often forget about one very
important thing: learning. Approach the writing assignment as a chance to learn: to learn about
a subject, to learn about research methods and sources of information, to learn about your writ-
ing and research habits (and whether you may need to change them).
Think of yourself as a writer. Too often students think of themselves as, well, students,
and they view their assignments as required tasks in which they have no real investment. The
problem with that is it puts you in the wrong position in relation to what you want to accom-
plish. If you were taking an exam, you would do well to regard yourself as a student. But writ-
ing a paper is not about taking an exam or even studying per se. It is about writing and all that
writing entails—planning, researching, drafting, revising, thinking. Therefore, do not think of
yourself as a student but as a writer, an economist, a scholar. For models and inspiration, read
the series of interviews with writers in the Paris Review and the testimonials of economists in
Passion and Craft: Economists at Work; both are available in the library.
Surrender to the process. Researching and writing a paper is not, alas, a strict matter of
completing a series of tasks that take a finite amount of time and that yield a predictable result.
Researching and writing a paper is instead a recursive and sometimes uncertain and unpredict-
able process that refuses to fall completely under our control. The more you surrender to the
process, the happier you will be.
Start early. That means today. Not after this weekend’s parties, or after spring break, or
after the UNC game, but today. How? Make a list of possible topics. Compile a bibliography of
books and articles on your topic. Read about your topic, and take notes as you read. Formulate a
tentative thesis. Write what you know, and what you would like to know, about your topic.
Set a schedule. Do not trust that you will work efficiently and in a timely manner. Set a
schedule for your writing project, and stick to it. Show up at the same time every day so the
muse will know when to find you. Tip: Set Monday mornings as deadlines; that way, you won’t
be tempted to spend the entire weekend away from your project.
Understand the need for information. Information comes primarily from two sources:
thinking and research. If you don’t know what to write, you have not thought enough about
your topic or researched it enough—or both.
Write before you are ready to write. Students often see writing as the final activity of a
linear process, as the thing you do after you have conducted your research and formulated your
ideas. But in reality, researching and thinking and writing are all of a piece. Start writing some-
thing—anything—before you have finished your research. Write even before you know what
want to say. Indeed, it is often only by writing that we work out and discover what we truly
want to say. Important: Please keep track of your sources as you work out your ideas on paper.
Do not rely on your memory! When you come across a passage or a statistics you might use in
your paper, write down precisely where it comes from. Accurate and scrupulous note-keeping
in the pre-writing stage will save you lots of extra work and headaches later when you draft
your paper.
2. The Paper as a Whole
In your economics courses at Duke, you might be asked to write all manner of papers. You may
be asked to review a book or review the literature on a particular topic; you may be asked to
take a policy position and defend it, or to describe someone else’s position and assess its
8
strengths and weaknesses. You may be asked to pose an interesting economic question and an-
swer it, or to explain a real-world situation, using economic theories and concepts. You may be
asked to write other kinds of papers as well.
Regardless of the kind of paper you are asked to write, it may be helpful to think of the
paper as having three major parts: a beginning, a middle, and an end. In the beginning, you will
want to introduce your topic and indicate the purpose of the essay. If your essay states and de-
fends a point of view—that is, if it has a thesis, a main point—you will want to state it, usually
at the end of the introduction (or near the end: in many economics papers, the introduction ends
with a brief paragraph previewing the sections or content to come). Depending on the length
and genre of the paper, not to mention the complexity of the argument, the introduction can be
as short as a single paragraph or as long as four or five (or more). As a rough guide, figure to
have one paragraph of introductory material for a five-page essay; two paragraphs for a ten-
page essay; and three or four for essays fifteen pages or longer.
The middle of your paper should be the longest part; it is where you fulfill the expecta-
tions raised or keep the promises made in the introduction. The middle is where you actually do
what your introduction said it would do. If your paper states a thesis, the middle should be used
to support the thesis, by presenting pieces of supporting evidence, usually in ascending order of
importance.
The end, or conclusion, is usually short, often just a paragraph, maybe two. Whereas
introductions often end with the thesis statement, conclusions often begin with the thesis state-
ment. The conclusion is where you want to restate your main point or main purpose. Depending
on the assignment, your conclusion can be used to suggest lines of further research, to call read-
ers to action, to direct attention to larger issues. Conclusions often refer back to the introduction
as a way of stressing the main point of the essay.
3. Making Arguments: Claim, Reasons, Evidence—or, How to Ace that
Essay Exam
Much of the writing you will do in your economics classes is meant to persuade. Whether you
are writing a short-essay answer to an exam or a term paper, you are usually being asked to
state a position or an answer—and then defend or evaluate it. In other words, you are asked to
make an argument. But just how does one do that?
An excellent guide to the task is The Craft of Research (2d ed.), by Wayne C. Booth,
Gregory G. Colomb, and Joseph M. Williams (Chicago, 2003). Booth, Colomb, and Williams
define a research argument as follows: A claim based on one or more reasons, reasons that are
supported by evidence. Let’s look at each of those in turn.
A claim is another word for thesis. It is an argument or interpretation, not a statement of
fact, and thus needs support. A claim, for its part, is made because of a reason. Reasons explain
why we believe a claim to be sound. But merely providing reasons is not enough. Reasons must
be supported by evidence—information regarded as fact. Statistics, mathematical models, and
the conclusions of other research reports are among the items that can serve as evidence.
Suppose you are asked to write a paper explaining the pros and cons of a flat income
tax. You are to support your points with evidence and, in the end, take a position for or against,
explaining your reasons. How might the core of your argument look? Here is one hypothetical
9
example:
A flax tax should replace our current progressive one because it would better stimulate eco-
nomic growth. Two recent theoretical papers, Marshall 2000 and Walker 2002, show that a flat
tax would encourage investment in the software industry.
Another recent theoretical paper
(Abrams 2003) suggests that the American automobile industry would have benefited from a
flat tax in the late 1970s. And congressional testimony by CFOs of prominent companies al-
ludes to the likely stimulative effects of a flat tax.
Let’s examine the argument in light of claims, reasons, and evidence. The claim is that a flat tax
should replace the current one. Great. That is a useful claim, not because it is “true” or a fact,
but because it is open to reasonable debate and needs to be supported.
But why make such a claim? On what basis is it made? Reason: because it would stimu-
late economic growth.
Fine. We have a claim, and we have the reason for the claim. But the reason needs to be
supported. We need evidence suggesting that growth would be stimulated as the result of a flat
tax. What evidence does the argument provide? It refers to three scholarly papers and testimony
by CFOs.
Let’s revisit our argument, this time by labeling each component: claim, reason, evi-
dence.
A flax tax should replace our current progressive one
claim
because it would better stimulate eco-
nomic growth.
reason
Two recent theoretical papers, Marshall 2000 and Walker 2002, show that a
flat tax would encourage investment in the software industry.
evidence 1
Another recent theoretical
paper (Abrams 2003) suggests that the American automobile industry would have benefited
from a flat tax in the late 1970s.
evidence 2
And congressional testimony by CFOs of prominent
companies alludes to the likely stimulative effects of a flat tax.
evidence 3
Now: is the evidence appropriate or trustworthy or valid? Well, that’s for you, the writer-
researcher, and your reader, to decide. Part of making an effective argument is selecting evi-
dence that your reader will find persuasive. We will return to the notion of evidence in part II of
this manual.
The formula just described can differ depending on the situation. In the typical empirical
economics paper, for instance, the reasons for a claim are usually not explicitly stated. (The rea-
son behind the claim would be that a model, which has been tested with data, bears the claim
out.) The evidence would be the particulars of the data, model, and methodology themselves.
Recall that one makes a claim because of a reason. But are the two logically connected,
or mutually relevant? Why should one accept your claim, even if it is based on reason supported
by evidence? The answer is a reader may not. If that is potentially the case, you will need to
state how your reason is relevant to your claim. The principle that connects your claim to your
reason is what Booth, Colomb, and Williams call a warrant. A warrant explains how your rea-
son is relevant to your claim. Your reader can accept the truth of your reason, but not necessar-
ily its relevance. In the argument about the flat tax, for example, a reader could react as follows:
“Why is economic growth a desirable objective of tax reform? Why should a tax that stimulates
economic growth be favored over another kind of tax? Why, for example, should it be favored
over a tax that further redistributes income, or a tax that discourages certain behaviors?” Your
10
answer, if you choose to provide it, would be your warrant. Your warrant may be that economic
growth is simply good or desirable—a warrant, in this case, based on a cultural or discipline-
specific norm. Ultimately, a reader may have to take your warrant on faith.
Finally, a full research argument acknowledges counterarguments or contrary evi-
dence—and then responds to (not necessarily refutes!) them. To return to our flat-tax argument,
we see that the studies that are cited are all theoretical and pertain only to certain sectors of the
economy. It would be nice to have some empirical studies to cite as evidence, or studies that
pertain to the macroeconomy! But we do not. So how can we acknowledge, and respond, to
that? Here is one way:
Although no studies of a flat tax focus on the economy as a whole and although empirical data
are lacking,
the available studies and accounts suggest that, in general, a flat tax is good for
business.
Let’s add this, and a warrant, to our full argument:
A flax tax should replace our current progressive one
claim
because it would better stimulate eco-
nomic growth.
reason
Few would question that a growing economy is desirable, especially those
who remember all too well the dreary days of “stagflation” in the late 1970s and the recession
of the early 1980s.
warrant
Two recent theoretical papers, Marshall 2000 and Walker 2002, show
that a flat tax would encourage investment in the software industry.
evidence 1
Another recent theo-
retical paper (Abrams 2003) suggests that the American automobile industry would have bene-
fited from a flat tax in the late 1970s.
evidence 2
And congressional testimony by CFOs of promi-
nent companies alludes to the likely stimulative effects of a flat tax.
evidence 3
Although no studies
of a flat tax focus on the economy as a whole and although empirical data are lack-
ing,
acknowledgment
the available studies and accounts suggest that, in general, a flat tax is good for
the economy.
response
To sum up, a basic argument is a claim, based on one or more reasons that are then supported
with evidence. The argument is made more sophisticated and scholarly by acknowledging, and
then responding to, counterevidence.
A final word on claims. In The Craft of Research, Booth, Colomb, and Williams rank three
kinds of claims according to their significance. The least significant is a claim that further con-
firms what others have consistently argued. Next in significance is the claim that helps clear up
a puzzling, uncertain, or otherwise vexing issue. Those two are by far the kinds of claims ad-
vanced by the vast majority of economics papers (indeed, by the vast majority of research pa-
pers in general). Far less common—far, far less common—but greatest in significance, is the
claim that causes scholars to completely reconsider an issue long thought settled.
4. Making
Economic
Arguments
The last section identified and discussed some general components to a research argument.
Here we will discuss a particular kind of argument: an economic argument. The reflections
made about arguments in general still apply; here we add to them a consideration of what
11
makes for an economic argument. As we’ll see, as a discipline, economics has its own way of
making an argument—of “proving” or supporting a hypothesis—that distinguishes it from other
disciplines.
First of all, economic arguments address an economic topic. But wait: this is not entirely
accurate, for, as economists like Gary Becker have shown, almost any behavior can be sub-
jected to economic analysis. So let’s amend this to say the following: Economic arguments sub-
ject a phenomenon to economic analysis. This leads us to the next two criteria.
Second, economics arguments use economic assumptions, concepts, and theories to ex-
plain or understand the phenomenon in question. The assumptions, concepts, theories are, as
you might imagine, the ones found in your college textbooks: the assumption that people re-
spond to incentives, the law of supply and demand, opportunity cost, the marginal principle, the
notion of spillovers or externalities—the list can go on.
Third, economics arguments use certain kinds of evidence to support hypotheses. There
are at least four kinds of evidence that are most common and most accepted in economics. The
first you just heard about: the assumptions, theories, and concepts found in economics text-
books. Better yet is to back up those assumptions and theories and concepts with the second
kind of evidence: quantitative data. By quantitative data, I mean data on things that can be
measured, that one can put a number on: income, or years of schooling, or hours spent working,
or number of papers published. And the more observations in the data set, the better. The next
step in economic analysis is to use data to test a model, and that brings us to the third kind of
evidence: econometrics. Econometrics is evidence in that it constitutes a method of hypothesis
testing that is accepted by the discipline. Econometrics often and most familiarly takes the form
of regression analysis, in which the change in one variable (the “dependent” variable) is ex-
plained as a function of other variables. Finally, there is a fourth kind of evidence: economic
modeling. Economic models are mathematical equations that represent a simplified version of
the economy or the decision-making process of an economic agent. The models are based in
part on economic assumptions, theories, and concepts—the first kind of evidence discussed
above.
The building blocks of an economic argument may be seen more clearly if we consider a
counterexample. Suppose someone wanted to find out how fast-food employers would respond
to an increase in the minimum wage. Will they hire less labor, as economic theory predicts?
Someone unfamiliar with economics and its methods might respond by saying, “If I want to
know how fast-food employers will react to an increase in the minimum wage, why don’t I sim-
ply go ask a dozen or so of them and find out?” However valuable such an effort might be, it is
not the economic way. Economists prefer evidence on what people actually do, rather than on
what they say. They would be much more impressed by statistics that show how hiring actually
changed in the wake of a wage increase.
12
Part II
The Writing of Eco-
nomics: A Discipline-
Specific Examination
5. Writing about Evidence
5a. Writing about Models
5b. Writing about Data
5c. Reporting Data and Results in Ta-
bles
5d. Tables and Text: Writing about
Your Results
6. Writing Literature Reviews
7. Writing History-of-Thought Papers
8. Writing Book Reviews
9. Writing Abstracts
13
Part II: The Writing of Economics: A Discipline-Specific Exami-
nation
The first part of this manual looked at writing from a distance. This part will get down to the
nitty gritty and take up writing about certain kinds of things. In section 5, we will discuss writ-
ing about evidence—the data and information one uses to support a hypothesis or claim. Much
of the writing we do in economics and in our economics courses is meant to persuade. As we
read in section 4, to persuade, economists use certain kinds of evidence: economic assumptions,
concepts, and theories; data; econometrics; and economic modeling. In this section of the man-
ual we will discuss how to write about models, data, and tables.
In section 5, the discussion of evidence applies mainly to empirical economics papers.
The subsequent sections of part II will examine other genres of economics writing: abstracts,
literature reviews, book reviews, and history-of-thought papers.
5. Writing about Evidence
George Tauchen, William Henry Glasson Professor of Economics at Duke, often talks of writ-
ing a paper from the inside out. When economists write papers, Professor Tauchen explains,
“we start from the innermost spot, the model and equations. We do the empirical work, and then
write a narrative around selected tables and figures. We gradually expand the paper outwards in
both directions towards the introduction and conclusion. Those two sections are written last: it’s
impossible to write them until the author knows what is inside the paper.” With that in mind, in
this section we will discuss writing those “innermost” parts. Section 6 of the manual will dis-
cuss introductions and conclusions.
5a. Writing about Models
Often, one of the innermost parts of an economics paper is the model section. It is customary in
empirical economics papers to have a section devoted to describing your model. Although the
length of the description varies from paper to paper, a typical model section will be from three
to five pages long. If the paper presents a simple regression, the model might simply be the re-
gression equation and the Gauss-Markov assumptions (e.g., that Cov(ε
i
,ε
j
) = 0 for i != j). It is
not a bad idea, in writing down this notation, to use superscripts on the various β’s to indicate
its variable. More complicated papers might present notation, develop a basic model of eco-
nomic behavior, report the first-order conditions necessary for agents’ to optimally set prices or
choose investment or whatever, and then interpret those conditions.
In the model section, the writer takes the reader through the series of equations that con-
stitute the model. The model may have been briefly described in the introduction; but in this
section, it is described in detail. As you describe your model, its corresponding mathematical
form is presented. It is customary to state the statistical technique the analysis will use—
reduced-form regression, two-stage least squares, etc.—and why it was chosen. You should lay
out all the assumptions you make in your model, as well as explain the intuition behind those
14
assumptions. In your models, the notation should either (a) follow the standard notation in the
literature or (b) be very self-explanatory. You should liberally use subscripts, superscripts, and
Greek letters, and you will find it very helpful to use specialized equation editors (like the
Equation Editor or MathType in Word).
You should also indicate the source of the model. Did you construct it yourself, or, as is
much more common, is it borrowed or adapted from someone else?
In writing about your model, you present your assumptions about the economic agents
you will consider and lay out the decisions and information they have available to them. On
what basis do they make decisions? When are those decisions made—all at once, or in a series
of steps or moments? What is the optimal way of acting based on the circumstances you have
constructed?
For a sample model section, see appendix 2.
5b. Writing about Data
Another of the innermost parts of an (empirical) economics paper is the data section. In empiri-
cal economics papers, it is customary to describe the data one uses. The best way to learn about
writing a data section is to read several data sections in the literature on your topic and pay at-
tention to the kinds of information they contain.
What you tell your readers about your data will depend in large part on the kind of
analysis you are conducting. Generally speaking, however, your data section should do at least
the following:
• Identify the data source (e.g., “This study uses data from the 1999 wave of the Panel Study
of Income Dynamics.”).
• Provide a general description of the data source (number of observations, population
groups sampled, time period during which the data were collected, method of data collection,
etc.).
• State the strengths and weaknesses of the data source, especially how they relate to other
data sources used in the literature (does the data source provide more observations, and/or more
recent observations, than other sources? was the data collected in a more reliable manner? etc.).
• Note any features of the data that may affect your results (were certain populations overrep-
resented or underrepresented? is there attrition bias or selection bias?)
• Explain how you may have computed certain kinds of data that the source did not give di-
rectly (did you have to add/subtract/multiply/divide two given pieces of data to get a third?)
Describe how you selected your sample (did you have to eliminate certain kinds of observa-
tions?)
You should pay attention to what aspects of your data will be most relevant to your pro-
ject; you might spend more energy discussing your dependent variable than a control variable.
15
Data sections often contain a table of descriptive statistics, statistics of relevance about
the sample. These statistics usually include the mean (e.g., mean income, mean age, mean years
of schooling, etc.) and standard deviation. For categorical data (like race), however, you do not
report a mean; instead, you report the percentage of the observations in each group.
Again, the nature of your project will determine how best to describe your data.
And it bears repeating that the best way to learn how to write a data section is to read
several data sections in the literature and pay attention to the kinds of information they contain.
In the appendix to this manual you will find two sample data sections of varying
lengths. Study them with respect to the discussion presented here.
5c. Reporting Data and Results in Tables
[Note: This section and the next are drawn almost wholesale from Writing Economics: A Guide for Har-
vard’s Sophomore Economics Concentrators, which Harvard has kindly allowed us to use.]
Once you have located your data or have run regression analyses and have gotten your results,
you now need to present them. Commonly, in economics papers, results and statistical informa-
tion are presented in tables. But how much of that data or how many results should you report
in your tables? The short answer: Less is usually more. This is particularly the case when it
comes to reporting the results from regression analyses. A common mistake made by virtually
all novice researchers (including graduate students) is to include every parameter estimate from
every regression specification that you ran. Such a “kitchen sink” approach is usually done to
demonstrate to the professor that you have done all this wonderful econometric work. But that
approach is usually counterproductive, as it often obscures what your important findings really
are. So what to do?
Better would be to present only those parameter estimates that speak directly to your
topic. To illustrate this point, let’s consider a hypothetical rhetorical situation for which you
might construct a table in which to present your findings. Suppose that you are writing about
the effect of education on wages. Suppose your main regression places an individual’s wage on
the left-hand side and regressors such as education, race, and gender on the right-hand side.
You believe that the regressor of interest—education—is correlated with the error term of the
wage equation: that is, more “able” people earn more at their jobs and also obtain more educa-
tion. Because of this correlation between the error term and education, the measured effect of
education in the regression will reflect not only the true causal effect of education on wages but
also some of the effect of ability on wages. To circumvent this “ability bias” you use a separate
measure as a proxy for ability. Though such a proxy is not available, assume for the sake of ex-
position that a special data set contains an individual’s evaluation by his or her second-grade
teacher. When presenting your results, you want to focus only on the estimates of the education
effect and the ability effect. Your table might look something like this:
16
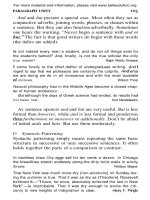
Table 1 OLS Estimates of the Effect of Education on Wages. Dependent Variable: Log of
Yearly Earnings, 1985–1995
Note: Standard errors are in parentheses. Data are from the Tennessee Second Grade Ability Survey and
Wage Follow-up, and include individuals evaluated between 1962 and 1971. The “ability dummy”
equals 1 if the individual’s second-grade teacher classified the individual as “able,” and 0 otherwise.
Each regression also includes yearly dummies, ten one-digit industry and twenty Census-defined occu-
pation dummies, labor market experience (defined as one’s age minus 6), experience squared, seniority
on the current job, seniority squared, Census region of current residence, marital status, race, gender, and
a dummy variable denoting whether the individual lives in a city of more than 100,000 persons. Col-
umns 3 and 4 have fewer observations because the state of residence is not available for some individu-
als.
A few words of explanation are in order. The columns are numbered 1, 2, 3, and 4; each
refers to a different regression. Using only numbers as column heads is fairly common in tables
that present the results of a series of regressions. In most other cases, however, you will need to
use actual words as column heads.
Also, the table has a fairly detailed note explaining the details of the table, such as the
data source and the numbers in parentheses. It is customary to include such notes at the bottom
of tables. The goal is to enable the reader to make sense of the table on its own.
Now, to the results. Note that the table is selective in its presentation of data: the table
does not present the parameter estimates of your control variables (regressors such as race and
gender), but it does present any detail that helps interpret the parameters of interest (including
the dependent variable). Your estimates should be identified using as much language as possi-
ble, rather than by simply using letters in the equation that stands for the estimates; that is, in
your table, say “Years of Education” rather than just giving, say, the letter β (or whatever letter
stands for that estimate).
Don’t worry about repeating yourself in the text and in the notes—that will often be nec-
essary so the reader can understand your table without looking back at the text. You should pre-
sent enough information in total so that a researcher could replicate your results. For very de-
tailed projects, this may require a data appendix.
Tables may be placed directly in the text, or they may be all put together at the end of
the paper. Which you should do is largely a matter of your own preferences (or your profes-
sor’s!).
1 2 3 4
Years of Education .091
(.001)
.031
(.003)
.086
(.002)
.027
(.005)
Ability Dummy .251
(.010)
.301
(.010)
State Dummies Included? No No Yes Yes
No. of Observations 35,001 35,001 19,505 18,505
No. of Persons 5,505 5,505 4,590 4,590
Adjusted R
2
.50 .55 .76 .79
17
5d. Tables and Text: Writing about Your Results
In section 5c we reviewed a few details about presenting results in a table. Let’s now
look at how you might actually write about those results. For as informative as a table might be,
it cannot stand alone: it must be correspondingly discussed in the running text.
When you present information in a table, there are at least two expectations that you
need to fulfill. The first is that you explicitly introduce the table. You are expected to point out
to your readers that the table exists and indicate, briefly, its general content. Usually, those two
things can be accomplished in a single sentence: “Table 1 shows the incomes earned by full-
time workers in the United States,” or “Table 1 provides demographic statistics on the sample
population,” or “In table 1, I present the results of the three regressions.” Once you introduce
the table and briefly describe its general contents, you can discuss the table more particularly.
That brings us to our second expectation.
The second expectation is that you identify the main points made by the data in the ta-
ble. The table cannot, and should not be expected to, “speak for itself.” Rather, you should ex-
plicitly tell your readers the important realities that the data show: “As we see in table 1, 45% of
the sample earned less than $25,000 in 2003,” or “Table 1 reveals several significant character-
istics of our sample that could affect our results: one-third of women in the sample had less than
a high-school education; nearly two-thirds were unmarried; and exactly one-half had at least
one child under 3,” or “As expected, the coefficient on education is, in every regression, signifi-
cant and positive.” Please note that you are not expected to comment on or restate every piece
of information that a table contains; but you are expected to point out to your readers the
“meaning” or your interpretation of the data in it. What do you most want your reader to take
away from the table?
All of this is to say that you have to describe the contents of the table in the text. You
cannot simply refer to a table (or worse, not refer to it at all!) and leave it at that.
Let’s return to the hypothetical rhetorical situation described in section 5c. As you’ll
recall, suppose that you are writing about the effect of education on wages. Suppose your main
regression places an individual’s wage on the left-hand side and regressors such as education,
race, and gender on the right-hand side. You believe that the regressor of interest—education—
is correlated with the error term of the wage equation: that is, more “able” people earn more at
their jobs and also obtain more education. Because of this correlation between the error term
and education, the measured effect of education in the regression will reflect not only the true
causal effect of education on wages but also some of the effect of ability on wages. To circum-
vent this “ability bias” you use a separate measure as a proxy for ability. Though such a proxy
is not available, assume for the sake of exposition that a special data set contains an individual’s
evaluation by his or her second-grade teacher. When presenting your results, you want to focus
only on the estimates of the education effect and the ability effect. Your table—and it is the
same as in section 5c, by the way—might look something like this:
18
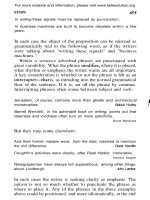
Table 1 OLS Estimates of the Effect of Education on Wages. Dependent Variable: Log of
Yearly Earnings, 1985–1995
Note: Standard errors are in parentheses. Data are from the Tennessee Second Grade Ability Survey and
Wage Follow-up, and include individuals evaluated between 1962 and 1971. The “ability dummy”
equals 1 if the individual’s second-grade teacher classified the individual as “able,” and 0 otherwise.
Each regression also includes yearly dummies, ten one-digit industry and twenty Census-defined occu-
pation dummies, labor market experience (defined as one’s age minus 6), experience squared, seniority
on the current job, seniority squared, Census region of current residence, marital status, race, gender, and
a dummy variable denoting whether the individual lives in a city of more than 100,000 persons. Col-
umns 3 and 4 have fewer observations because the state of residence is not available for some individu-
als.
How would a discussion of the results presented in this table likely go? Here is one possibility:
Table 1 presents the OLS estimates of the effect of education on wages. It shows that including
a measure of ability in the wage equation dramatically lowers the predicted effect of education
on earnings. Column 1 does not include an ability measure and indicates that a year of education
raises wages by 9.1 percent. Column 2 adds the ability measure; the education effect now drops
to 3.1 percent. Columns 3 and 4 show that this general pattern is repeated even when state-level
dummy variables are included. The estimates in table 1 are therefore consistent with the hy-
pothesis that the OLS estimates suffer from an upward ability bias.
A few points are instructive here. First, the discussion begins by introducing the table and indi-
cating its content (“Table 1 presents the OLS estimates . . .”). Second, the meaning or conclu-
sion to be drawn from the table is explicitly stated (“It shows that including a measure . . .”).
Indeed, the conclusion is even restated in a different way at the end of the discussion (“The esti-
mates in table 1 are therefore . . .”). And third, the discussion does not mention every single
piece of data in the table. Instead, it selects for discussion only those data that are important for
the task at hand.
Too often, authors do not pay close attention to the paragraphs that describe their re-
sults. After all, the results are in the table; what difference does it make how they are described
in the text? But it is necessary to craft carefully paragraphs that describe your results. Any well-
designed empirical project is complex; a lot of factors must be considered in order for any sin-
gle factor to be precisely estimated. You want to guide the reader and focus his or her attention
on the important parts of the table, and in the right order. Moreover, no empirical paper turns
1 2 3 4
Years of Education .091
(.001)
.031
(.003)
.086
(.002)
.027
(.005)
Ability Dummy .251
(.010)
.301
(.010)
State Dummies Included? No No Yes Yes
No. of Observations 35,001 35,001 19,505 18,505
No. of Persons 5,505 5,505 4,590 4,590
Adjusted R
2
.50 .55 .76 .79
19
out perfectly. Usually, the data do not resoundingly support each and every idea. In those cases,
it is crucial to discuss your results as honestly and carefully as possible.
6
. Writing Literature Reviews
Remember the four-move pattern discussed in the section on introductions (section 6)? You
might recall that move 2 of the pattern reviews the literature. Literature reviews are staples of
scholarly economics articles. A review should do at least four things. First, it should analyze
critically, and organize, a body of research. Second, it should put your own study in the context
of other studies. Third, your review should highlight your study’s contribution. And fourth, it
establishes your scholarly “bona fides” by showing you have done your homework.
Here are some guidelines to consider when writing your literature review.
• Begin with comments about the body of research as a whole. This should be your assess-
ment of the literature as a whole. Have there been many studies, or few studies? Do the
studies focus on methodological issues, or data issues, or some other issue? Have the studies
been mostly empirical, or theoretical, or both? Have they focused on a similar set of ques-
tions? Is there a general consensus on the major issues in the literature?
• Organize your review according to themes (data, methodology, results, etc). Your principle
of organization should make sense for your particular review. Here, for example, is a review
organized according to rural vs. urban development: “All four studies took a position on
whether rural or urban development should be favored. Epstein and Joseph (2000) fa-
vor rural development. In contrast, Bhattarchya (2001) and Van Neer (2000) believe urban
development is more important. Marshall (2003) concludes that it does not matter: either
kind of development is equally beneficial.”
• Begin paragraphs with a sentence that puts in explicit context what follows. Don’t leave it
to your reader to infer the point you are making. “The sources of data used in the studies
vary greatly. Smith (1999) uses data from the Survey of Income and Program Participation.
As he explains, the SIPP is well-suited to explore the relationship between hourly wages
and participation in the Food Stamp Program. Jones (2000) uses data from the High School
and Beyond Survey. . . .”
• Explain the merits, and the shortcomings, of the existing studies. Be explicit about this. Do
not leave it to your readers to infer this information. “Although Rodriguez (2001) and Dud-
ley (2000) ask the right questions, their studies are hampered by data sets with an insuffi-
cient number of observations.”
• Explain how your study will make a contribution. You may have already done this in your
introduction, but it never hurts to remind readers. “Although Rodriguez (2001) and Dudley
(2000) ask the right questions, their studies are hampered by data sets with an insufficient
number of observations. The present study hopes to avoid the flaw in Rodriguez’s and Dud-
ley’s analyses by using a new data set with over 1,600 observations.”
20
You will find it helpful to read the literature reviews in published economics papers. Some-
times those reviews will be in the introduction; other times the review will appear in a section
of its own. A good source for literature reviews is the Journal of Economic Literature. Pay at-
tention to the kinds of information given in reviews and to any principles of organization the
author uses. How does the author construct the review to bear on his or her subject? For a sam-
ple literature review, see appendix 5.
7. Writing History-of-Thought Papers
The history of economic thought (sometimes called the history of economics) is concerned with
the history of the discipline of economics—the history of economic ideas, of economic method-
ology, of economic practice. How, and why, has economics become so mathematical? What
accounts for the rise and influence of the Chicago school (Friedman, Becker, et al.)? What are
the origins of rational choice theory? How did the labor theory of value change over the nine-
teenth century? What circumstances attended the composition of Keynes’s General Theory? To
what degree did the French economists of the eighteenth century influence John Stuart Mill?
Just what was the methodenstreit all about? What role has funding agencies played in the evolu-
tion of the discipline? How did the demand theory we know and love come to be? Practitioners
of history of thought (HET) need to be skilled on two fronts: they need to understand the eco-
nomic concepts they encounter; and they need to know the tools and techniques of the historian.
(Note that HET is not economic history. That is, it is not the history of economic institutions or
economic activity, such as a history of the Federal Reserve would be, or a history of the
changes in tobacco manufacturing. Economic history is a separate subject altogether.)
The format of HET papers has not become as standardized as we see in empirical and
theoretical economics papers. Still, HET papers are usually written in sections, with section
heads.
As mentioned earlier, introductions to HET papers are expected to present certain pieces
of information: what the paper is about, what is new or valuable about the paper, what the thesis
of the paper is. See the example from Flavio Comim’s paper, below, in the discussion of intro-
ductions.
HET papers rely on two sources of evidence: primary and secondary. Primary evidence
refers to the writings of an economist himself, or the writings in which a particular idea was set
forth. Primary evidence may be divided into published sources (Keynes’s General Theory, for
instance) and unpublished sources (e.g., Keynes’s papers in King’s College Library). Secondary
evidence refers to other HET papers—articles and (sometimes) books about a particular econo-
mist or idea. Suppose you wanted to research the rise of the Chicago school. Primary sources
would be such things as the minutes of department meetings, department memos, and the writ-
ings (published and unpublished) of the people involved (say, Milton Friedman’s autobio-
graphical writings). Your paper, once finished, would constitute a secondary source.
HET papers usually state and support a thesis. A thesis is simply an interpretation or ar-
gument that may or may not be true and hence needs to be supported with evidence. The evi-
dence, as indicated above, comes from primary and secondary sources.
Thesis-driven inquiries may begin explicitly with a research question. To what degree
did the French economists of the eighteenth century influence John Stuart Mill? The answer
would constitute a thesis. Or with only the vaguest notion of a question in the foreground, a the-
21
sis may emerge inductively as one reads and rereads—and reads again!—the primary sources.
That is, the substance of a thesis may emerge by reading between the lines of a text. The sub-
stance of the interpretation is then usually implicit, rather than explicit, in the text; it is not
plainly evident to the casual or superficial reader. Whatever the thesis is, and however it was
determined, it is usually stated in the introduction of the paper.
As mentioned before, in The Craft of Research, Wayne C. Booth, Gregory G. Colomb, and
Joseph M. Williams rank thesis statements according to their significance. The least significant
is a thesis that further confirms what others have consistently argued. Next in significance is the
thesis that helps clear up a puzzling, uncertain, or otherwise vexing issue. Those two are by far
the kinds of theses that the vast majority of HET projects (indeed, that the vast majority of re-
search projects in general) advance.
The body of the paper is by far the longest part. It is where you present your evidence that
supports your thesis. In many HET papers, the body begins by setting the historical context for
the topic you are about to discuss. It then usually moves on to consider the evidence you have
gathered in support of your thesis. It is usually helpful to readers to point out the way in which
the evidence you present supports the thesis, rather than letting readers figure it out for them-
selves.
As with empirical and theoretical economics papers, conclusions to HET papers are often
brief—one, two, perhaps three paragraphs. And whereas in introductions you usually build up
to your thesis statement, in conclusions you usually begin with it. The conclusion is your
chance to sum up your argument in a clear and concise manner, and in a way that does not sim-
ply repeat, word for word, what has been already said. It is also the place to suggest other lines
of inquiry or broader implications of the topic and findings that you didn’t have to space to ex-
plore. The conclusion helps answer the question, “So what?” In any event, it should not essen-
tially repeat the opening paragraph or simply restate the theme and findings.
8. Writing Book Reviews
Book reviews play a vital role in the discipline: They allow economists, with a minimum of ef-
fort, to keep up with what is current in the literature.
I like the book review because of all the genres of economics writing, the book review is
one of the few places where an economist’s personality and style are permitted to be flagrantly
displayed. Scholarly articles proper (HET articles and empirical and theoretical papers) are usu-
ally sober and tied down to a particular format. Not so with book reviews. In a book review,
you have license to begin with a catchy opening, as Robert Solow, a Nobel Prize winner, once
did:
Like all good things for body and soul, this book is going to hurt. —Review of Activity Analysis
of Production and Allocation, from the American Economic Review, June 1952
Or, to take a more recent example, this time by another Nobel winner, Amartya Sen:
This is a great book. But it begins terribly. —Review of Poverty, Inequality, and Development,
from the Economic Journal, March 1983
22
But it’s not just the beginning that can be catchy. The ending can be clever, too:
Were there a Surgeon General of neoclassical economics, this book would carry a warning label.
—Bruce J. Caldwell, final sentence, review of Against Machines: Protecting Economics from
Science, from the Journal of Economic Literature, June 1990
So cut loose and have fun with this genre. But (there’s always a but, isn’t there?): Remember
that the book review has a serious, utilitarian purpose. All fun with no content makes for a
failed review. With that in mind, here are a few things to consider when writing a review.
• Come to the point quickly. Is this a book your audience is likely to find worthwhile?
• Give readers an overview of the main contents of the book. What is the book about? What is
its thesis or emphasis?
• State the strengths and weaknesses of the book. Is the book well written? Does it support its
arguments? Does it fulfill the expectations it raises? Is it unsatisfactory in some way?
• Explain how the book fits in with the existing literature. Has the author written other books
of its kind? How does the book respond to or continue other studies?
• State the author’s credentials. Is the author a professor of economics, or is he or she of an-
other discipline? Is the author a known ideologue or does he or she come from a particular
milieu that might color their attitudes and positions?
• Note any miscellaneous, interesting, or useful features of the book.
Above all, keep this in mind: A book review is not just a summary or recap of a book’s con-
tent—it is not a book report!—but an appraisal of the book: its contribution, its importance, its
usefulness.
For a particularly engaging review that is fun and useful, see Paul Krugman’s review of
Against the Tide: An Intellectual History of Free Trade, which appeared in the June 1997 issue
of the Journal of Economic Literature and which is reproduced here as appendix 6.
9. Writing Abstracts
Most economics articles contain abstracts, a paragraph-long condensation of the main elements
and features of a given paper. The content of an abstract can vary, but they often state what the
paper does, the data and methodology used, and the principal findings. What you choose to put
in your abstract should depend on the contribution of your paper. If you had only 150 words to
say something about it, what would you say?
Abstracts are by definition brief—usually 150 words or less. Here, for instance, is an
abstract of only 58 words. It confines itself to stating what the paper does.
We selectively survey, unify and extend the literature on realized volatility of financial
asset returns. Rather than focusing exclusively on characterizing the properties of real-
ized volatility, we progress by examining economically interesting functions of realized
volatility, namely realized betas for equity portfolios, relating them both to their underly-
ing realized variance and covariance parts and to underlying macroeconomic fundamen-
tals. —Torben G. Anderson, Tim Bollerslev, and Francis X. Diebold, “A Framework for
Exploring the Macroeconomic Determinants of Systematic Risk,” NBER Working Paper
no. 11134, 2005
23
Of course, an abstract can contain additional details. Here is one by the same trio of au-
thors that states not only what the paper does, but what the findings, and the implications
of those findings, are.
A rapidly growing literature has documented important improvements in financial return
volatility measurement and forecasting via use of realized variation measures con-
structed from high-frequency returns coupled with simple modeling procedures. Build-
ing on recent theoretical results in Barndorff-Nielsen and Shephard (2004a, 2005) for
related bi-power variation measures, the present paper provides a practical and robust
framework for non-parametrically measuring the jump component in asset return volatil-
ity. In an application to the DM/$ exchange rate, the S&P500 market index, and the 30-
year U.S. Treasury bond yield, we find that jumps are both highly prevalent and dis-
tinctly less persistent than the continuous sample path variation process. Moreover, many
jumps appear directly associated with specific macroeconomic news announcements.
Separating jump from non-jump movements in a simple but sophisticated volatility fore-
casting model, we find that almost all of the predictability in daily, weekly, and monthly
return volatilities comes from the non-jump component. Our results thus
set the stage
for a number of interesting future econometric developments and important financial
applications by separately modeling, forecasting, and pricing the continuous and jump
components of the total return variation process. —Torben G. Anderson, Tim Boller-
slev, and Francis X. Diebold, “Roughing It Up: Including Jump Components in the
Measurement, Modeling, and Forecasting of Return Volatility” NBER Working Paper
no. 11775, 2005
What you choose to include in an abstract depends on your interpretation of the paper’s impor-
tant or interesting features and its contribution or what distinguishes it from other papers.
24
Part III
Bookends: Introduc-
tions and Conclusions
10. Introductions
10a. General Content of Introductions
10b. Yes, But How to Actually Begin a
Paper?
10c. Introductions: Summing Up
11. Conclusions
25
Part III: Bookends: Introductions and Conclusions
This part of the manual will discuss writing the two major sections of a paper that really func-
tion in tandem with one another: introductions and conclusions. It is no accident that the discus-
sion of introductions and conclusions comes after the discussion of the “innermost” parts of an
economics paper (section 5): after all, introductions and conclusions are usually written last (or
at least their final form is written last, although drafts of the introduction and conclusion may be
written earlier in the writing process).
10. Introductions
In this section we will consider the general content of introductions, focusing on a series
of “moves” that many introductions progress through. We will also review ways to begin a pa-
per.
The discussion that follows is the most sprawling of the manual, so please bear with me.
If you’re like me, figuring out how to simply begin a paper is as much a challenge as writing
the paper as a whole. Also, if you’re like me, you want to sound smart; you want to sound pro-
found. You want to speak the Truth. So we tend toward—what else?—the grandiose opening.
(Hey, it works for the Book of Genesis and the Gospel of John, so why not us?) We begin with,
say, “Since the beginning of time, humankind has sought ways to elevate their happiness” or
“Through the ages, economists have been vexed by the problem of poverty.” The problem with
such a beginning is that we lay claim to more authority than we can possibly have. (Have you
been around since the dawn of time?) It’s akin to beginning a personal essay or, God forbid, a
poem (shriek!), with “God is . . .” or “Love is . . .” When we commit ourselves to so grand a
subject, we are bound to fall flat on our face.
Let’s do something different: Let’s begin smaller, or at least more humbly. As you’ll see, to
do so puts us in acceptable company.
10a. General Content of Introductions
So, what kinds of things should be in the introduction? The answer depends in part on the
audience for the paper, which, as most of you have learned the hard way, professors often fail to
identify. The moral: Always ask your professor to identify the intended audience of a paper.
Depending on your audience, you may need to provide a lot of background information or none
at all; you may need to define or avoid certain terms, or you may be able to use them without a
second thought. Is your audience likely to be receptive or skeptical or downright hostile to your
point of view?
The answer also depends on the kind of document you are writing. Many of you who write
honors papers will write an empirical or theoretical economics paper (the kind of paper in
which you test or develop a model). With those papers, it may be helpful to think of an intro-
duction as consisting, roughly, of four “moves.” In Move 1, you announce your topic. In Move
2, you review previous research on your topic. Move 3 finds you indicating a gap or problem
with the previous research. And in Move 4 you state what your paper does, how it fills the gap