engish 11(cb) unit 11-writing
Bạn đang xem bản rút gọn của tài liệu. Xem và tải ngay bản đầy đủ của tài liệu tại đây (825.77 KB, 13 trang )
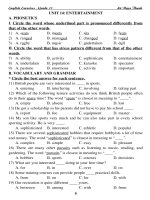
Unit 11: SOURCES OF ENERGY
Lesson D: WRITING
Task 1: Work in pairs and answer the questions:
1. What does the chart show?
2. Does it describe the past, the present, or
the future?
3. Which made up the largest amount of
consumption: petroleum, coal, or nuclear and
hydroelectricity?
4. Which consumption ranked the second?
5. Which made up the smallest amount of
consumption?
Before you write:
Fill in the gaps with the information from the chart:
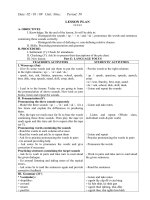
The chart shows the energy consumption
in Highland in 2000. As can be seen, the
solar energy consumption was (1) _____
million tons. Petroleum made up the
largest amount of this figure (57 million
tons). This was followed by the
consumption of (2) _____ (40 million
tons). Nuclear and hydroelectricity made
up the (3) _____ amount of energy
consumption (20 million tons).
117
coal
smallest
Useful language
- The chart shows/ describes…: bi u đ cho th y…ể ồ ấ
- As can be seen, ….: có th th y r ng…ể ấ ằ
- This was followed by the consumption of….: ti p ế
theo là m c tiêu th c aứ ụ ủ
-
…made up the largest/ smallest amount of….:…
chi m s l ng l n nh t/ ít nh t là…ế ố ượ ớ ấ ấ
- The consumption of … was lower/ higher than it was
in…: tiêu th … thì th p h n/ cao h n so v i năm…ụ ấ ơ ơ ớ
- The … consumption increased/ decreased in…: tiêu
th … tăng/ gi m vào năm…ụ ả
Task 2: Continue your description of the
trends in energy consumption in 2005 from
the chart:
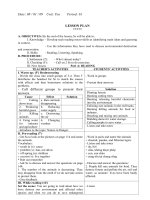
The chart shows the energy consumption in
Highland in 2005. As can be seen, the total
energy consumption was _____ million tons.
Nuclear and hydroelectricity made up the
largest amount of this figure (75 million tons).
This was followed by the consumption of
________ (50 million tons). Coal made up the
_______ amount of energy consumption (45
million tons).
While you write:
170
petroleum
smallest
Work in pairs to answer the following questions
1.Was the total energy consumption in 2005
higher or lower than it was in 2000?
- The total consumption in 2005 was
higher than it was in 2000.
2. How many tons was Nuclear and
hydroelectricity consumed in 2005? Was it
lower or higher than it was in 2000?
- 75 tons nuclear and hydroelectricity was
consumed in 2005. It was higher than it
was in 2000.
While you write:
3. Was the consumption of coal in 2005 lower
or higher than it was in 2000?
- The consumption of coal in 2005 was lower
than it was in 2000.
4. Was petroleum consumption in 2005
lower or higher than it was in 2000?
- Petroleum consumption in 2005 was lower
than it was in 2000.
While you write:
-
The total consumption in 2005 was higher
than it was in 2000. –
-
75 tons nuclear and hydroelectricity was
consumed in 2005. It was higher than it was
in 2000.
- The consumption of coal in 2005 was lower
than it was in 2000.
- Petroleum consumption in 2005 was lower
than it was in 2000.
After you write:
Work in groups to write a paragraph to
describe the energy consumption in Highland
in 2000 and in 2005.
After you write:
The chart shows the energy consumption in
Highland in 2000 and 2005. As can be seen, the
total energy consumption in 2005 was 170
million tons. So it was higher than it was in 2000
(117 million tons). In 2005, nuclear and
hydroelectricity made up the largest amount of
this figure (75 million tons). This was followed
by the consumption of petroleum (50 million
tons). Both of them were higher than they were
in 2000. However, coal decreased the amount of
the energy consumption (from 57 million tons in
2000 to 50 million tons).
Homework:
1. Do the writing again at home.
2. Prepare for the new lesson.