Four wave mixing in optical fibers and its applications by osamu aso , masateru tadakuma and shu namiki
Bạn đang xem bản rút gọn của tài liệu. Xem và tải ngay bản đầy đủ của tài liệu tại đây (58.07 KB, 6 trang )
63
1. INTRODUCTION
When a high-power optical signal is launched into a fiber,
the linearity of the optical response is lost. One such non-
linear effect, which is due to the third-order electric sus-
ceptibility is called the optical Kerr effect.
1), 2)
Four-wave
mixing (FWM) is a type of optical Kerr effect, and occurs
when light of two or more different wavelengths is
launched into a fiber. Generally speaking FWM occurs
when light of three different wavelengths is lauched into a
fiber, giving rise to a new wave (know as an idler), the
wavelength of which does not coincide with any of the oth-
ers. FWM is a kind of optical parametric oscillation.
In the transmission of dense wavelength-division multi-
plexed (DWDM) signals, FWM is to be avoided, but for cer-
tain applications, it provides an effective technological basis
for fiber-optic devices. FWM also provides the basic tech-
nology for measuring the nonlinearity and chromatic disper-
sion of optical fibers. This paper discusses those aspects of
R & D into FWM applications that the authors have carried
out recently in connection with broadband all-optical simul-
taneous wavelength conversion and a technique for mea-
suring the nonlinear coefficient of optical fibers.
2. THEORY OF FWM
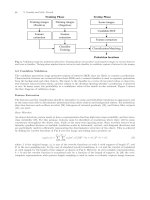
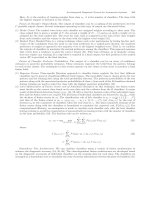
Figure 1 is a schematic diagram that shows four-wave
mixing in the frequency domain. As can be seen, the light
that was there from before launching, sandwiching the two
pumping waves in the frequency domain, is called the
probe light (or signal light). The idler frequency
f
idler
may
then be determined by
where:
f
p1
and
f
p2
are the pumping light frequencies, and
f
probe
is the frequency of the probe light.
1), 2)
This condition is called the frequency phase-matching
condition. When the frequencies of the two pumping
waves are identical, the more specific term "degenerated
four-wave mixing" (DFWM) is used, and the equation for
this case may be written
where:
f
p
is the frequency of the degenerated pumping
wave.
Continuous-wave DFWM may be expressed by the fol-
lowing nonlinear coupled-mode equations
1)
Four-Wave Mixing in Optical Fibers and Its Applications
by Osamu Aso
*
, Masateru Tadakuma
*
and Shu Namiki
*
Four-wave mixing (FWM) is a phenomenon that must be avoided in DWDM
transmission, but depending on the application it is the basis of important sec-
ond-generation optical devices and optical device measurement technology. This paper discuss-
es the theory of FWM, and then introduces one of its applications a broadband all-optical simul-
taneous wavelength converter developed using a high nonlinearity dispersion fiber (HNL-DSF)
that efficiently produces FWM. The conversion bandwidth extends to 23.3 nm HWHM (half width
at half maximum), the widest yet reported for wavelength conversion using non-polarization-
maintaining fiber. As a further application, a novel technique is introduced for measuring the non-
linear coefficient of optical fibers by evaluating FWM generating efficiency. With this technique it
is now possible to effect simultaneous measurement of the chromatic dispersion and nonlinear
coefficient of fiber.
ABSTRACT
*
WP Team, Opto-technology Lab., R & D Div.
Figure 1 Schematic of four-wave mixing in the frequency
domain
Pumping light
Idler light
Probe light
Frequency
Pumping light
Idler light
Probe light
Frequency
a) 2-channel pump wave
b) 1-channel pump wave (degenerated FWM)
f
idler
=
f
p1
+
f
p2
-
f
probe
(1)
f
idler
=
2f
p
-
f
probe
(2)
64
Furukawa Review, No. 19. 2000
where:
z
is the longitudinal coordinate of the fiber,
α
is
the attenuation coefficient of the fiber, and
E
p
,
E
probe
and
E
idler
are the electric field of the pump-
ing, probe and idler waves.
γ
is the nonlinear coefficient, and is obtained by
1)
where:
n
2
is the nonlinear refractive index,
A
eff
is the effec-
tive area of the fiber and
c
is the speed of light in
a vacuum.
The term
∆β
in Equation (3) represents the phase mis-
match of the propagation constant, and may be defined as
where:
D
is the chromatic dispersion coefficient.
To generate FWM efficiently, it is required that pump
wavelength conincides with the fiber zero-dispersion
wavelength.
3)
The first term on the right side of Equation
(3) represents the effects of self-phase modulation (SPM)
and cross-phase modulation (XPM) resulting from the
optical Kerr effect.
3. WAVELENGTH CONVERSION BY FIBER
FOUR-WAVE MIXING
3.1 Significance of Wavelength Converters
Wavelength converter is simply a device for converting the
injected signal light from one wavelength to another.
8)~13)
It
therefore is seen to have great promise in configuring the
photonic networks of the future using optical cross con-
nects. A number of methods of wavelength conversion
have been proposed, of which parametric conversion
using optical fiber FWM offers two major advantages: high
conversion speed and the ability to effect simultaneous
conversion of signals within a wavelength bandwidth.
3.2 Wavelength Conversion in the Fiber
The most important characteristics desired of wavelength
converters using parametric conversion are high conver-
sion efficiency and broad bandwidth.
To achieve this kind of wavelength conversion, the fol-
lowing conditions must be met:
(a) pump wavelength must coincide with zero-dispersion
wavelength;
(b) chromatic dispersion variation in the longitudinal
direction of the fiber should be minimized; and
(c) states of polarization of the pump and signals must
coincide.
As has already been argued in the literature,
6), 7)
in order
to broaden the conversion bandwidth, consideration must
additionally be given to coherence length. The arguments
concerning efficient DFWM generation may be summa-
rized as follows: Letting
∆f
be the frequency spacing
between the pumping light and the signal (or idler) light,
fiber length
L
must, to produce effective DFWM across the
frequency band, satisfy the condition
where:
L
coh
is coherence length, a parameter having a
length dimension.
As Equation (6) shows, fiber length must be reduced to
effect broadband simultaneous wavelength conversion at
large values of
∆f
. Reducing fiber length is also significant
in terms of condition (b), since it results in a homogeneous
chromatic dispersion distribution along the fiber. Reducing
fiber length is also effective in satisfying condition (c).
Unless polarization-maintaining fiber (PMF) is used, the
state of polarization at launching is not maintained until
output. This is due to variations in polarization in the
length direction caused by birefringence within the fiber.
Even if the state of polarization is aligned at the time of
launching into the fiber, the relative phase difference
between the pumping light and the signal light can be
expressed, if birefringence
∆n
is present, as
One way of achieving a broader conversion band
∆f
is
to reduce
∆n
. It has been reported
12)
that broadband
simultaneous wavelength conversion, with a
∆n
of effec-
tively zero at 36.0 nm HWHM has been successfully
achieved taking advantage of DFWM in the eigenstate of
polarization using PMF. If, however, fiber length
L
is
reduced, even the limited
∆n
can to some extent control
the problem of mismatching of polarization.
If the fiber is shortened, however, its length will be insuf-
ficient to produce nonlinear interactions. To compensate
for this, it was decided to use HNL-DSF.
1
2
dE
p
dz
dE
probe
dz
dE
idler
dz
1
2
1
2
E
p
= i E
p
2
+2 E
probe
2
+2 E
idler
2
E
p
+2i E
*
p
E
probe
E
idler
exp(i z)+
+
+
E
probe
= i E
probe
2
+2 E
idler
2
+2 E
p
2
E
probe
+2i E
*
idler
E
p
2
exp(-i z)
E
idler
= i E
idler
2
+2 E
p
2
+2 E
probe
2
E
idler
+2i E
*
probe
E
p
2
exp(-i z)
(3)
α
α
∆β
∆β
∆β
γ
γ
γ
γ
γ
γα
()
()
()
2 f
p
c
n
2
A
eff
(4)
π
γ
.
≡
=
probe
+
idler
-
2
pump
=
-
D(
f
p
)(
f
probe
-
f
p
) (5)
π
8 f
p
2
c
∆β β β β
L L
coh
≡
=
.
∝
2
1
f
2
1
f
2
(6)
c
4
2
f
p
D(
f
p
)
≤
∆β ∆ ∆π
π
= n
.
f
.
L (7)
π
2
c
∆φ ∆ ∆
65
4. EXPERIMENTS IN BROADBAND SIMUL-
TANEOUS ALL-OPTICAL WAVELENGTH
CONVERSION USING HNL-DSF
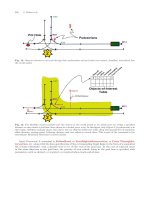
Figure 2 shows the refractive index profile of the HNL-
DSF used in these experiments, and Table 1 shows trans-
mission characteristics. The fiber was made by vapor-
phase axial deposition, and had a nonlinear coefficient
γ
of 13.8 W
-1
km
-1
, approximately five times the value for
ordinary DSF. Figure 3 shows the experimental setup.
Both the pumping and probe (signal) were continuous
waves. The lightwaves amplified by the erbium-doped
fiber amplifiers (EDFAs) were coupled using a 10-dB cou-
pler. There are polarizers at the output terminal of the cou-
pler, and the states of polarization of the pumping and sig-
nal at input into the HNL-DSF are in alignment. The output
was measured by an optical spectrum analyzer to find
idler optical power. In this way it was possible to find con-
version efficiency
G
c
, which may be stated as
Figure 4 shows the measured values of conversion effi-
ciency obtained for fibers 24.5, 1.2 and 0.2 km in length.
During measurement, the pumping wavelength was made
to agree with the zero-dispersion wavelength of the fiber.
The injected pumping power was set at 100 mW (20
dBm), and signal power was 1 mW (0 dBm).
From Figure 4 it can be seen that as the length of the
HNL-DSF is reduced, the bandwidth broadens, reaching
23.3 nm HWHM at a length of 200 m the greatest band-
width heretofore achieved using non-polarization main-
taining fiber.
13)
5. MEASUREMENT OF NONLINEAR COEF-
FICIENT AND CHROMATIC DISPERSION
5.1 Nonlinear Coefficients
The explosive growth in long-haul telecommunications
achieved in recent years has been largely attributable to
DWDM technology and the role played by EDFAs,
14)
but
the nonlinear effects of signals amplified by EDFAs have
resulted in the degradation of system performance.
Attention has recently been focused on dispersion man-
aged systems as a means of suppressing FWM.
15)
Reverse-dispersion fiber (RDF) is used in combination
with conventional single-mode fiber (SMF).
16)
At 1550 nm,
RDF has a chromatic dispersion of the same magnitude
as SMF but of opposite sign (normal dispersion), and the
dispersion slope is reversed. Thus it can compensate for
both dispersion and dispersion slope simultaneously. The
results of high-capacity WDM experiments using disper-
sion-managed systems consisting of SMF and RDF have
been reported.
17), 18)
A number of methods have been developed for measur-
ing the nonlinear coefficient
γ
, including the use of self-
phase modulation
19)
, cross-phase modulation
20)
and four-
wave mixing.
21), 22)
In the present paper a technique was
considered that was applicable to a comparatively wide
normal dispersion domain, and yet measurements could
be carried out by all-optical means.
23), 24)
This was because
it was realized that as dispersion-managed systems
become more widely used and the demand for RDF and
other fiber having normal dispersion increases, so will the
need to evaluate it.
Table 1 Transmission Characteristics of HNL-DSF
Characteristic
Attenuation coefficient
Zero-dispersion wavelength
Dispersion slope (at zero-dispersion wavelength)
Nonlinear coefficient
Measured value
0.61 dB/km
1565.5 nm
0.029 ps/nm
2
/km
13.8 W
-1
km
-1
Figure 2 Refractive index profile of HNL-DSF
-1.00
0.00
1.00
2.00
3.00
-15.0 -10.0 -5.0 0.0 5.0 10.0 15.0
∆
+
=2.75%
∆
-
=-0.55%
SiO
2
level
Relative refractive index difference ∆ (%)
Fiber radius (µm)
Figure 3 Setup for wavelength conversion experiment
Pumping light
source
Signal light
source
Polarization controller
Polarization controller
EDFA
EDFA
10-dB coupler
HNL-DSF
Optical spectrum
analyzer
Figure 4 Measured values of conversion efficiency for fibers
of selected lengths
-60.0
-50.0
-40.0
-30.0
-20.0
-10.0
0.0
0.0 10.0 20.0 30.0 40.0
L
= 24.5 km
L
= 1.2 km
L
= 200 m
λ
idler
- λ
p
(nm)
Conversion efficiency (dB)
P
idler
(z=L)
P
probe
(z=0)
G
c
= (8)
66
Furukawa Review, No. 19. 2000
5.2 Principles of Measurement
Let us discuss measurement in terms of the pump unde-
pleted approximation proposed by Stolen and Bjorkholm,
1), 7)
which in the case of DFWM is accomplished by Equation
(9).
This is an approximation in which the attenuation coeffi-
cient
α
of Equation (3) is zero and the pumping power is
taken to be so large as to be dominant. For this reason
the pumping light is not subject to DFWM-induced reac-
tion. The signal light and idler light are of about the same
magnitude, and interact together through DFWM.
Solving Equation (9) analytically, conversion efficiency
G
c
in the normal dispersion domain of the fiber may be
represented
1)
as
wherein
g
is termed parametric gain, and can be
obtained by
The following is an explanation of the principles of mea-
surement using the above terms.
If in Equations (10) and (11)
P
p
is a variable and fiber
length
L
is known,
γ
and
∆β
are the unknowns. It is possi-
ble to find by measurement the two conversion efficien-
cies
G
c
corresponding to two different values of pumping
power
P
p
. Mathematically, this may be regarded as
obtaining two simultaneous equations with respect to the
two unknowns
γ
and
∆β
. Solving this simultaneous equa-
tion yields the nonlinear coefficient and the chromatic dis-
persion. Actually, to minimize unavoidable measurement
errors as much as possible, conversion efficiency
G
c
was
found for successive values of pumping power without
solving the equation, and
γ
and
∆β
were obtained by the
Levenberg-Marquardt least square method.
25)
6. MEASUREMENT OF NONLINEAR COEF-
FICIENT OF RDF
6.1 System Setup
Figure 5 shows the experimental setup. It is substantially
the same as that shown in Figure 3, except that a band-
pass filter is used to reduce the amplified spontaneous
emission of the EDFA amplifying the pump. Also a 15-dB
coupler is used to couple the probe light and pumping
light. Since the polarization controller (PC) is positioned
after the EDFA, an attenuator is used. This results in a
reduction in the power of the pumping light after coupling,
so it is input into the fiber under measurement with the
states of polarization of the probe light and pumping light
carefully aligned and without the use of a polarizer (see
Figure 3). Measurements of input probe light were taken
with an optical power meter and of output power with an
optical spectrum analyzer (OSA) having 0.01-nm resolu-
tion, to find the conversion efficiency.
6.2 Optimizing Measurement Conditions
To make an accurate evaluation of
γ
and
∆β
using
Equations (10) and (11), it was found necessary to give
some consideration to the measurement conditions
because: a) pumping power had to be operative below the
stimulated Brillouin scattering (SBS) threshold value
determined by the fiber under measurement and the line
width of the pumping light source; and b) the optical power
of the probe was set 25 dB lower than pumping power.
This was to ensure the assumption that in a DFWM sys-
tem using Equation (9), in which pumping light is assumed
to be dominant.
Measurements and evaluations were then made at the
two conditions described above. Measurements were car-
ried out on an RDF having a total length of 10 km. The
pump wavelength was set at 1553 nm. Specifically,
n
2
/
A
eff
was evaluated from
γ
using Equation (4) and chromatic
dispersion coefficient
D
was evaluated from
∆β
using
Equation (5). Figure 6 shows the results obtained. The
horizontal axis shows the wavelength spacing
∆λ
between
the pump and probe, and the vertical axis shows the cor-
responding measured value.
dE
p
dz
dE
probe
dz
dE
idler
dz
γ
γγ
γγ
∆β
∆β
=
i E
p
2
E
p
=
2i E
p
2
E
probe
+2i E
*
idler
E
p
2
exp(-i z) (9)
=
2i E
p
2
E
idler
+2i E
*
idler
E
p
2
exp(-i z)
G
c
=
2
P
p
2
L
2
(10)
sin(gL)
gL
2
γ
1
4
∆β∆β γ
≡
(11)
g
( +4 P
p
)
Figure 5 Setup for simultaneous measurement of nonlinear
coefficient and chromatic dispersion
Pumping light
source
Signal light
source
Bandpass filter
Polarization controller
EDFA
3-dB coupler
Fiber under measurement (RDF)
Optical spectrum
analyzer
Attenuator
PC
Figure 6 Measured values of nonlinear coefficient
n
2
/
A
eff
(•)
and chromatic dispersion
D
(o) for 10-km fiber with a
pumping wavelength of 1553.0 nm
-20.0
-15.0
-10.0
-5.0
0.0
0.0
0.5
1.0
1.5
2.0
0.14 0.16 0.18 0.2 0.22 0.24 0.26 0.28
D
(ps/nm/km)
n
2
/
A
elf
(10
-9
) (W
-1
)
∆λ (nm)
67
As can be seen from Figure 6, the values of
n
2
/
A
eff
gen-
erally depend on
λ
, and the value changes greatly at
∆λ
of
about 0.22 nm. When the chromatic dispersion coefficient
for identical fiber was measured independently by the
phase-shift method, it was found to be 15.45 ps/nm/km at
a wavelength of 1553 nm, demonstrating that at values of
∆λ
greater than 0.22 nm, accurate evaluation was not
obtained. This means that approximation by means of
Equation (10) cannot be applied.
We measured the idler power by changing the probe
wavelength while fixing the pump wavelength. The result
is shown in Figure 7. It is known that the conversion effi-
ciency decreases as
∆λ
increases. The conversion effi-
ciency has a minimal value when
∆λ
=0.22 nm, after which
it increases as
∆λ
decreases. Equation (6), which was
introduced in the discussion of coherent length, can also
be considered, in determining fiber length, as limiting the
bandwidth, This limited bandwidth corresponds to the min-
imum value in Figure 7.
1)
In other words this technique is
useless unless
∆λ
is less than 0.22 nm.
Based on Figure 6, the value of
∆λ
evaluated as opti-
mum was 0.21 nm. These results demonstrated that
unless the optimal value was selected for wavelength
spacing
∆λ
, the evaluation would include errors, so that
measurements corresponding to those in Figure 7 were
carried out for all fibers. This showed the need to take the
measurements and carry out evaluations at the approxi-
mate value of
∆λ
that yielded the first minimum value of
conversion efficiency as
∆λ
was increased, and this con-
clusion was confirmed by measurements made using a
number of different RDFs.
6.3 Results of RDF Measurements
Measurements were made using RDFs of four different
lengths: 0.83, 5, 10 and 20 km, at pumping wavelength
increments of 3 nm. Figure 8 shows the results, from
which the dispersion slope was obtained.
Table 2 compares the results of evaluations of
n
2
/
A
eff
for
the four RDFs measured with results obtained indepen-
dently by cross-phase modulation (XPM). Similarly the
results of evaluations of chromatic dispersion and disper-
sion slope are shown against those made by the phase-
shift method.
The values for chromatic dispersion and dispersion
slope for different wavelengths were in substantial agree-
ment with the values measured by the phase-shift
method. For
n
2
/
A
eff
, on the other hand, it was found that
error gradually increased with fiber length. This is attrib-
uted to the failure to account for the effects of the attenua-
tion coefficient
α
, which cannot be ignored at longer fiber
lengths, in the approximation using Equation (9).
6.4 Discussion Relating to Long-Length Fibers
In applying the method described above to long-length
fibers, the attenuation coefficient has to be taken into
account. For this reason an approximation, in which
pumping light and probe light are attenuated independent-
ly of homogeneously with DFWM has been developed
26)
and may be expressed by
and
When the evaluation was repeated using these equa-
tions, it was confirmed that the value of
n
2
/
A
eff
agreed with
the value obtained by XPM, irrespective of fiber length.
Figure 7 Relationship of idler power to probe wavelength for a
10-km fiber with a pumping wavelength of 1553.0 nm
-55.0
-50.0
-45.0
-40.0
-35.0
0.00 0.05 0.10 0.15 0.20 0.25 0.30 0.35
-30.0
Minimum value
Idler power (dBm)
∆λ
p
- ∆λ
probe
(nm)
Figure 8 Measured values of nonlinear coefficient
n
2
/
A
eff
(•)
and chromatic dispersion
D
(o) for 830-m RDF
-16.5
-16.0
-15.5
-15.0
-14.5
0.5
1.0
1.5
2.0
1540 1545 1550 1555 1560
Wavelength (nm)
D
(ps/nm/km)
n
2
/
A
elf
(10
-9
) (W
-1
)
0.0
G
c
=
2
P
p
2
L
2
exp(-3 L)
sin(gL)
gL
(12)
2
γα
(13)
g
( +4 P
p
e
- L
)
1
4
∆β∆β γ
α
≡
Table 2 Comparison of simultaneously measured values of
nonlinear coefficient
n
2
/
A
eff
with those by cross-
phase modulation, and of chromatic dispersion
D
with those by the phase-shift method in RDFs
Fiber length
L
(km)
0.83 km
5 km
10 km
20 km
by 4WM
1.200
0.764
0.520
0.366
by XPM
1.20
1.19
1.17
1.39
by 4WM
-15.36
-15.05
-15.35
-15.11
by PSM
-15.30
-15.30
-15.30
-15.10
by 4WM
-0.053
-0.042
-0.048
-0.039
by PSM
-0.049
-0.049
-0.049
-0.024
Nonlinear
coefficient
n
2
/
A
eff
(W
-1
)
Chromatic dispersion
@ 1550 nm
(ps/nm/km)
Dispersion slope
@ 1550 nm
(ps/nm
2
/km)
68
Furukawa Review, No. 19. 2000
7. CONCLUSION AND OUTLOOK FOR THE
FUTURE
In this paper the authors have examined techniques for
achieving broadband all-optical simultaneous wavelength
conversion by taking advantage of four-wave mixing
(FWM) occurring in the fiber, together with techniques for
the simultaneous measurement of the nonlinear coeffi-
cient and chromatic dispersion.
It has been demonstrated that the use of short-length
HNL-DSF simultaneously solves the problems of chromat-
ic dispersion variance along the longitudinal direction and
polarization mismatch of probe and pump. It has been
experimentally demonstrated that simultaneous wave-
length conversion is possible over a bandwidth of 23.3
nm, the widest for non-polarization-maintaining fibers.
The authors have developed a technique for measuring
the nonlinear coefficient without electrical signal process-
ing by combining DFWM technology with the least square
method for nonlinear functions. Measurement conditions
have been optimized for the application of this technique,
and it has been demonstrated that simultaneous measure-
ment of nonlinear coefficient and chromatic dispersion are
possible under these optimized conditions. The values
obtained are in good agreement with those obtained using
the conventional XPM and phase-shift methods. The pre-
sent technique should also, in theory, be applicable to the
anomalous dispersion domain and in the vicinity of zero-
dispersion.
ACKNOWLEDGMENTS
The authors wish to thank Y. Suzuki, T. Yagi, R. Sugizaki,
S. Arai and K. Mukasa of Fiber Development Center for
providing HNL-DSF and RDF. We also thank H. Ogoshi
for fruitful discussions. Last but not least, we thank H.
Miyazawa for his continuous encouragement.
REFERENCES
1) G. P. Agrawal, "Nonlinear Fiber Optics, Second Edition",
Academic Press, San Diego, USA, (1995) Chap. 10.
2) Yamamoto, Optical Fiber Communications Technology, Nikkan
Kogyo Shimbun, (1995), Chap. 11. (in Japanese)
3) C. Lin, et.al., Opt. Lett., 6, 10, (1981) 493.
4) Taniuchi and Nishihara, Nonlinear Waves, Applied Mathematics
Series, Iwanami Shoten, (1997) Chap. 3. (in Japanese)
5) G. Cappelini and S. Trillo, J. Opt. Soc. Am. B, 8, 4, (1991) 824.
6) K. O. Hill, et.al., J. Appl.Phys., 49, 10, (1978) 5098.
7) R. H. Stolen and J. E. Bjorkholm, J. Quantum Electron., QE-18,
7,(1982) 1062.
8) S. J. B. Yoo, J. Lightwave Technol., 14, 6, (1996) 955.
9) K. E. Stubjaer, et.al., IEICE Trans. Electron., E82-C, 2, (1999)
338.
10) N. Antoniades, et.al., J. Lightwave Technol., 17, 7, (1999) 1113.
11) S. Watanabe, et.al., ECOC' 97, post-deadline paper TH3A,
(1997) 1.
12) S.Watanabe, et.al., ECOC' 98, post-deadline paper (1998) 85.
13) O. Aso, et.al., To appear ECOC' 99, paper Th B1.5(1999).
14) Haruki Ogoshi, J. IEICE, 82,7, (1999)718. (in Japanese)
15) A. R. Chraplyvy and R. W. Tkach, J. Quantum Electron., 34, 11,
(1998) 2103.
16) K. Mukasa, et.al., ECOC'97, (1997) 127.
17) Y. Miyamoto, et.al., ECOC' 98, post-deadline, (1998) 55.
18) M. Murakami, et.al., ibid., (1998) 79.
19) R. H. Stolen and C. Lin, Phys. Rev. A, 17, 4, (1992) 1448.
20) A. Wada, et.al., ECOC'92, (1992) 71.
21) S. V. Chernikov and J. R. Taylor, Opt. Lett., 21, 24, (1996)
1966.
22) S. Bigo and M. W. Chbat, Symposium on Optical Fiber
Measurement, (1998), p77.
23) M. Tadakuma, et.al., To appear in ECOC'99, paper Th B1.4,
(1999).
24) ibid., To appear in Optical Fiber Measurement Conference
(OFMC'99), (1999).
25) W. H. Press, S. A. Teukolsky, W. T. Vertterling and B. P.
Flannery, " Numerical Receipes in C, Second Edition",
Cambridge University Press, N.Y., USA (1992) Chap.15.
26) L. F. Mollenauer, et.al., Opt. Lett., 21, 21, (1996) 172.
Manuscript received on October 18, 1999.