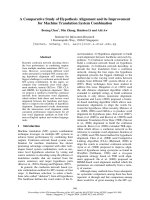
comparative advantage of vietnamese textile and clothing industry
Bạn đang xem bản rút gọn của tài liệu. Xem và tải ngay bản đầy đủ của tài liệu tại đây (423.54 KB, 25 trang )
COMPARATIVE ADVANTAGE OF VIETNAM’S TEXTILE AND CLOTHING
INDUSTRY
(SUMMARY)
A Research Proposal Presented to the Faculty of Graduate School
Southern Luzon State University Lucan, Quezon, Philippines
Thai Nguyen University S.R Vietnam
In Partial Fulfillment of The Requirements
for The Degree Doctor in Business and Administration
SUPERVISOR: ASSOCIATE. PRO. DR NGUYEN KHANH DOANH
STUDENT NAME: LE ANH TUAN
ENGLISH NAME: JOHN
Thai Nguyen, 2013
ABSTRACT
This Study is the first to attempt a systematic evaluation of the comparative
advantage for Vietnam’s Textile and Clothing Industry in the global market.
The study is timely as Vietnam has made an extensive effort to change its
international trade for some years and the consequent increase in competitive
pressures and technology transfers, is expected to have led to a restructuring of
the economy such that the composition of Textile and Clothing exports Volumne
reflects Vietnam’s comparative advantage in the global economy.
The timeliness of the study is also reinforced by the fact that increased trade
integration of Vietnam over the past few years is likely to have contributed to a
shift in comparative advantage in Textlile and Clothing Industry in the world
market.
The Study identifies the pattern of comparative advantage using the
Balassa (1989) index for export data. The index has been calculated at the
sector and commodity level of the Harmonized System of classification. The
paper also analyses comparative advantage according to factor intensity. The
analysis shows broad in the structure of comparative advantage of Vietnam
Textile and Clothing Industry.
I do hope that this paper will serve as a useful source and provide valuable
reference material for researchers and policymakers associated with and
interested in export promotion strategy in Vietnam.
Chapter I
INTRODUCTION
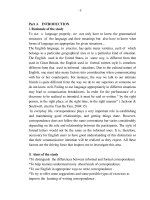
1.1. Problem Statement
The textile industry has long been a pillar of Vietnam’s economy thanks to its
advantage in factor endowments and market scale. After severe times, Vietnam
has made tremendous efforts to become a main component in the textile industry
in Southeast Asia. From humble beginnings since the reunification of its northern
and southern regions, Vietnam has become an important member in the global
textile market. The textile and clothing industry plays a major role in increasing
the country's prosperity. State-owned enterprises make up just 0.5 percent of
Vietnam's businesses; however, 75 percent are joint stock or limited companies.
The Vietnamese textile industry, with more than 3,800 companies, is the leading
export sector.
Vietnam’s textile and garment industry has developed rapidly in recent years and
has become a vital activity within the country’s economy. Export value of textile
and garment products in recent years has been ranking number two in the
country’s total export revenue, earning a major source of foreign exchange and
contributing significantly to Vietnam’s gross national product and budget. In 2006,
the sector exported textiles and garments to the value of 5.8 billion US dollars,
making it Vietnam’s second largest export earner after crude oil. Vietnam’s
joining the WTO in 2007 provided it tremendous opportunity to develop. Vietnam
receives equal treatment and benefits in preferential trade just like other
members of WTO; further, it can access world markets conveniently. The textile
and garment sector has since taken strong and stable development steps. The
trade volume of the textile sector has increased by 7.6 times from 2001 to 2011.
Despite the recent global economic downturn, the sector is seeing impressive
export performance. Export revenue exceeded 11 billion US dollars in 2010, up
24% against 2009, 14 billion US dollars in 2011, accounting for 16.5% of the
country's total export revenue and up 38% against 2010. The production and
exports of Vietnamese textile products contribute a considerable share in the
world, accounting for 18.6% of the world’s total exports in textiles in 2010. The
country ranks fifth worldwide in textile and clothing exports and has a labor force
in that sector of more than 2 million people, representing 4.7% of total
employment within the country, of whom 1.3 million are working directly in the
industry.
Vietnam can be proud of this commendable performance. Consider that its textile
industry was the only sector in the country to maintain its overall growth and
export earnings compared to the previous year. This resulted largely from the
sector’s maintaining its traditional export markets (the US, EU, Japan), and
expanding to new export markets (Korea, Taiwan, the Middle East, and
Singapore) as well as marketing to the domestic market. The sector targets to
ship 15 billion US dollars in 2012, an increase of 11% against 2011.
1.2. Objectives
1.2.1. General Objective
The general objective of this research is to analyze the patterns and dynamics of
Vietnam’s comparative advantage in textile and clothing industry in the period
2001-2011.
1.2.2. Specific Objectives
To systematize the theoretical foundation and empirical evidence of
comparative advantage, making contribution to the development of new
theory about comparative advantage.
To investigate the patterns of Vietnam’s comparative advantage in textile and
clothing.
To analyze the dynamics of Vietnam’s comparative advantage in textile and
clothing.
To assess the determinants of Vietnam’s comparative advantage in textile
and clothing.
To derive policy implications based on the empirical findings.
Chapter II
LITERATURE REVIEW
2.1. Theoretical Foundation
2.2.1 Definition of comparative advantage
Comparative advantage is one of the oldest and most enduring concepts in
economics (Evans, 1989). Comparative advantage is commonly expressed as
international differences in the opportunity costs of goods; that is, the quantity of
other goods sacrificed to make one more unit of that good in one country as
compared to another country. In economics, comparative advantage refers to the
ability of a party to produce a particular good or service at a lower marginal and
opportunity cost over another. Even if one country is more efficient in the
production of all goods (absolute advantage in all goods) than the other, both
countries will still gain by trading with each other, as long as they have different
relative efficiencies.
2.2.2. Theories of comparative advantage
Comparative Advantage framework
Figure 1: Comparative advantage framework
Trade Enhancing National
Policies/ International Policies
(WTO, IMF, World Bank…)
Technology/ Scale
Economies/Supporting
Industries
Quantity and Quality of
Physical and Human
Resources
Demand /Market Size
INDUSTRY
2.1.4. Competitive advantage
Figure 2: Determinants of National Competitive advantage
Competencies/Resources to benefit from
Comparative Advantage and convert it in
to Competitive Advantage
Innovation Strategies
related to Demand Factors
& Product Differentiation
Innovation Strategies
related to Supply
Factors & Supporting
Industries
Business Environment/
Government policies/
Supporting industries
FIRMS
Figure 3: Linking Comparative Advantage and Competitive Advantage
Competencies/Resources to benefit from
Comparative Advantage and convert it in
to Competitive Advantage
Innovation Strategies
related to Demand Factors
& Product Differentiation
Innovation Strategies
related to Supply
Factors & Supporting
Industries
Business Environment/
Government policies/
Supporting industries
FIRMS
Trade Enhancing National
Policies/ International Policies
(WTO, IMF, World Bank…)
Technology/ Scale
Economies/Supporting
Industries
Quantity and Quality of
Physical and Human
Resources
Demand /Market Size
INDUSTRY
Chapter III
RESEARCH METHODOLOGY
3.1. Measuring comparative advantage
3.1.1. Revealed comparative advantage
n
i
iw
iw
n
i
ij
ij
ij
X
X
X
X
RCA
1
1
3.1.2. Trade balance index
Trade Balance Index (TBI) is employed to analyze whether a country has
specialization in export (as net-exporter) or in import (as net-importer) for a
specific group of products (Lafay, 1992). This index is simply formulated as
follows:
ijij
ijij
MX
MX
TBI
3.1.3. Trade specialization
In this dissertation, I measure the trade specialization via the Michaely index
(Michaely, 1967). The computation of this index is presented as follows:
n
i
ij
ij
n
i
ij
ij
M
M
X
X
MI
11
3.1.3. Market share
An indicator of competitiveness is market share, the percentage of a world
commodity market held by an exporter. Shifts in market share reflect changing
competitiveness across countries. Market share (MS) can be defined as:
iw
ij
ij
X
X
MS
3.1.4. Alternative Specifications of Revealed Comparative Advantage
Vollrath (1991) offers three specifications of revealed comparative advantage.
The first is relative trade advantage (RTA) which takes exports and imports into
account. The index is calculated using the following formula:
ijijij
RMARXARTA
Where RXA
ij
stands for relative export advantage, which is RCA index. RMA
ij
stands for relative import advantage, which is computed as follows:
n
i
iw
iw
n
i
ij
ij
ij
M
M
M
M
RMA
1
1
Where M
ij
is imports by country j of commodity i, M
iw
is world imports of
commodity i. Therefore, relative trade advantage equals to:
n
i
iw
iw
n
i
ij
ij
n
i
iw
iw
n
i
ij
ij
ij
M
M
M
M
X
X
X
X
RT A
1
1
1
1
3.2. Analyzing the Structural Stability
3.2.1. Stability of Revealed Comparative Advantage
ij
t
ijii
t
ij
RCARCA
12
3.2.2. Intra-Distribution Dynamics
In this dissertation, the transition probability matrix is constructed using
Hinloopen and van Marrewijk (2001). The transition probability matrix provides
some empirical insights into the dynamic nature of comparative advantage from
time t to time t+1. It determines the probability of moving between different
classes of comparative advantage. Hinloopen and van Marrewijk (2001)
decomposed the interpretation of RCA index in four categories (class a, b, c, and
d).
Class a (0<RCA≤1): refers to commodities with a comparative
disadvantage.
Class b (1<RCA≤2): refers to commodities with weak comparative
advantage.
Class c (2<RCA≤4): refers to commodities with medium comparative
advantage.
Class d (4<RCA): refers to commodities with strong comparative
advantage.
3.3. Measure of Export Concentration
In this dissertation, the commodity concentration is determined using the
Herfindahl index (S
j,t
). The index for the country j at year t is computed as follows:
n
i
ijtjt
sS
1
2
where
n
i
ijt
ijt
X
X
s
1
X
ij,t
is country j’s export of commodity i in year t, n is total number of commodities
in the country j. It follows that s
ijt
is the share of export of commodity i in country
j’s total exports. The value of the Herfindahl index ranges from 0 to 1. The higher
the index the more specialized in export the country is, with maximum
concentration when the index equals to unity.
3.4. Trade Compatibility
The trade compatibility index measures the degree of compatibility between
Vietnam’s exported products and those products imported by the foreign market.
The index of compatibility (C
x/m
) is computed using the following formula:
n
i
ikijmx
mxC
1
/
2
1
1
3.5. Data sources
The present analysis is based on the annual time series data on Vietnam’s
exports and imports, compiled by UNComtrade. The data have been collected at
3- and 4-digit Standard International Trade Classification (SITC) over the period
1998 to 2011.
Chapter IV
EMPRICAL FINDINGS
4.1. Vietnam’s Export Performance in Textile and Clothing
4.1.1. Overview of Vietnam’s Economy and Textile and Clothing Exports
Table 1: Basic Economic Indicators of Vietnam
Indicators
2001
2004
2007
2010
2011
GDP growth (percent)
6.90
7.79
8.46
6.78
5.89
GDP, current prices (billion
USD)
32.52
45.45
71.11
103.58
122.72
GDP per capita (USD)
413.34
554.07
835.10
1173.56
1374.01
Total investment
31.17
35.47
43.13
38.56
29.50
Inflation (percent)
-0.31
7.90
8.35
9.21
18.68
Export growth (percent)
12.70
25.99
10.27
6.71
3.84
Import growth (percent)
11.74
23.09
26.45
5.86
-3.87
Source: International Monetary Fund
Table 2: Contribution of Textile and Clothing to Vietnam’s Total Exports
Commodity
group
2001
2004
2007
2008
2009
2010
2011
Textile (SITC-65)
2.34
2.42
2.72
2.49
3.52
4.24
3.89
Clothing (SITC-
84)
12.42
16.05
15.24
13.92
14.96
14.38
13.57
Total
14.76
18.46
17.96
16.41
18.47
18.62
17.46
Source: The author’s own calculation
Table 3: Annual Growth Rate of Vietnam’s Textile and Clothing Exports (in
percent)
Commodity
Group
2001-2004
2004-2007
2007-2011
2001-2011
Textile (SITC-65)
22.05
27.30
29.96
26.75
Clothing (SITC-
84)
31.56
20.31
15.45
21.56
Textile and
Clothing
30.14
21.27
18.02
22.52
Total Exports
20.79
22.39
18.85
20.49
Source: The author’s own calculation
4.1.2. Structure of Vietnam’s Textile and Clothing Exports
Table 4: Structure of Vietnam’s Textile and Clothing Exports (in percent)
Commodity Group
2001
2004
2007
2010
2011
SITC-65
15.88
13.10
15.15
22.76
22.28
SITC-651
5.39
3.87
4.75
9.84
10.18
SITC-652
1.09
0.33
0.25
0.18
0.27
SITC-653
1.90
1.72
2.01
2.01
1.94
SITC-654
0.33
0.16
0.18
0.08
0.11
SITC-655
0.18
0.31
0.86
1.15
1.25
SITC-656
0.27
0.35
0.23
0.20
0.17
SITC-657
1.49
1.15
1.62
3.07
3.36
SITC-658
4.80
5.02
5.10
6.05
4.87
SITC-659
0.41
0.19
0.15
0.16
0.13
SITC-84
84.12
86.90
84.85
77.24
77.72
SITC-841
33.78
26.75
22.02
17.38
18.97
SITC-842
15.49
19.93
21.21
16.99
16.99
SITC-843
2.29
7.34
5.40
6.43
6.40
SITC-844
2.87
10.78
10.28
9.34
9.47
SITC-845
23.98
18.17
22.33
23.88
22.66
SITC-846
3.60
1.60
1.36
1.20
1.28
SITC-848
2.11
2.33
2.25
2.01
1.94
Total
100.00
100.00
100.00
100.00
100.00
Source: The author’s own calculation
4.1.3. Direction of Vietnam’s textile and
Table 5: Top 10 Textile and Clothing Export Markets of Vietnam (in percent)
Countries
2001
2004
2007
2011
China
16.93
22.35
31.01
37.85
Italy
8.35
7.89
7.21
5.81
Germany
5.89
5.82
5.71
5.48
India
3.49
3.36
3.53
4.59
Turkey
3.38
4.15
4.14
3.79
France
3.69
3.57
3.32
2.62
Vietnam
0.61
1.10
1.54
2.55
United States
5.27
3.73
2.72
2.47
Belgium
3.27
3.22
3.03
2.45
Korea
4.81
3.32
2.21
2.16
Rest of the World
44.32
41.49
35.59
30.24
World
100.00
100.00
100.00
100.00
Source: The author’s own calculation
Table 6: Importance of Vietnam in World Exports of Textile and Clothing Exports
Năm
Vietnam’s Exports (Million
USD)
World Exports (Million USD)
Share of Vietnam in World
Exports (%)
SITC-65
SITC-84
Total
SITC-65
SITC-84
Total
SITC-65
SITC-84
Total
1997
143.90
1,383.86
1,527.76
142,050.
37
167,029.
48
309,079.
86
0.10
0.83
0.49
1998
156.08
1,301.92
1,458.00
136,975.
65
167,961.
10
304,936.
75
0.11
0.78
0.48
1999
369.84
1,622.06
1,991.89
133,306.
56
166,844.
11
300,150.
68
0.28
0.97
0.66
2000
298.59
1,821.20
2,119.79
139,311.
10
181,080.
48
320,391.
58
0.21
1.01
0.66
2001
352.36
1,866.51
2,218.86
134,635.
92
179,185.
99
313,821.
92
0.26
1.04
0.71
2002
423.51
2,632.68
3,056.19
141,078.
51
190,362.
21
331,440.
72
0.30
1.38
0.92
2003
472.59
3,464.67
3,937.27
159,640.
94
219,370.
88
379,011.
82
0.30
1.58
1.04
2004
640.59
4,249.87
4,890.46
178,752.
40
245,022.
01
423,774.
41
0.36
1.73
1.15
2005
725.44
4,680.63
5,406.08
187,292.
52
263,416.
39
450,708.
90
0.39
1.78
1.20
2006
1,057.97
5,579.14
6,637.11
202,153.
82
293,885.
02
496,038.
84
0.52
1.90
1.34
2007
1,321.37
7,400.35
8,721.73
219,925.
49
331,227.
34
551,152.
83
0.60
2.23
1.58
2008
1,562.61
8,724.43
10,287.0
5
230,399.
99
336,417.
80
566,817.
79
0.68
2.59
1.81
2009
2,008.72
8,539.54
10,548.2
6
193,940.
08
293,474.
19
487,414.
27
1.04
2.91
2.16
2010
3,060.81
10,389.6
0
13,450.4
0
232,974.
11
324,545.
30
557,519.
42
1.31
3.20
2.41
2011
3,769.68
13,149.0
7
16,918.7
5
272,077.
79
379,841.
96
651,919.
76
1.39
3.46
2.60
Source: The UNComtrade
4.2. Patterns of Vietnam’s Comparative Advantage in Textile and Clothing
4.2.1. Patterns of Vietnam’s Comparative Advantage in Textile and Clothing
The summary of statistics of Vietnam’s revealed comparative advantage in textile
and clothing is presented in Table 4.
Table 7: Summary of Statistics
Indicators
2001
2004
2007
2011
0< RCA 1
0.53
0.46
0.44
0.46
1< RCA 2
0.19
0.11
0.07
0.08
2< RCA 4
0.14
0.16
0.23
0.11
RCA > 4
0.15
0.27
0.26
0.34
Mean
2.15
3.56
3.09
3.19
Maximum
20.47
36.73
23.24
17.03
Standard Deviation
1.89
3.00
2.58
2.81
Source: The author’s own calculation
Table 8: Measures of Trade Specialization
Year
Mean
RCA
Share of
RCA>1
Mean
RMA
Share of
RMA >1
Mean
RTA
Share of
RTA >0
2001
2.15
0.47
2.62
0.33
-0.44
0.51
2002
2.83
0.52
3.63
0.42
-0.76
0.50
2003
3.43
0.58
3.63
0.44
-0.20
0.47
2004
3.56
0.54
3.87
0.44
-0.31
0.50
2005
3.24
0.54
4.30
0.44
-1.06
0.51
2006
3.33
0.56
4.71
0.47
-1.38
0.52
2007
3.09
0.56
4.16
0.46
-1.07
0.51
2008
3.00
0.59
3.92
0.47
-0.92
0.53
2009
3.06
0.60
3.90
0.47
-0.84
0.52
2010
3.34
0.60
4.20
0.48
-0.86
0.52
2011
3.19
0.55
4.20
0.48
-1.01
0.51
Source: The author’s own calculation
Table 9: Vietnam’s Revealed Comparative Advantage in Textile and
Clothing
Commodity Group
2001
2004
2007
2010
2011
SITC-65
0.99
1.14
1.58
2.52
2.33
SITC-651
1.56
1.59
2.43
5.45
5.38
SITC-652
0.43
0.19
0.20
0.17
0.24
SITC-653
0.64
0.89
1.36
1.62
1.38
SITC-654
0.32
0.23
0.34
0.23
0.28
SITC-655
0.12
0.28
0.89
1.24
1.27
SITC-656
0.44
0.78
0.60
0.65
0.56
SITC-657
1.00
1.03
1.67
3.30
3.41
SITC-658
2.35
2.91
3.14
3.61
2.83
SITC-659
0.43
0.28
0.26
0.30
0.23
SITC-84
3.95
5.54
5.87
6.14
5.82
SITC-841
7.64
8.84
8.41
8.66
8.86
SITC-842
3.33
5.33
6.51
6.79
6.67
SITC-843
2.11
8.39
5.52
7.67
6.86
SITC-844
1.64
7.24
6.13
5.90
5.58
SITC-845
3.62
3.71
4.68
5.94
5.44
SITC-846
2.50
1.57
1.58
1.28
1.28
SITC-848
1.28
1.96
2.43
2.15
2.01
Textile and Clothing
2.68
3.30
3.60
3.68
3.53
4.2.2. The Dynamics of Vietnam’s Comparative Advantage in Textile and
Clothing
Table 10: Galtonian Regression
Start
Year
End
Year
α
β
R
β/R
P-value
2001
2002
0.079
0.960
0.905
1.061
0.000
2002
2003
0.033
0.953
0.927
1.027
0.000
2003
2004
-0.015
0.952
0.945
1.007
0.000
2004
2005
0.004
0.935
0.956
0.978
0.000
2005
2006
0.028
0.961
0.940
1.023
0.000
2006
2007
0.031
0.927
0.956
0.970
0.000
2007
2008
0.018
0.923
0.944
0.978
0.000
2008
2009
0.021
0.033
0.946
0.035
0.000
2009
2010
-0.012
1.019
0.969
1.051
0.000
2010
2011
-0.024
0.999
0.990
1.009
0.000
2001
2011
0.134
0.738
0.675
1.090
0.000
Table 11: Transition Probability Matrix 2001-2011
RCA
a
b
c
d
a
0.73
0.08
0.04
0.16
b
0.33
0.00
0.22
0.45
c
0.08
0.15
0.23
0.54
d
0.00
0.14
0.14
0.71
Initial distribution
0.53
0.19
0.14
0.15
Final distribution
0.46
0.08
0.11
0.34
Source: The author’s own computation
Table 12: Mobility Indices
Year
M
1
M
2
M
3
2001-2004
0.57
0.96
0.17
2004-2007
0.50
0.99
0.83
2007-2011
0.49
0.91
0.17
2001-2011
0.78
0.99
0.83
Source: The author’s own computation
4.2.3. Concentration of Vietnam Textile and Clothing Exports
Table 13: Herfindahl Index
SITC
2001
2004
2007
2010
2011
SITC-65
0.25
0.28
0.28
0.31
0.30
SITC-84
0.30
0.23
0.24
0.24
0.24
Total
0.26
0.20
0.21
0.20
0.20
Source: The author’s own computation
4.3. Determinants of Vietnam’s Comparative Advantage and
Competitiveness in Textile and Clothing
Table 14A: Tariff rates applied by Vietnam on Imports of Textile (in percent)
SITC-65
2001
2004
2007
2010
ASEAN
32.07
11.10
3.94
3.99
EU
33.89
33.52
31.61
10.34
NAFTA
29.42
32.09
31.32
10.11
World
32.10
29.41
24.97
8.68
China
32.22
32.31
24.18
9.69
Japan
31.04
31.35
30.09
7.91
Korea, Rep.
31.18
31.69
30.43
9.63
United States
29.19
32.06
31.43
10.07
Source: UN
Table 14B: Tariff rates applied by Vietnam on Imports of Clothing (in
percent)
SITC-84
2001
2004
2007
2010
ASEAN
46.73
12.85
4.81
4.75
EU
47.33
46.96
44.52
20.16
NAFTA
42.84
44.46
45.36
19.99
World
46.83
37.68
31.98
16.09
China
47.37
47.71
33.66
19.57
Japan
46.84
45.32
45.55
16.87
Korea, Rep.
47.70
47.02
37.95
19.66
United States
44.15
46.14
45.99
20.28
Source: UN
4.4. Trade Complementary and Forecasting Vietnam’s Potential Exports
Table 15: Trade Complementary
Year
EU
NAFTA
WORLD
ASEAN
2001
0.496
0.482
0.51
0.69
2002
0.408
0.405
0.44
0.66
2003
0.379
0.367
0.40
0.63
2004
0.374
0.355
0.40
0.63
2005
0.363
0.326
0.38
0.64
2006
0.335
0.332
0.36
0.60
2007
0.305
0.287
0.33
0.60
2008
0.286
0.281
0.32
0.65
2009
0.268
0.272
0.30
0.63
2010
0.284
0.275
0.31
0.66
2011
0.275
0.285
0.30
0.64
Source: The author’s own calculation
Chapter V
CONCLUSION AND POLICY RECOMMENDATIONS
5.1. Conclusion: To foster future production and export, so as to reach
continuing development in textile and clothing industry, more relevant policy
should be implemented to move the economy and its export sector towards a
desirable comparative advantage structure. Based on the above analysis, some
policy recommendations are made as follows.
5.2. Policy Recommendations
Enhancing human capital and raise technology capacity of textile and clothing
firms. Optimization of industry structure, enhancement in human capital and
technology are preconditions to continuing development, comparative advantage,
technological innovation as well as to industrial upgrade in Vietnam’s textile
industry. In recent years, a large number textile firms in Vietnam have capitalized
on outward processing using the country’s unskilled and cheap labor. This
outward processing does not generally require very high levels of technology.
The excessive reliance on cheap labor and backward technology to promote
exports has prevented Vietnam from moving up the comparative advantage
ladder.
In addition, the government and industry associations ought to analyze
Agreement on Textiles and Clothing (ATC) to find good means for Vietnam’s
textile exports, improve policy cooperation with other countries, investigate trade
policies of textile importing countries, introduce flexible measures to stimulate
exports, and settle trade disputes through negotiation within WTO framework
with other WTO members. Vietnamese government and industrial associations
should make active efforts to establish a government-guided industrial early-
warning system which involves government, industrial associations and firms.
Government and industrial associations should also construct industrial
information centers and databases. In order to overcome technical trade barriers,
government and enterprises should provide textile enterprises with assistance,
especially in information collection toward technology statutes, technique
standards and assessing procedures.
The government also needs to provide incentives and practical support for textile
and clothing firms to raise their technology capacity through R&D activities. On
the firm level, firms in the textile industry ought to strengthen input on R&D,
persistently improve technology and release new products into international
market as well as impose new technology to present categories. Technology is
the soul for enterprises’ development and core to competitive advantage, while
technological innovation practitioners are enterprises.
Government’s effective regulation and establishment of industrial early-warning
system. While official interferences were widely employed among the
Vietnamese government to control exports, market method, which includes
exchange rate, drawbacks and exporting tariffs, should mainly be adopted by the
government in the current market economy to regulate market order and textile
export.