Corrosion Control Through Organic Coatings Part 10 pot
Bạn đang xem bản rút gọn của tài liệu. Xem và tải ngay bản đầy đủ của tài liệu tại đây (559.08 KB, 10 trang )
132
Corrosion Control Through Organic Coatings
most automotive tests, including the cyclic corrosion tests, have been developed
using coatings relevant to automotive application. These are designed to act quite
different from protective coatings. Automotive-derived test methods commonly over-
look factors critical to protective coatings, such as weathering and UV factors. In
addition, automotive coatings have much lower dry film thickness than do many
protective coatings; this is important for mass-transport phenomena.
This section is not intended as an overview of automotive industry tests. Some
tests that have good correlation to actual field service for cars and trucks, such as
the Ford APGE, Nissan CCT-IV, and GM 9540P [4], are not described here. The
three tests described here are those believed to be adaptable to heavy maintenance
coatings VDA 621-415, the Volvo Indoor Corrosion Test (VICT), and the Society
of Automotive Engineers (SAE) J2334.
8.1.4.1 VDA 621-415
For many years, the automotive industry in Germany has used an accelerated test
method for organic coatings called the VDA 621-415 [5]; this test has begun to be
used as a test for heavy infrastructure paints also. The test consists of 6 to 12 cycles
of neutral salt spray (as per DIN 50021) and 4 cycles in an alternating condensation
water climate (as per DIN 50017). The time-of-wetness of the test is very high, which
implies poor correlation to actual service for zinc pigments or galvanized steel. It is
expected that zinc will undergo a completely different corrosion mechanism in the
nearly constant wetness of the test than the mechanism that takes place in actual field
service. The ability of the test to predict the actual performance of zinc-coated sub-
strates and zinc-containing paints must be carefully examined because these materials
are commonly used in the corrosion engineering field. Also, the start of the test (24
hours of 40
°
C salt spray) has been criticized as unrealistically harsh for latex coatings.
8.1.4.2 Volvo Indoor Corrosion Test or Volvo-cycle
The VICT [6] was developed — despite its name — to simulate the
outdoor
corrosion environment of a typical automobile. Unlike many accelerated corrosion
tests, in which the test procedure is developed empirically, the VICT test is the result
of a statistical factorial design [7, 8].
In modern automotive painting, all of the corrosion protection is provided by
the inorganic layers and the thin (circa 25 µm) electrocoat paint layer. Protection
against UV light and mechanical damage is provided by the subsequent paint layers
(of which there are usually three). Testing of the
anticorrosion
or electrocoat paint
layer can be restricted to a few parameters, such as corrosion-initiating ions (usually
chlorides), time-of-wetness, and temperature. The Volvo test accordingly uses no
UV exposure or mechanical stresses; the stresses used are temperature, humidity,
and salt solution (sprayed or dipped).
The automotive industry has a huge amount of data for corrosion in various
service environments. The VICT has a promising correlation to field data; one
criticism that is sometimes brought against this test is that it may tend to produce
filiform corrosion at a scribe.
7278_C008.fm Page 132 Friday, February 3, 2006 3:01 PM
© 2006 by Taylor & Francis Group, LLC
Corrosion Testing — Practice
133
There are four variants of the Volvo-cycle, consisting of either constant temper-
ature together with two levels of humidity or of a constant dew point (i.e., varying
temperature and two levels of humidity). The VICT-2 variant, which uses constant
temperature and discrete humidity transitions between two humidity levels, is
described below.
•
Step I:
7 hours exposure at 90% relative humidity (RH) and 35
°
C constant
level.
•
Step II:
Continuous and linear change of RH from 90% RH to 45% RH
at 35
°
C during 1.5 hours.
•
Step III:
2 hours exposure at 45% RH and 35
°
C constant level.
•
Step IV:
Continuous and linear change of RH from 45% to 90% RH at
35
°
C during 1.5 hours.
Twice a week, on Mondays and Fridays, step I above is replaced by the following:
•
Step V:
Samples are taken out of the test chamber and submerged in, or
sprayed with, 1% (wt.) NaCl solution for 1 hour.
•
Step VI:
Samples are removed from the salt bath; excess liquid is drained
off for 5 minutes. The samples are put back into the test chamber at 90%
RH so that they are exposed in wetness for at least 7 hours before the
drying phase.
Typically the VICT test is run for 12 weeks. This is a good general test when UV
is not expected to be of great importance.
8.1.4.3 SAE J2334
The SAE J2334 is the result of a statistically designed experiment using automotive
industry substrates and coatings. In the earliest publications about this test, it is also
referred to as “PC-4” [4]. The test is based on a 24-hour cycle. Each cycle consists
of a 6-hour humidity period at 50
°
C and 100% RH, followed by a 15-minute salt
application, followed by a 17 hours and 45 minute drying stage at 60
°
C and 50%
RH. Typical test duration is 60
cycles; longer cycles have been used for heavier
coating weights. The salt concentrations are fairly low, although the solution is
relatively complex: 0.5% NaCl
+
0.1% CaCl
2
+
0.075% NaHCO
3
.
8.1.5 A
TEST
TO
A
VOID
: K
ESTERNICH
In the Kesternich test, samples are exposed to water vapor and sulfur dioxide for
8 hours, followed by 16 hours in which the chamber is open to the ambient environment
of the laboratory [2]. This test was designed for bare metals exposed to a polluted
industrial environment and is fairly good for this purpose. However, the test’s relevance
for organically coated metals is highly questionable. For the same reason, the similar
test ASTM B-605 is not recommended for painted steel.
7278_C008.fm Page 133 Friday, February 3, 2006 3:01 PM
© 2006 by Taylor & Francis Group, LLC
134
Corrosion Control Through Organic Coatings
8.2 EVALUATION AFTER ACCELERATED AGING
After the accelerated aging, samples should be evaluated for changes. By comparing
samples before and after aging, one can find:
• Direct evidence of corrosion
• Signs of coating degradation
• Implicit signs of corrosion or failure
The coatings scientist uses a combination of techniques for detecting macroscopic
and submicroscopic changes in the coating-substrate system. The quantitative and
qualitative data this provides must then be interpreted so that a prediction can be
made as to whether the coating will fail, and if possible, why.
Macroscopic
changes can be divided into two types:
1. Changes that can be seen by the unaided eye or with optical (light)
microscopes, such as rust-through and creep from scribe
2. Large-scale changes that are found by measuring mechanical properties,
of which the most important are adhesion to the substrate and the ability
to prevent water transport
Changes in both the adhesion values obtained in before-and-after testing and in the
failure loci can reveal quite a bit about aging and failure mechanisms. Changes in
barrier properties, measured by electrochemical impedance spectroscopy (EIS), are
important because the ability to hinder transport of electrolyte in solution is one of
the more important corrosion-protection mechanisms of the coating.
One may be tempted to include such parameters as loss of gloss or color change
as macroscopic changes. However, although these are reliable indicators of UV
damage, they are not necessarily indicative of any weakening of the corrosion-
protection ability of the coating system as a whole, because only the appearance of
the topcoat is examined.
Submicroscopic
changes cannot be seen with the naked eye or a normal labo-
ratory light microscope but must instead be measured with advanced electrochemical
or spectroscopic techniques. Examples include changes in chemical structure of the
paint surface that can be found using Fourier transform infrared spectroscopy (FTIR)
or changes in the morphology of the paint surface that can be found using atomic
force microscopy (AFM). These changes can yield information about the coating-metal
system, which is then used to predict failure, even if no macroscopic changes have
yet taken place.
More sophisticated studies of the effects of aging factors on the coating include:
• Electrochemical monitoring techniques: AC impedance (EIS), Kelvin probe
• Changes in chemical structure of the paint surface using FTIR or x-ray
photoelectron spectroscopy (XPS)
• Morphology of the paint surface using scanning electron microscopy
(SEM) or AFM
7278_C008.fm Page 134 Friday, February 3, 2006 3:01 PM
© 2006 by Taylor & Francis Group, LLC
Corrosion Testing — Practice
135
8.2.1 G
ENERAL
C
ORROSION
Direct evidence of corrosion can be obtained by macroscopic measurement of creep
from scribe, rust intensity, blistering, cracking, and flaking.
8.2.1.1 Creep from Scribe
If a coating is properly applied to a well-prepared surface and allowed to cure, then
general corrosion across the intact paint surface is not usually a major concern.
However, once the coating is scratched and metal is exposed, the situation is dra-
matically different. The metal in the center of the scratch has the best access to
oxygen and becomes cathodic. Anodes arise at the sides of the scratch, where paint,
metal, and electrolyte meet [9]. Corrosion begins here and can spread outward from
the scratch under the coating. The coating’s ability to resist this spread of corrosion
is a major concern.
Corrosion that begins in a scratch and spreads under the paint is called
creep
or
undercutting.
Creep is surprisingly difficult to quantify, because it is seldom uniform.
Several methods are acceptable for measuring it, for example:
• Maximum one-way creep (probably the most common method), which is
used in several standards, such as ASTM
S1654
• Summation of creep at ten evenly spaced sites along the scribe
• Average two-way creep
None of these methods is satisfactory for describing filiform corrosion. The maxi-
mum one-way creep and the average two-way creep methods allow measurement
of two values: general creep and filiform creep.
8.2.1.2 Other General Corrosion
Blistering, rust intensity, cracking, and flaking are judged in accordance with the
standard ISO 4628 or the comparable standard ASTM D610. In these methods, the
samples to be evaluated are compared to a set of standard photographs showing
various degrees of each type of failure.
For face blistering, the pictures in the ISO standard represent blister densities
from 2 to 5, with 5 being the highest density. Blister size is also numbered from
2 to 5, with 5 indicating the largest blister. Results are reported as blister density
followed in parentheses by blister size (e.g., 4(S2) means blister density = 4 and
blister size = 2); this is a way to quantify the result, “many small blisters.”
For degree of rusting, the response of interest is rust under the paint, or rust
bleed-through. Areas of the paint that are merely discolored on the surface by rusty
runoff are not counted if the paint underneath is intact. The scale used by ISO 4628
in assigning degrees of rusting is shown in Table 8.1 [10].
Although the ASTM and ISO standards are comparable in methodology, their
grading scales run in opposite directions. In measuring rust intensity or blistering,
7278_C008.fm Page 135 Friday, February 3, 2006 3:01 PM
© 2006 by Taylor & Francis Group, LLC
Corrosion Testing — Practice
137
modes and can vary greatly across the interface. This leads to an interesting conun-
drum: the fundamental understanding of the wetting of a substrate by a liquid coating,
and the subsequent adhesion of the cured coating to the substrate is one of the best-
developed areas of coatings science, yet methods for the practical measurement of
adhesion are comparatively crude and unsophisticated.
It has been shown that experimentally measured adhesion strengths consist of
basic adhesion plus contributions from extraneous sources. Basic adhesion is the
adhesion that results from intermolecular interactions between the coating and the
substrate; extraneous contributions include internal stresses in the coating and defects
or extraneous processes introduced in the coating as a result of the measurement
technique itself [11]. To complicate matters, the latter can decrease basic adhesion
by introducing new, unmeasured stresses or can increase the basic adhesion by
relieving preexisting internal stresses.
The most commonly used methods of detaching coatings are applying a normal
force at the interface plane or applying lateral stresses.
8.2.2.2 Direct Pull-off Methods
Direct pull-off (DPO) methods measure the force-per-unit area necessary to detach
two materials, or the work done (or energy expended) in doing so. DPO methods
employ normal forces at the coating-substrate interface plane. The basic principle
is to attach a pulling device (a stub or dolly) to the coating by glue, usually
cyanoacrylates, and then to apply a force to it in a direction perpendicular to the
painted surface, until either the paint pulls off the substrate or failure occurs within
the paint layers (see Figure 8.1).
An intrinsic disadvantage of DPO methods is that failure occurs at the weakest
part of the coating system. This can occur cohesively within a coating layer; adhe-
sively between coating layers, especially if the glue has created a weak boundary
layer within the coating; or adhesively between the primer layer and the metal
FIGURE 8.1
Direct pull-off adhesion measurement.
Glue
Glue
Coating
Metal dolly
Metal substrate
Coating
Weak boundary layer
7278_C008.fm Page 137 Friday, February 3, 2006 3:01 PM
© 2006 by Taylor & Francis Group, LLC
138
Corrosion Control Through Organic Coatings
substrate, depending on which is the weakest link in the system. Therefore, adhesion
of the primer to the metal is not necessarily what this method measures, unless it
is at this interface that the adhesion is the weakest.
DPO methods suffer from some additional disadvantages:
• Tensile tests usually involve a complex mixture of tensile and shear forces
just before the break, making interpretation difficult.
• Stresses produced in the paint layer during setting of the adhesive may
affect the values measured (a glue/paint interactions problem).
• Nonuniform tensile load distributions over the contact area during the
pulling process may occur. Stress concentrated in a portion of the contact
area leads to failure at these points at lower values than would be seen
under even distribution of the load. This problem usually arises from the
design of the pulling head.
Unlike lateral stress methods, DPO methods can be used on hard or soft coatings.
As previously mentioned, however, for a well-adhering paint, these methods tend to
measure the cohesive strength of the coating, rather than its adhesion to the substrate.
With DPO methods, examination of the ruptured surface is possible, not only
for the substrate but also for the test dolly. A point-by-point comparison of substrate
and dolly surfaces makes it possible to fairly accurately determine interfacial and
cohesive failure modes.
8.2.2.3 Lateral Stress Methods
Methods employing lateral stresses to detach a coating include bend or impact tests
and scribing the coating with a knife, as in the cross-cut test.
In the cross-cut test, which is the most commonly used of the lateral stress
methods, knife blades scribe the coating down to the metal in a grid pattern. The
spacing of the cuts is usually determined by the coating thickness. Standard guide-
lines are given in Table 8.2. The amount of paint removed from the areas adjacent
to, but not touched by, the blades is taken as a measurement of adhesion. A standard
scale for evaluation of the amount of flaking is shown in Table 8.3.
Analysis of the forces involved is complex because both shear and peel can
occur in the coating. The amount of shearing and peeling forces created at the knife
TABLE 8.2
Spacing of Cuts in Cross-Cut Adhesion
Coating thickness Spacing of the cuts
Less than 60 µm 1 mm
60 µm–120 µm 2 mm
Greater than 120 µm 3 mm
7278_C008.fm Page 138 Friday, February 3, 2006 3:01 PM
© 2006 by Taylor & Francis Group, LLC
140
Corrosion Control Through Organic Coatings
8.2.2.4 Important Aspects of Adhesion
The failure loci — where the failure occurred — can yield very important informa-
tion about coating weaknesses and eventual failures. Changes in failure loci related
to aging of a sample are especially revealing about what is taking place within and
under a coating system.
Adhesion measurements are performed to gain information regarding the mechan-
ical strengths of the coating-substrate bonds and the deterioration of these bonds when
the coatings undergo environmental stresses. A great deal of work has been done to
develop better methods for measuring the strengths of the initial coating-substrate bonds.
By comparison, little attention has been given to using adhesion tests to obtain
information about the mechanism of deterioration of either the coating or its adhesion
to the metal. This area deserves greater attention because studying the failure loci
in adhesion tests before and after weathering can yield a great deal of information
about why coatings fail.
Finally, it is important to remember that adhesion is only one aspect of corrosion
protection. At least one study shows that the coating with the best adhesion to the
metal did not provide the best corrosion protection [12]. Also, studies have found
that there is no obvious relationship between initial adhesion and wet adhesion [13].
8.2.3 B
ARRIER
P
ROPERTIES
Coatings, being polymer-based, are naturally highly resistant to the flow of electric-
ity. This fact is utilized to measure water uptake by and transport through the coating.
The coating itself does not conduct electricity; any current passing through it is
carried by electrolytes in the coating. Measuring the electrical properties of the
coating makes it possible to calculate the amount of water present (called
water
content
or
solubility
) and how quickly it moves (called
diffusion coefficient
). The
technique used to do this is EIS.
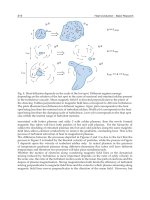
An intact coating is described in EIS as a general equivalent electrical circuit,
also known as the
Randles model
(see Figure 8.2). As the coatings become more
porous or local defects occur, the model becomes more complex (see Figure 8.3).
FIGURE 8.2
Equivalent electric circuit to describe an intact coating. R
sol
is the solution resis-
tance, C
paint
is the capacitance of the paint layer, and R
paint
is the resistance of the paint layer.
C
paint
R
paint
R
sol
7278_C008.fm Page 140 Friday, February 3, 2006 3:01 PM
© 2006 by Taylor & Francis Group, LLC
142 Corrosion Control Through Organic Coatings
that for a coating to provide corrosion protection to steel, it should have an initial
impedance of at least 10
8
/cm
2
, a value also suggested by others [15], and that
after aging, the impedance should have decreased by no more than three orders
of magnitude. Sekine has reported blistering when the coating resistance falls
below 10
6
/cm
2
, regardless of coating thickness [17-19].
For more in-depth reviews of the fundamental concepts and models used in EIS
to predict coating performance, the reader is directed to the research of Kendig and
Scully [20] and Walter [21-23].
8.2.4 SCANNING KELVIN PROBE
The scanning Kelvin probe (SKP) provides a measure of the Volta potential (work
function) that is related to the corrosion potential of the metal, without touching the
corroding surface [24]. The technique can give a corrosion potential distribution,
with a spatial resolution of 50 to 100 µm, below highly isolating polymer films. The
SKP is an excellent research tool to study the initiation of corrosion at the metal/poly-
mer interface.
Figures 8.4 and 8.5 show the Volta potential distribution for a coil-coated sample
before and after 5 weeks of weakly accelerated field testing [25]. In the “after”
FIGURE 8.4 Volta distribution (mV) of coated steel before exposure.
Source: Forsgren, A. and Thierry, D., SCI Rapport 2001:4E. Swedish Corrosion Institute
(SCI), Stockholm, 2001. Photo courtesy of SCI.
−293 mV
−510 mV
−293
−365
−438
−510
(mV)
100 mV
28.00 mm i 5 p/mm
10.00 mm
2 p/mm
SCI
R612
7278_C008.fm Page 142 Friday, February 3, 2006 3:01 PM
© 2006 by Taylor & Francis Group, LLC
144 Corrosion Control Through Organic Coatings
8.2.6 ADVANCED ANALYTICAL TECHNIQUES
For the research scientist or the well-equipped failure analysis laboratory, several
advanced analytical techniques can prove useful in studying protective coatings. Many
such techniques are based on detecting charged particles that come from, or interact
with, the surface in question. These require high (10
–5
or 10
–7
torr) or ultrahigh vacuum
(less than 10
–8
torr), which means that samples cannot be studied in situ [26].
8.2.6.1 Scanning Electron Microscopy
Unlike optical microscopes, SEM does not use light to examine a surface. Instead,
SEM sends a beam of electrons over the surface to be studied. These electrons
interact with the sample to produce various signals: x-rays, back-scattered electrons,
secondary electron emissions, and cathode luminescence. Each of these signals has
slightly different characteristics when they are detected and photographed. SEM has
very high depth of focus, which makes it a powerful tool for studying the contours
of surfaces.
Electron microscopes used to be found only in research institutes and more
sophisticated industrial laboratories. They have now become more ubiquitous; in
fact, they are an indispensable tool in advanced failure analysis and are found in
most any laboratory dealing with material sciences.
8.2.6.2 Atomic Force Microscopy
AFM provides information about the morphology of a surface. Three-dimensional
maps of the surface are generated, and some information of the relative hardness of
areas on the surface can be obtained. AFM has several variants for different sample
surfaces, including contact mode, tapping mode, and phase contrast AFM. Soft poly-
mer surfaces, such as those found in many coatings, tend to utilize tapping mode AFM.
In waterborne paint research, AFM has proven an excellent tool for studying
coalescence of latex coatings [27-30]. It has also been used to study the initial effect
of waterborne coatings on steel before film formation can occur, as shown in Figures
8.6 and 8.7 [31].
8.2.6.3 Infrared Spectroscopy
Infrared spectroscopy is a family of techniques that can be used to identify
chemical bonds. When improved by Fourier transform mathematical techniques,
the resulting test is known as FTIR. An FTIR scan can be used to identify
compounds rather in the same way as fingerprints are used to identify humans:
an FTIR scan of the sample is compared to the FTIR scans of “known” com-
pounds. If a positive match is found, the sample has been identified; an example
is shown in Figure 8.8. Not surprisingly, FTIR results are sometimes called
“fingerprints” by analytical chemists.
7278_C008.fm Page 144 Friday, February 3, 2006 3:01 PM
© 2006 by Taylor & Francis Group, LLC
Corrosion Testing — Practice 147
it. It can be a powerful research tool and has been used, for example, to characterize
the anodic oxide films on platinum that resulted from different anodizing methods
[34]. It is also extremely useful for confirming theories of mechanisms in cases
where the presence or absence of one or more elements is significant.
8.2.6.5 Electrochemical Noise Measurement
Electrochemical noise measurement (ENM) has attracted attention since it was first
applied to anticorrosion coatings in the late 1980s [35, 36]. The noise consists of
fluctuations in the current or potential that occur during the course of corrosion. The
underlying idea is that these fluctuations in current or potential are not entirely
random. An unavoidable minimum noise associated with current flow will always
be random. However, if this minimum can be predicted for an electrochemical
reaction, then analysis of the remainder of the noise may yield information about
other processes, such as pitting corrosion, mass transport fluctuations, and the for-
mation of bubbles (i.e., hydrogen formed at the cathode).
The theoretical treatment of electrochemical noise is not complete. There does
not yet seem to be consensus on which signal analysis techniques are most useful.
It is fairly clear, however, that understanding of ENM requires a good working
knowledge of statistics; anyone setting out to master the technique must steel them-
selves to hear of kurtosis, skewness, and block averages rather frequently.
In the future, this technique may become a standard research tool for localized
corrosion processes that give strong electrochemical noise signals, such as microbial
corrosion and pitting corrosion.
8.3 CALCULATING AMOUNT OF ACCELERATION
AND CORRELATIONS
Accelerated tests are most commonly used in one of two ways:
1. To compare or rank a series of samples in order to screen out unsuitable
coatings or substrates (or conversely, in order to find the most applicable
ones)
2. To predict whether a coating/substrate combination will give satisfactory
performance in the field — and for how long
This requires that it be possible to calculate both the amount of acceleration the test
causes and how uniform this amount of acceleration is over a range of substrates
and coatings.
In order to be useful in comparing different coating systems or substrates, an
accelerated test must cause even acceleration of the corrosion process among all the
samples being tested. Different paint types have different corrosion-protection mech-
anisms; therefore, accentuating one or more stresses — such as heat or wet time —
can be expected to produce different amounts of acceleration of corrosion among a
group of coatings. The same holds true for substrates. As the stress or stresses are
further accentuated — higher temperatures, more wet time, more salt, more UV light
7278_C008.fm Page 147 Friday, February 3, 2006 3:01 PM
© 2006 by Taylor & Francis Group, LLC