Process Selection - From Design to Manufacture Episode 1 Part 2 ppsx
Bạn đang xem bản rút gọn của tài liệu. Xem và tải ngay bản đầy đủ của tài liệu tại đây (2.06 MB, 20 trang )
//SYS21///INTEGRAS/B&H/PRS/FINALS_07-05-03/0750654376-CH001.3D – 4 – [1–18/18] 8.5.2003 9:11PM
1.3 Competitive product introduction processes
Faced with the above issues, some companie s are currently making dramatic changes to the
way in which new products are brought to market. The traditional engineering function led
sequential product introduction process is being replaced by a faster and far more effective
team based simultaneous engineering ap proach (1.25). For example, the need for change has
been recognized in TRW (formerly Lucas Varity) and has led to the development of a Product
Introduction Management (PIM) process (1.26, 1.27) for use in all TRW operating businesses
with the declared targets of reducing:
.
Time to market by 30 per cent
.
Product cost by 20 per cent
.
Project cost by 30 per cent.
The generic process is characterized by five phases and nine reviews as indicated in Fig-
ure 1.3. Each review has a relevant set of commercial, technical and project criteria for sign off
and hand over to the next stage. (The TRW PIM process effectively replaces the more con-
ventional design methodology and provides a more business process orientated approach
to product development.)
The process defines what the enterprise has to deliv er. The phases, the review points,
and the technical and commercial deliverables are clearly defined, and the process aims to
take account of market, product design, and manufacturing and financial aspects during
each process stage. The skill requirements are defined, together with the necessary
supporting tools and techniques. The process runs across the functional structure and
includes customer and supplier representation. The PIM process is owned by a senior
manager and each product introduction project is also owned by a senior member of
staff.
Fig. 1.3 TheTRW PIM process.
4 A strategic view
//SYS21///INTEGRAS/B&H/PRS/FINALS_07-05-03/0750654376-CH001.3D – 5 – [1–18/18] 8.5.2003 9:11PM
In essence the product introduction process requires the collaborative use of:
.
Teamwork – Product development undertaken by a full time co-located team with repre-
sentation from Marketing, Product Develo pment Engineering, Manufacturing Systems
Engineering, Manufacturing, Suppliers and Customers formed at the requirements defini-
tion stage and selected for team-working and technical skills.
.
Simultaneous Engineering – The simultaneous design of product, its method of manufacture
and, the manufacturing system, against clear customer requirements at equal levels of
product and process definition.
.
Project Management – The professional management of every product introduction project
against clearly defined and agreed cost, quality and delivery targets specified to achieve
complete customer satisfaction and busines s profitability.
.
Tools and Techniques – The routine use of concurrent engineering tools to structure the
team’s activity, thereby improving the productivity of the team and quality of their output.
The linkage between the above elements is represented diagrammatically in Figure 1.4.
Design for Assembly (DFA) is one of the main tools and techniques prescribed by the PIM
process. Other main tools and techniques currently specified include: Quality Function
Deployment (QFD) (1.29), Failure Mode and Effects Analysis (FMEA) (1.30), Design of
Experiments (DOE) (1.31) and Conformability Analysis (CA) (1.32).
1.4 Techniques in design for manufacture and assembly
The application of tools and techniques that quantify manufacturing and assembly problems
and identify opportunities for redesign is the major means available for bridging the knowl-
edge gap. It has been found that DFM/DFA analysis leads to innovative design solutions
where considerable benefits accrue, including functional performance and large savings in
manufacturing and assembly cost. DFA is particularly powerful in this connection and is one
of the most valuable product introduction techniques. Although the use of design for manu-
facture and assembly techniques requires additional up-front effort when compared with the
more conventional design activity, overall the effect is to reduce the time-to-market quite
considerably. This is primarily due to fewer engineering changes, fewer parts to de tail,
Fig. 1.4 Key elements of successful PIM (after1.28).
Techniques in design for manufacture and assembly 5
//SYS21///INTEGRAS/B&H/PRS/FINALS_07-05-03/0750654376-CH001.3D – 6 – [1–18/18] 8.5.2003 9:11PM
document and plan, and a less complex product with good assembly and manufacturing
characteristics. An illustration of the business benefits of reducing time-to-mar ket is given in
Figure 1.5 (1.33).
Very substantial reductions in part-count and component manufacture and assem bly costs
have resulted from using DFA techniques in product development teams. Figures 1.6 and 1.7
give examples of what can be achieved in terms of product rationalization. The contractor
assembly DFA study shown in Figure 1.6 resulted in a 66% reduction in part-count. Figure
1.7 shows the overall results of a study on an assembly test machine and a redesign of part of
the system, a pump stand, where 14 parts were replaced by a single casting.
The results of 60 documented applications, carried out recently in a wide variety of
industries, show that the average part-count reduction was almost 48 per cent and the assembly
cost saving was 45 per cent (see Figure 1.8). It is interesting to note that there proved to be little
difference, in terms of means and standard deviations, across the aerospace/defence, auto-
motive and industrial equipment business sectors. This indicates that the applicability of the
methods is not particularly sensitive to product demand levels or technology. Indeed the
largest single benefit achieved resulted from the redesign of a range of assembly and test
machines.
Fig. 1.5 Benefits of reducing time-to-market (after 1.33).
Fig. 1.6 Contactor assembly.
6 A strategic view
//SYS21///INTEGRAS/B&H/PRS/FINALS_07-05-03/0750654376-CH001.3D – 7 – [1–18/18] 8.5.2003 9:11PM
Similar savings have been reported by others involved with the application of techniques in
design for manufacture and assembly (1.34). It is also worth commenting that the designs
coming out of the process tend to be more reliable and easier to manufacture.
As can be seen from the above results, DFA techniques (1.35–1.38) when used in industry
are highly effective in realizing part-count reduction and taking costs out of manufacture and
assembly. The analysis metrics associated with part-count and potential costs are inputs to
concept design and development. As part of the DFA process, the product development team
needs to generate improved product design solutions, with better DFA metrics, by simplifying
the product structure, reducing part-count and simplifying compon ent assembly operations.
DFA is particularly interesting in the context of this book, since its main benefits result from
systematically reviewing functional requirements, and replacing component clusters by single
integrated pieces and selecting alternative joining processes (1.34)(1.38). Invariably the pro-
posed design solutions rely heavily on the viability of adopting different processes and/or
materials as shown in two part-count reduction examples in Figure 1.9. A number of guide-
lines for assembly-orientated design are provided in Appendix A for the reader.
DFM further involves the simultaneous consideration of design goals and manufacturing
constraints in order to identify and alleviate manufacturing problems while the product is
being designed, thereby reducing the lead time and improving product quality. This includes
an understanding of the technical capabilities and limitations of the manufacturing processes
chosen by invoking a series of guidelines, principles and recommendations, commonly termed
‘producibility’ guidelines, to modify component designs for subsequent manufacture. The use
Fig. 1.7 Pump assembly and test machine overall assembly results.
Fig. 1.8 Results from 60 product studies.
Techniques in design for manufacture and assembly 7
//SYS21///INTEGRAS/B&H/PRS/FINALS_07-05-03/0750654376-CH001.3D – 8 – [1–18/18] 8.5.2003 9:11PM
of techniques to assist costing of component designs also aids the process of cost optimization.
Since few formal DFM methods exist, unlike DFA, implementing a strategy is not straight-
forward, and companies tend to develop DFM guidelines in-house. This takes the focus away
from quality to a large extent because of the difficulties in establishing the methods to verify it
in the first place.
Fig. 1.9 Examples of part-count reduction (after 1.3 4,1.38).
8 A strategic view
//SYS21///INTEGRAS/B&H/PRS/FINALS_07-05-03/0750654376-CH001.3D – 9 – [1–18/18] 8.5.2003 9:11PM
A number of general rules have been developed to aid designers when thinking about the
manufacture of the product:
.
Holes in machined, cast, molded, or stamped parts should be spaced such that they can be
made in one operation without tooling weakness. This means that there is a limit on how
close holes may be spaced due to strength in the thin section between holes.
.
Generalized statements on drawings should be avoided, like ‘polish this surface’ or ‘tool-
marks not permitted’, which are difficult for manufacturing personnel to interpret. Notes on
engineering drawings must be specific and unambiguous.
.
Dimensions should be made from specific surfaces or points on the part, not from points in
space. This greatly facilitates the making of gauges and fixtures.
.
Dimensions should all be from a single datum line rather than from a variety of points to
avoid overlap of tolerances.
.
The design should aim for minimum weight consistent with strength and stiffness require-
ments. While material costs are minimized by this criterion, there also will usually be a
reduction in labor and tooling costs.
.
Wherever possible, design to use general-purpose tooling rather than special dies, form cutters,
etc. An exception is high-volume production, w here special tooling may be more cost-effective.
.
Generous fillets and radii on castings, molded, formed, and machined parts should be used.
.
Parts should be designed so that as many operations as possible can be performed without
requiring repositioning. This promotes accuracy and minimizes handling.
Figure 1.10 provides a number o f specific design rules and objectives a ssociated with effective DFM.
As mentioned previously, selecting the right manufacturing process is not always simple and
obvious. In most cases, there are several processes that can be used for a component, and
selection depends on a large number of factors. Some of the main process selection drivers are
shown in Figure 1.11. The intention is not to infer that these are necessarily of equal
importance or occur in this fixed sequence.
The problem is compounded by the range of manufacturing processes and wide variety of
material types commonly in use. Figures 1.12–1.16 provide a general classification and guide
to the range of materials and processes (component manufacturing, assembly, joining and,
bulk and surface engineering, respectively) that are widely available. (All, except the latter, of
Fig. 1.10 DFM rules and objectives.
Techniques in design for manufacture and assembly 9
//SYS21///INTEGRAS/B&H/PRS/FINALS_07-05-03/0750654376-CH001.3D – 10 – [1–18/18] 8.5.2003 9:11PM
these processes are discussed in detail in Part II of the book.) To be competitive, the
identification of technologically and economically feasible process and material combinations
is crucial. The benefits of picking the right process can be enormous, as shown in Figure 1.17
for a number of components and processing routes.
The placing in the product design cycle of process selection in the context of engineering for
manufacture and assembly is illustrated in Figu re 1.18. The selection of an appropriate set of
processes for a product is very difficult to perform effectively without a sound Product Design
Specification (PDS). A well-constructed PDS lists all the needs of the customers, end users and
the business to be satisfied. It should be written and used by the Product Team and provide a
reference point for any emerging design or prototype. Any co nflict between customer needs
and product functionality should be referred back to the PDS.
The first step in the process is to analyze the design or prototype with the aim of simplifying
the product structure and optimizing part-cou nt. As shown earlier, without proper analysis
design solutions invariably tend to have too many parts. Therefore, it is important to identify
components that are candidates for elimination or integration with mating parts. (Ev ery
component part must be there for a reason and the reason must be in the PDS.) This must
be done with due regard for the feasibility of material process combinations and joining
technology. A number of useful approaches are available for material selection in engineering
design. For more information see references (1.10), (1.39) and (1.40).
The next steps give consideration to the problems of component handling and fitting
processes, the selection of appropriate manufacturing processes and ensurin g that components
are tuned to the manufacturing technology selected. Estimation of component manufacture
and assembly costs during the design process is important for both assessing a design against
target costs and in trade-off analysis. Overall, the left-hand side of Figure 1.18 is closely
related to DFA, while the right-hand side is essentially material/process selection and com-
ponent design for processing, or consideration in DFM. A reader interested in more back-
ground informat ion on DFA/DFM and materials and process selection in product
development is directed to references (1.40–1.45).
Fig. 1.11 Key process selection drivers.
10 A strategic view
//SYS21///INTEGRAS/B&H/PRS/FINALS_07-05-03/0750654376-CH001.3D – 11 – [1–18/18] 8.5.2003 9:11PM
Fig. 1.12 General classification of materials.
Techniques in design for manufacture and assembly 11
//SYS21///INTEGRAS/B&H/PRS/FINALS_07-05-03/0750654376-CH001.3D – 12 – [1–18/18] 8.5.2003 9:12PM
Fig. 1.13 General classification of manufacturing processes.
12 A strategic view
//SYS21///INTEGRAS/B&H/PRS/FINALS_07-05-03/0750654376-CH001.3D – 13 – [1–18/18] 8.5.2003 9:12PM
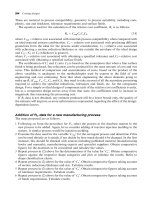
1.5 Process selection strategy
In considering alternative design solutions for cost and quality, it is necessary to explore
candidate materials, geometries and tolerances, etc., against possible manufacturing routes.
This requires some means of selecting appropriate processes and estimating the costs of
manufacture early on in product development, across a whole range of options. In addition,
the costs of non-conformance (1.46) need to be understood, that is appraisal (inspection and
testing) and failure, both internal (rework, scrap, design changes) and external (warranty
claims, liability claims and product recall). Therefore, we also need a way of exploring
conformance levels before a process is selected. For more information on this important
aspect of design, the reader is directed to Reference 1.32.
The primary objective of the text is to provide support for manufacturing process selection
in terms of technological feasibility, quality of conformance and manufacturing cost. The
satisfaction of this objective is through:
.
The provision of data on the characteristics and capabilities of a range of important
manufacturing, joining and assembly processes. The intention is to promote the generation
of design ideas and facilitate the matching and tuning of a design to a process, and
.
The provision of methods and data to enable the exploration of design solutions for
component manufacturing and assembly costs in the early stages of the design and devel-
opment process.
To provide for the first point, a set of so-called manufacturing PRocess Information MAps
(PRIMAs) have been developed. In a standard format for each process, the PRIMAs present
knowledge and data on areas including material suitability, design considerations, quality
issues, economics and process fundamentals and process variants. The information includes
Fig. 1.14 General classification of assembly systems.
Process selection strategy 13
//SYS21///INTEGRAS/B&H/PRS/FINALS_07-05-03/0750654376-CH001.3D – 14 – [1–18/18] 8.5.2003 9:12PM
Fig. 1.15 General classification of joining processes.
14 A strategic view
//SYS21///INTEGRAS/B&H/PRS/FINALS_07-05-03/0750654376-CH001.3D – 15 – [1–18/18] 8.5.2003 9:12PM
Fig. 1.16 General classification of bulk and surface engineering processes.
Process selection strategy 15
//SYS21///INTEGRAS/B&H/PRS/FINALS_07-05-03/0750654376-CH001.3D – 16 – [1–18/18] 8.5.2003 9:12PM
not only design considerations relevant to the respective processes, but quite purposefully, an
overview of the functional characteristics of each process, so that a greater overall under-
standing may be achieved. Within the standard format, a similar level of detail is provided on
each of the processes included. The format is very de liberate. Firstly, an outline of the process
itself – how it works and under what conditio ns it functions best. Secondly, a summary of
what it can do – limitations and opportunities it presents – and finally an overview of quality
considerations including process capability charts for relating tolerances to characteristic
dimensions.
To provide for the second point, techniques are put forward that can be used to estimate the
costs of component manufacture and assembly for concept designs. It enables the effects of
product structure, design geometry and materials to be explored against various manufactur-
ing and assembly routes. A sample da ta set is included, which enables the techniques to be
used to predict component manufacturing and assembly costs for a range of processes and
materials. The process of cost estimation is illustrated through a number of case studies, and
the scope for and importance of application with company specific data is discussed.
Fig. 1.17 Contrast in component cost for different processing routes.
16 A strategic view
//SYS21///INTEGRAS/B&H/PRS/FINALS_07-05-03/0750654376-CH001.3D – 17 – [1–18/18] 8.5.2003 9:12PM
Part II begins with the strategies employed for PRIMA selection, where attention is focused
on identification of candidate processes based on strategic criteria such as material, process
technology and production quantity. Having identified the possible targets, the data in the
PRIMAs are used to do the main work of selection. The PRIMAs include the main five
manufacturing process groups: casting, plastic and composite processing methods , forming,
machining and non-traditional processes. In addition, the main assembly technologies and the
majority of commercially available joining processes are covered. In all, sixty-five PRIMAs
are presented, giving reference to over one hundred manufacturing, assembly and joining
processes.
Fig. 1.18 Outline process for design for manufacture and assembly.
Process selection strategy 17
//SYS21///INTEGRAS/B&H/PRS/FINALS_07-05-03/0750654376-CH001.3D – 18 – [1–18/18] 8.5.2003 9:12PM
Part III of the text concentrates on the cost estimation methodologies for components and
assemblies, their background, theoretical development and industrial application. In practice,
Part II of the work can be used to help select the candidate processes for a design from the
whole range of possibilities. Part III is concerned with getting a feel for the manufacturing and
assembly costs of the alternatives. The book finishes with a statement of conclusions and a list
of areas where future work might be usefully directed.
18 A strategic view
//SYS21///INTEGRAS/B&H/PRS/FINALS_07-05-03/0750654376-CH002.3D – 19 – [19–34/16] 13.5.2003 7:43PM
Part II
Selecting candidate
processes
Strategies and data relevant to selecting candidate processes for design solutions.
2.1 Introduction
Selecting the right process and optimizing the design to suit the process selected involves a
series of decisions which exert considerable influence on the quality and cost of components
and assemblies. Such decisions can significantly effect the success of a product in the market
place. As mentioned previously, in selec ting processes and tuning designs for processing many
factors need to be taken into consideration. The manufacturing PRIMAs presented in this
part of the book attempt to provide the knowledge and data required to underpin this decision
making process provided by the various process selection strategies. However, it is the
PRIMAs that provide the means of making more detailed assessments regarding the techno-
logical and economic feasibility of a process.
Design considerations are provided to enable the designer to understand more about the
technical feasibility of the design decisions made. The process quality considerations give
valuable information on process conformance, including data on process tolerance capability
associated with characteristic dimensions. A good proportion of the PRIMAs is taken up with
quality considerations. No excuse is made for this. Non-conformance often represents a large
quality cost in a business. As touched on earlier, such losses result from rework, order
exchange, warranty claims, legal actions and recall. In many businesses, these losses account
for more than 10 per cent of turnover (2.1). The goal is to provide data which enables the
selection of processes that have the capability to satisfy the engineering needs of the applica-
tion, including those associated with conformance to quality requirements.
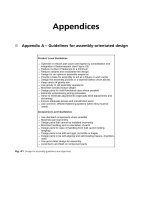
2.2 PRIMAs (Process Information Maps)
Each PRIMA is divided into seven categories, as listed and defined below, covering the
characteristics and capabilities of the process:
.
Process description: an explanation of the fundamentals of the process together with a
diagrammatic representation of its operation and a finished part.
.
Materials: a description of the materials currently suitable for the given process.
//SYS21///INTEGRAS/B&H/PRS/FINALS_07-05-03/0750654376-CH002.3D – 20 – [19–34/16] 13.5.2003 7:43PM
.
Process variations: a description of any variations of the basic process and any special points
related to those variations.
.
Economic considerations: a list of several important points including production rate, mini-
mum production quantity, tooling costs, labor costs, lead times, and any other points which
may be of specific relevance to the process.
.
Typical applications: a list of components or assem blies that have been successfully manu-
factured or fabricated using the process.
.
Design aspects: any points, opportunities or limitations that are relevant to the design of
the part a s well as standard information on minimum secti on, size range and general
configuration.
.
Quality issues: standard information includes a process capability chart (where relevant),
typical surface roughness and detail, as well as any information on common process
faults.
A key feature of the PRIMAs is the inclusion of process capability charts for the
majority of the manufacturing processes. Tolerances tend to be dependent on the overall
dimension of the component characteristic, and the relationship is specific and largely non-
linear. The charts have been developed to provide a simple means of understanding the
influence of dimension on tolerance capability. The regions of the charts are divided by two
contours. The region bounded by these two contours represents a spectr um of tolerance-
dimension combinations where C
pk
! 1.33* is achievable. Below this region, tolerance-
dimension combinations are likely to require special control or secondary processing if
C
pk
¼ 1.33 is to be realized.
In the preparation of the process capability charts it has been assumed that the geometry is
well suited to the process and that all operational requirements are satisfied. Where the
material under consideration is not mentioned on the charts, care should be taken. Any
adverse effects due to this or geometrically driven component variation should be taken into
consideration. For more information the reader is referred to reference (1.32). The data used
in the charts has been compiled from contacts in industry and from published work. Although
attempts have been made to standardize the data as far as possible, difficulties were faced in
this connection, since it was not always easy to obtain a consensus view. Consequently, as
many as twenty different data sources have been used in the compilation of the individual
process capability charts to provide an understanding of the general tolerance capability range
offered by each manufacturing process.
2.3 PRIMA selection strategies
Different manufacturing technologies such as primary shape generat ing processes, joining
techniques, assembly systems and surface engineering processes require that selection takes
place based on the factors relevant to that particular technology. For example, the selection
of a joining technique may be heavily reliant on the ability of the process to join dissimilar
* C
pk
– process capability index. If the process characteristic is a normal distribution, C
pk
can be related to a
parts-per-million (ppm) defect rate. C
pk
¼ 1.33 equates to a defect rate of 30 ppm at the nearest limit. At C
pk
¼ 1,
the defect rate equates to approximately 1350 ppm (see reference 2.2 for more information about process capability
indices).
20 Selecting candidate processes
//SYS21///INTEGRAS/B&H/PRS/FINALS_07-05-03/0750654376-CH002.3D – 21 – [19–34/16] 13.5.2003 7:43PM
materials and materials of different thickness. This is a particular requirement not neces-
sarily defined by the PDS, but one that has been arrived at through previous design
decisions, perhaps based on spatial or functional requirements. Whereas assembly
system selection may simply be dictated by a low labor rate in the country of manufacture
and therefore manual assembly becomes viable for even relatively large production
volumes.
Although there may be many important selection drivers with respect to each process
technology, a simple and effective strategy for selection must be sought for the general
situation and for usability. Selection strategies can be developed by concentrating on several
key economic and technical factors which are easily interpreted from the PDS or other
requirements. Put in a wider context, the selection strategies, together with the information
provided in the PRIMAs, must complement business strategy and the costing of designs, in
order to provide a procedure that fully justifies the final selection. A flowchart is shown
in Figure 2.1, relating all the factors relevant to the process selection strategies discussed
in detail.
2.3.1 Manufacturing process selection
Manufacturing processes represent the main shape generating methods such as casting,
molding, forming and material removal processes. The individual processes specific to this
section are classified in Figure 1.13. The purpose of this section is to provide a guide for the
selection of the manufacturing processes that may be suitable candidates for a component.
The manufacturing process selection strategy is given below, but points 4, 5 and 6 apply to
all selection strategies:
1 Obtain an estimate of the annual production quantity.
2 Choose a material type to satisfy the PDS.
3 Refer to Figu re 2.2 to select can didate PRIMAs.
4 Consider each PRIMA against the engineering and economic requirements such as:
.
Understand the process and its variations
.
Consider the material compatibility
.
Assess conformance of component concept with design rules
.
Compare tolerance and surface finish requirements with process capability data.
5 Consider the economic positioning of the process and obtain component cost estimates for
alternatives.
6 Review the selected manufacturing process against business requirements.
The principal intention is that the candidate processes are selected before the component
design is finalized, so that any specific constraints and/or opportunities may be borne in mind.
To this end, the manufacturing process PRIMA selection matrix (see Figure 2.2) has been
devised based on two basic variables:
.
Material type – Accounts for the compatibility of the parent material with the manufactur-
ing process, and is therefore a key technical selection factor. A large proportion of the
materials used in engineering manufacture have been included in the selection methodology,
from ferrous alloys to precious metals, as classified in Figure 1.12.
PRIMA selection strategies 21
//SYS21///INTEGRAS/B&H/PRS/FINALS_07-05-03/0750654376-CH002.3D – 22 – [19–34/16] 13.5.2003 7:43PM
Fig. 2.1 General process selection flowchart.
22 Selecting candidate processes
//SYS21///INTEGRAS/B&H/PRS/FINALS_07-05-03/0750654376-CH002.3D – 23 – [19–34/16] 13.5.2003 7:43PM
Fig. 2.2 Manufacturing process PRIMA selection matrix.
PRIMA selection strategies 23