Advanced Vehicle Technology Episode 3 Part 12 doc
Bạn đang xem bản rút gọn của tài liệu. Xem và tải ngay bản đầy đủ của tài liệu tại đây (264.13 KB, 20 trang )
and therefore there is virtually no variation in the
afterbody drag (see Fig. 14.41). With a parallel
sided squareback rear end configuration, the
whole rear surface area (base area) becomes an
almost constant low negative pressure wake region.
Tapering the rear quarter side and roof of the body
and rounding the rear end tends to lower the base
pressure. In addition to the base drag, the after-
body drag will also include the negative drag due to
the surrounding inclined surfaces.
14.6.2 Fastback drag (Figs 14.41 and 14.43)
When the rear slope angle is reduced to 25
or less
the body profile style is known as a fastback, see
Fig. 14.43. Within this much reduced rear end inclin-
ation the airstream flows over the roof and rear
downward sloping surface, the airstream remain-
ing attached to the body from the rear of the roof
to the rear vertical light-plate and at the same time
the condition which helps to generate attached and
trailing vortices with the large sloping rear end is
no longer there. Consequently the only rearward
suction comes from the vertical rear end projected
base area wake, thus as the rear end inclined angle
diminishes, the drag coefficient decreases, see Fig.
14.41. However, as the angle approaches zero there
is a slight rise in the drag coefficient again as the
rear body profile virtually reverts to a squareback
style car.
14.6.3 Hatchback drag (Figs 14.41, 14.44 and
14.45)
Cars with a rear sloping surface angle ranging from
50
to 25
are normally referred to as hatchback
(a)
High speed
low pressure
Reduced speed
increase in pressure
20°
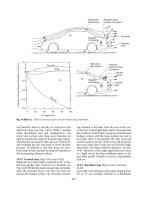
Lip spoile
r
Turbulent
wake
Negative
lift tendency
h
Front lift
Drag
(c)
Change in lift and drag coefficients ( and )
CC
LD
–0.4
–0.3
–0.2
–0.1
0
0.1
0 20 40 60 80 100
Lip height (mm)
Rear lift
High speed
low pressure
Negative
lift tendency
Reduced
speed increase
in pressure
Aerofoil
spoiler
Turbulent
wake
(b)
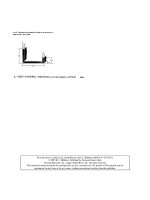
Fig. 14.39 (a±c) Effect of rear end spoiler on both lift and drag coefficients
612
style, see Fig. 14.44. Within this rear end inclin-
ation range air flows over the rear edge of the roof
and commences to follow the contour of the rear
inclined surface; however, due to the steepness of
the slope the air flow breaks away from the surface.
At the same time some of the air flows from the
higher pressure underfloor region to the lower pres-
sure roof and rear sloping surface, then moves
slightly inboard and rearward along the upper
downward sloping surface. The intensity and direc-
tion of this air movement along both sides of the
rear upper body edging causes the air to spiral into
a pair of trailing vortices which are then pushed
downward by the downwash of the airstream
flowing over the rear edge of the roof, see
Fig. 14.45. Subsequently these vortices re-attach
themselves on each side of the body, and due to
the air's momentum these vortices extend and trail
well beyond the rear of the car. Hence not only
does the rear negative wake base area include the
vertical area and part of the rearward projected
slope area where the airstream separates from the
body profile, but it also includes the trailing conical
vortices which also apply a strong suction pull
against the forward motion of the car. As can be
seen in Fig. 14.41 there is a critical slope angle
range (20 to 35
) in which the drag coefficient
rises steeply and should be avoided.
Direction
of
motion
Slower airstream
higher pressure
Airstream
Aerofoil
Faster airstream
lower pressure
Direction
of
air flow
Higher
pressure
Lower
pressure
Down-
thrust
(negative
lift)
Drag
Resultant
reaction
(
a) Air streamlining for an inclined
negative lift aerofoil wing
(b) Lift and drag components on
an inclined negative lift wing
Front negative
lift wing
Negative
lift
(down-
thrust)
L
f
Drag
Resultant
wheel load
(W)
Wheel base (L)
note
W =
Fh
L
D
Negative
lift
(downthrust)
L
r
h
Drag(F )
D
Rear negative
lift wing
(c) Racing car incorporating negative lift wings
Fig. 14.40 (a±c) Negative lift aerofoil wing considerations
613
Slope an
g
le
(
de
g)
0306090
Fast-
back
Hatch-
back
Square
back
Drag coefficient ( )
C
D
+
Critical angle
0
–
Fig. 14.41 Effect of rear panel slope angle on the afterbody drag
Flow
attachment and
separation
Flow
reattachment
Rear screen
panel
Flow
separation
90 –50°°
Base
area
wake
Negative
pressure
Fig. 14.42 Squareback configuration
Rear screen
panel
Flow separation
22°–10°
Bas
e
area
wak
e
Negative
pressure
Fig. 14.43 Fastback configuration
614
14.6.4 Notchback drag (Figs 14.46, 14.47(a and b)
and 14.48(a and b))
A notchback car style has a stepped rear end body
profile in which the passenger compartment rear
window is inclined downward to meet the horizontal
rearward extending boot (trunk) lid (see Fig. 14.46).
With this design, the air flows over the rear roof
edge and follows the contour of the downward
sloping rear screen for a short distance before
separating from it; however, the downwash of the
airstream causes it to re-attach itself to the body
near the rear end extended boot lid. Thus the base-
wake area will virtually be the vertical rear boot
and light panel; however, standing vortices will be
generated on each side of the body just inboard on
the top surface of the rear window screen and boot
lid, and will then be projected in the form of trailing
conical vortices well beyond the rear end of the
boot, see Fig. 14.19(b). Vortices will also be created
along transverse rear screen to boot lid junction
and across the rear of the panel light.
Experiments have shown (see Fig. 14.47(a)) that
the angle made between the horizontal and the
inclined line touching both the rear edges of the
roof and the boot is an important factor in deter-
mining the afterbody drag. Fig. 14.47(b) illustrates
the effect of the roof to boot line inclination;
when this angle is increased from the horizontal
the drag coefficient commences to rise until reach-
ing a peak at an inclination of roughly 25
, after
which the drag coefficient begins to decrease. From
this it can be seen that raising the boot height or
extending the boot length decreases the effective
inclination angle È
e
and therefore tends to reduce
the drag coefficient. Conversely a very large effective
inclination angle È
e
will also cause a reduction in the
Flow
attachment
and separation
Flow
reattachment
Rear screen
panel
Flow
separation
50 –22°°
Base
area
wake
Negative
pressure
Fig. 14.44 Hatchback configuration
Side
vortex
Low
pressure
Transverse
standing
vortices
Trailing
vortex
cone
Airstream
Fig. 14.45 Hatchback transverse and trailing vortices
615
drag coefficient but at the expense of reducing the
volume capacity of the boot. The drag coefficient
relative to the rear boot profile can be clearly illus-
trated in a slightly different way, see Fig. 14.48(a).
Here windtunnel tests show how the drag coeffi-
cient can be varied by altering the rear end profile
from a downward sloping boot to a horizontal
boot and then to a squareback estate shape. It
will be observed (see Fig 14.48(b)) that there is a
critical increase in boot height in this case from 50
to 150 mm when the drag coefficient rapidly
decreases from 0.42 to 0.37.
14.6.5 Cabriolet cars (Fig. 14.49)
A cabriolet is a French noun and originally referred
to a light two wheeled carriage drawn by one
horse. Cabriolet these days describes a car with
a folding roof such as a sports (two or four seater)
or roadster (two seater) car. These cars may be
driven with the folding roof enclosing the cockpit
or with the soft roof lowered and the side screen
windows up or down. Streamlining is such that the
air flow follows closely to the contour of the nose
and bonnet (hood), then moves up the windscreen
before overshooting the screen's upper horizontal
edge (see Fig. 14.49). If the rake angle of the wind-
screen is small (such as with a high mounted off
road four wheel drive vehicle) the airstream will be
deflected upward and rearward, but with a large
rake angle windscreen the airstream will not rise
much above the windscreen upper leading edge
as the air flows over the open driver/passenger
Flow
attachment and
separation
Flow
reattachment
Flow
separation
Flow
attachment separationand
Base
area
wake
Negative
pressure
Fig. 14.46 Notchback configuration
Various
boot
heights
φ
e
Change in drag coefficient ( )∆
C
D
0.8
0.4
0.0
– 0.4
01020304050
(b)
Φ
e
= rear effective slope angle
Critical angle
(25°)
Effective slope angle ( ) degΦ
e
(a)
Fig. 14.47 (a and b) Influence of the effective slope angle on the drag coefficient
616
compartment towards the rear of the car. A separ-
ation bubble forms between the airstream and
the exposed and open seating compartment, the
downstream air flow then re-attaches itself to the
upper face of the boot (trunk). However, this bub-
ble is unstable and tends to expand and burst in a
cyclic fashion by the repetition of separation and
re-attachment of the airstream on top of the boot
(trunk), see Fig. 14.49. Thus the turbulent energy
causes the bubble to expand and collapse and the
fluctuating wake area (see Fig. 14.49), changing
between h
1
and h
2
produces a relatively large drag
resistance. With the side windscreens open air is
drawn into the low pressure bubble region and in
the process strong vortices are generated at the side
entry to the seating compartment; this also there-
fore contributes to the car drag resistance. Typical
drag coefficients for an open cabriolet car are given
as follows: folding roof raised and side screens up
C
D
0.35, folding roof down and side screens up C
D
0.38, and folding roof and side screens down C
D
0.41. Reductions in the drag coefficient can be
made by attaching a header rail deflector, stream-
lining the roll over bar and by neatly storing or
covering the folding roof, the most effective device
to reduce drag being the header rail deflector.
14.7 Commercial vehicle aerodynamic
fundamentals
14.7.1 The effects of rounding sharp front cab
body edges (Fig. 14.50(a±d))
A reduction in the drag coefficient of large vehicles
such as buses, coaches and trucks can be made by
rounding the front leading edges of the vehicle.
(a)
Squareback
estate
Notchback
horizontal
boot
Fastback
downward
sloping boot
Drag coefficient ( )
C
D
h
3
2
1
50 100 150 200 250 500 55
0
0.42
0.40
0.38
0.36
1
2
3
(b)
Boot (trunk) height (h) mm
Fig. 14.48 (a and b) Effect of elevating the boot (trunk) height on the drag coefficient
Flow
attachment
Side
flow
Header rail
deflector
Side
screen
Separation
bubble
Roll over
bar
Flow
separation
Fluctuating
venting
bubble
h
1
h
2
Fig. 14.49 Open cabriolet
617
Flow
separation
C
D
= 0.88
(a) Coach with sharp leading edges
Flow almost remains attached
C
D
= 0.36
(b) Coach with rounded leading edges
Flow remains attached
C
D
= 0.34
(c) Coach with rounded edges and backsloping front
Change in drag coefficient ( )∆
C
D
1.0
0.8
0.6
0.4
0.2
0
0 100 200 300
Leading edge radius (R) mm
R
(d) Effect of rounding vehicle leading edges
upon the aerodynamic drag
Over
flow
Side flow
Fig. 14.50 (a±d) Forebody coach streamlining
618
Simulated investigations have shown a marked
decrease in the drag coefficient from having sharp
forebody edges (see Fig. 14.50(a)) to relatively large
round leading edge radii, see Fig. 14.50(b). It can
be seen from Fig. 14.50(d) that the drag coefficient
progressively decreased as the round edge radius
was increased to about 120 mm, but there was only
a very small reduction in the drag coefficient with
further increase in radii. Thus there is an optimum
radius for the leading front edges, beyond this there
is no advantage in increasing the rounding radius.
The reduction in the drag coefficient due to round-
ing the edges is caused mainly by the change from
flow separation to attached streamline flow for
both cab roof and side panels, see Fig. 14.50(a
and b). However, sloping back the front profile of
the coach to provide further streamlining only
made a marginal reduction in the drag coefficient,
see Fig. 14.50(c).
14.7.2 The effects of different cab to trailer body
heights with both sharp and rounded upper
windscreen leading edges (Fig. 14.51(a±c))
A generalized understanding of the air flow over
the upper surface of an articulated cab and trailer
can be obtained by studying Fig. 14.51(a and b).
Three different trailer heights are shown relative to
one cab height for both a sharp upper windscreen
leading edge (Fig. 14.51(a)) and for a rounded
upper windscreen edge (Fig. 14.51(b)). It can be
seen in the case of the sharp upper windscreen
leading edge cab examples (Fig. 14.51(a)) that
with the low trailer body the air flow cannot follow
the contour of the cab and therefore overshoots
both the cab roof and the front region of the trailer
body roof thereby producing a relatively high coeffi-
cient of drag, see Fig. 14.51(c). With the medium
height trailer body the air flow still overshoots
(separates) the cab but tends to align and attach
itself early to the trailer body roof thereby produ-
cing a relatively low coefficient of drag, see Fig.
14.51(c). However, with the high body the air flow
again overshoots the cab roof; some of the air then
hits the front of the trailer body, but the vast
majority deflects off the trailer body leading edge
before re-attaching itself further along the trailer
body roof. Consequently the disrupted air flow
produces a rise in the drag coefficient, see Fig.
14.51(c).
In the case of the rounded upper windscreen
leading edge cab (see Fig. 14.51(b)), with a low
trailer body the air flowing over the front wind-
screen remains attached to the cab roof, a small
proportion will hit the front end of the trailer body
then flow between the cab and trailer body, but the
majority flows over the trailer roof leading edge
and attaches itself only a short distance from the
front edge of the trailer roof thereby producing a
relatively low drag coefficient, see Fig. 14.51(c).
With the medium height trailer body the air flow
remains attached to the cab roof; some air flow
again impinges on the front of the trailer body
and is deflected between the cab and trailer body,
but most of the air flow hits the trailer body leading
edge and is deflected slightly upwards and only re-
attaches itself to the upper surface some distance
along the trailer roof. This combination therefore
produces a moderate rise in the drag coefficient, see
Fig. 14.51(c). In the extreme case of having a very
high trailer body the air flow over the cab still
remains attached and air still flows downwards
into the gap made between the cab and trailer;
however, more air impinges onto the vertical front
face of the trailer body and the deflection of the air
flow over the leading edge of the trailer body is
even steeper than in the case of the medium height
trailer body. Thus re-attachment of the air flow
over the roof of the trailer body takes place much
further along its length so that a much larger roof
area is exposed to air turbulence; consequently there
is a relatively high drag coefficient, see Fig. 14.51(c).
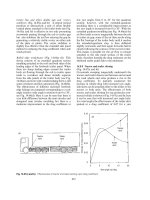
14.7.3 Forebody pressure distribution
(Fig. 14.52(a and b))
With both the conventional cab behind the engine
and the cab over or in front of the engine tractor
unit arrangements there will be a cab to trailer gap
to enable the trailer to be articulated when the
vehicle is being manoeuvred. The cab roof to trailer
body step, if large, will compel some of the air flow
to impinge on the exposed front face of the trailer
thereby producing a high pressure stagnation
region while the majority of air flow will be
deflected upwards. As it brushes against the upper
leading edge of the trailer the air flow then separ-
ates from the forward region of the trailer roof
before re-attaching itself further along the flat
roof surface, see Fig. 14.52(a). As can be seen the
pressure distribution shows a positive pressure
(above atmospheric pressure) region air spread
over the exposed front face of the trailer body
with its maximum intensity (stagnant region) just
above the level of the roof; this contrasts the nega-
tive pressure (below atmospheric pressure) gener-
ated air flow in the forward region of the trailer
roof caused by the air flow separation turbulence.
Note the negative pressure drops off towards the
rear of the roof due to air flow re-attachment.
619
Highest
C
D
Low
body
height
h
Medium
body
height
Lowest
D
C
Medium
D
C
High
body
height
(a) Tractor cab with sharp windscreen/roof leading edge (flow separation over cab roof)
Lowest
D
C
Medium
D
C
Highest
D
C
Low
body
height
Medium
body
height
High
body
height
(b) Tractor cab with rounded windscreen/roof leading edge (attached air flow over cab roof)
0.8
0.7
0.6
0.5
0.4
Drag coefficient ( )
C
D
3.0 3.2 3.4 3.6 3.8 4.0
4.2
Body height (h) m
Low
body
Medium
body
High
body
(b)
(a)
Attached
air flow
over roof
Air flow
separation
over roof
(c) Influence of cab to body height and cab shape
upon the drag coefficient
Fig. 14.51 (a±c) Comparison of air flow conditions with both sharp and rounded roof leading edge cab with various trailer
body heights
620
Trailer roof
pressure distribution
Trailer front
panel pressure
distribution
+ve
–ve
Airstream
(a) Cab without roof deflector
Roof
deflector
Airstream
(b) Cab with roof deflector
–ve
–ve
Fig. 14.52 (a and b) Trailer flow body pressure distribution with and without cab roof deflector
621
By fitting a cab roof deflector the pattern of air
flow is diverted upwards and over the roof of the
trailer body, there being only a slight degree of flow
separation at the front end of the trailer body roof,
see Fig. 14.52(b). Consequently the air flow moves
directly between the cab roof deflector and the roof
of the trailer body; it thus causes the air pressure in
the cab to trailer gap to decrease, this negative pres-
sure being more pronounced on the exposed upper
vertical face of the trailer, hence the front face upper
region of the trailer will actually reduce that portion
of drag produced by the exposed frontal area of the
trailer. Conversely the negative pressure created by
the air flow over the leading edge of the roof falls
rapidly, indicating early air flow re-attachment.
14.7.4 The effects of a cab to trailer body roof
height step (Fig. 14.53(a and b))
Possibly the most important factor which contri-
butes to a vehicle's drag resistance is the exposed
area of the trailer body above the cab roof relative
to the cab's frontal area (Fig. 14.53(a)). Investigation
into the forebody drag of a truck in a windtunnel
has been made where the trailer height is varied
relative to a fixed cab height. The drag coefficient
for different trailer body to cab height ratios (t/c)
were then plotted as shown in Fig. 14.53(b). For
this particular cab to trailer combination dimen-
sions there was no noticeable change in the drag
coefficient C of 0.63 with an increase in trailer body
to cab height ratio until about 1.2, after which the
drag coefficient commenced to rise in proportion to
the increase in the trailer body to cab height ratio up
to a t/c ratio of 1.5, which is equivalent to the max-
imum body height of 4.2 m; this corresponded to a
maximum drag coefficient of 0.86. Hence increasing
the trailer body step height ratio from 1.2 to 1.5
increases the step height from 0.56 m to 1.4 m and
in turn raises the drag coefficient from 0.63 to 0.86.
The rise in drag coefficient of 0.23 is considerable
and therefore streamlining the air flow between the
cab and trailer body roof is of great importance.
14.8 Commercial vehicle drag reducing devices
14.8.1 Cab roof deflectors (Figs 14.54(a and b),
14.55(a and b) and 14.56(a±c))
To partially overcome the large amount of extra
drag experienced with a cab to trailer height mis-
match a cab roof deflector is commonly used. This
device prevents the air movement over the cab roof
impinging on the upper front of the trailer body
and then flowing between the cab and trailer gap,
see Fig. 14.54(a). Instead the air flow is diverted by
the uptilted deflector surface to pass directly
between the cab to trailer gap and then to flow
relatively smoothly over the surface of the trailer
roof, see Fig. 14.54(b). These cab roof deflectors
are beneficial in reducing the head on air flow but
they do not perform so well when subjected to side
winds. Slight improvements can be made to prevent
air flowing underneath and across the deflector
plate by enclosing the sides; this is usually achieved
t
c
0.2 m
1.8 m
(a)
(b)
1.0
0.8
0.6
0.4
0.2
0.0
0.8 0.9 1.0
1.1 1.2
1.3
1.4
1.5
Drag coefficient ( )
C
D
t
c
/
Trailer to cab height step ratio=
c
t
Fig. 14.53 Influence of cab to trailer body height upon the drag coefficient
622
by using a fibre glass or plastic moulded deflector,
see Fig. 14.55(b).
If trailers with different heights are to be coupled
to the tractor unit while in service, then a mismatch
of the deflector inclination may result which will
again raise the aerodynamic drag. There are some
cab deflector designs which can adjust the tilt of the
cab deflector to optimize the cab to trailer air flow
transition (see Fig. 14.55(a)), but in general altering
the angle setting would be impractical. How the
cab roof deflector effectiveness varies with deflec-
tor plate inclination is shown in Fig. 14.56(c) for
both a narrow and a wide cab to trailer gap, repre-
senting a rigid truck and an articulated vehicle
respectively (see Fig. 14.56(a and b)). These graphs
illustrate the general trend and do not take into
account the different cab to trailer heights, cab to
trailer air gap width and the width to height ratio of
the deflector plate. It can be seen that with a
rigid truck having a small cab to trailer gap the
Airstream
Flow
separation
Flow re-attachment
Airstream
Flow
re-attachment
(a) Cab to trailer height mismatch (b) Cab to trailer height mismatch
bridged with roof deflector
Fig. 14.54 (a and b) Air flow between cab and trailer body with and without cab roof deflector
Deflected airstream
Moulded
deflector
(b) Pictorial view(a) Section view
Hinge
Moulded
deflector
Adjustable
vertical
struts
Deflector
side
baffle
Extended
side
panel
Fig. 14.55 (a and b) Moulded adjustable cab roof deflector
623
reduction in the drag coefficient with increased
deflector plate inclination is gradual, reaching an
optimum minimum at an inclination angle of 80
and then commencing to rise again, see Fig. 14.56(c).
With the articulated vehicle having a large cab to
trailer gap, the deflector plate effectiveness
increases rapidly with an increase in the deflector
inclination angle until the optimum angle of 50
is
reached, see Fig. 14.56(c). Beyond this angle the
drag coefficient begins to rise steadily again with
further increase in the deflector plate angle; this
indicates with the large gap of the articulated vehicle
the change in drag coefficient is much more
sensitive to deflector plate inclination.
14.8.2 Yaw angle (Figs 14.57 and 14.58)
With cars the influence of crosswinds on the drag
coefficient is relatively small; however, with much
larger vehicles a crosswind considerably raises the
drag coefficient therefore not only does the direct
air flow from the front but also the air movement
from the side has to be considered. It is therefore
necessary to study the effects crosswinds have on
the vehicle's drag resistance, taking into account the
velocity and angle of attack of the crosswind rela-
tive to the direction of motion of the vehicle and its
road speed. This is achieved by drawing to scale a
velocity vector triangle, see Fig. 14.57. The vehicle
velocity vector line is drawn, then the crosswind
l
x
q
x/l = 0.5
l = 1.64 m
x = 0.82 m
l
x
x/l = 0.3
l = 2.66 m
x = 0.8 m
(a) Rigid truck
(
b
)
Articulated truck
Deflector inclination angle( ) degq
Drag coefficient (C )
D
Articulated
Rigid
(c)
1.00
0.96
0.92
0.88
0.84
0.80
0.76
30 40 50 60 70 80 90
q
Fig. 14.56 (a±c) Optimizing roof deflector effectiveness for both rigid and articulated trucks
Vehicle
Vehicle velocity
Resultant
angle relative
to direction of
motion
(yaw angle)
Relative flow
air velocity
Wind angle
relative to directio
n
of motion
Wind direction
&
velocity
θ
ψ
Fig. 14.57 The yaw angle
624
velocity vector at the crosswind angle to the direc-
tion of motion; a third line representing the relative
air velocity then closes the triangle. The resultant
angle made between the direction the vehicle is
travelling and the resultant relative velocity is
known as the yaw angle, and it is this angle which
is used when investigating the effect of a crosswind
on the drag coefficient.
In addition to head and tail winds vehicles are also
subjected to crosswinds; crosswinds nearly always
raise the drag coefficient, this being far more
pronounced as the vehicle size becomes larger and
the yaw angle (relative wind angle) is increased. The
effect crosswinds have on the drag coefficient for
various classes of vehicles expressed in terms of
the yaw angle (relative wind angle) is shown in
Fig. 14.58. Each class of vehicle with its own head
on (zero yaw angle) air flow drag coefficient is given
a drag coefficient of unity. It can be seen using a
drag coefficient of 1.0 with zero yaw angle (no wind)
that the drag coefficient for a car reaches a peak of
1.08 at a yaw angle of 20
, whereas for the van,
coach, articulated vehicle and rigid truck and trailer
the drag coefficient rose to 1.18, 1.35, 1.5 and 1.7
respectively for a similar yaw angle of 20
.
14.8.3 Cab roof deflector effectiveness versus
yaw angle (Fig. 14.59(a and b))
The benefits of reducing the drag coefficient with a
cab roof deflector are to some extent cancelled out
when the vehicle is subjected to crosswinds. This
can be demonstrated by studying data taken from
Rigid truck and
trailer
Articulated truck
Bus/coach
Van
Car
Yaw angle( ) degψ
1.8
1.6
1.4
1.2
1.0
0
Drag coefficient ( )
C
D
0102030
Fig. 14.58 Influence of yaw angle upon aerodynamic drag
625
one particular vehicle, see Fig. 14.59(a and b), which
utilizes a cab roof deflector; here with zero yaw
angle the drag coefficient reduces from 0.7 to 0.6
as the deflector inclination changes from 90
(vertical) to 50
respectively. With a 5
yaw angle
(relative wind angle) the general trend of drag
coefficient rises considerably to around 0.9 whereas
the tilting of the deflector from the vertical over an
angle of 40
only shows a marginal decrease in the
drag coefficient of about 0.02; with a further 10
inclination decrease the drag coefficient then
commenced to rise steeply to about 0.94. As the
yaw angle is increased from 5 to 10
the drag coef-
ficient rises even more to 1.03 with the deflector in
the vertical position, however this increase in drag
coefficient is not so much as from 0 to 5
. Hence the
reduction in the drag coefficient from 1.03 to 0.98
as the deflector is tilted from the vertical to 40
is
relatively small compared to the overall rise in drag
coefficient due to crosswind effects. However, rais-
ing the yaw angle still further from 10 to 15
indi-
cates on the graph that the yaw angle influence on
the drag coefficient has peaked and is now begin-
ning to decline: both the 10 and 15
yaw angle
curves are similar in shape but the 15
yaw angle
curve is now below that of the 10
yaw angle curve.
Note the minimum drag coefficient deflection inclin-
ation angle is only relevant for the dimensions of
this particular cab to trailer combination.
14.8.4 Comparison of drag resistance with
various commercial vehicle cab arrangements
relative to trailer body height (Fig. 14.60(a±e))
The drag coefficient of a tractor±trailer combin-
ation is influenced by the trailer body height and
by different cab configurations such as a conven-
tional low cab, low cab with roof deflector and high
sleeper cab, see Fig. 14.60(a±c). Thus a high cab
arrangement (see Fig. 14.60(c, d and e)) is shown to
be more effective in reducing the drag coefficient
than a low cab (see Fig. 14.60(a, d and e)) and there-
fore for long distance haulage the sleeper compart-
ment above the driver cab has an advantage in
having the sleeper area behind the driver's seat. Con-
versely with a low cab and a roof deflector which has
an adjustable plate angle (see Fig. 14.60(b, d and e)),
the drag coefficient can be kept almost constant for
different trailer body heights. However, it is not
always practical to adjust the deflector angle, but
fortunately a great many commercial vehicle
y = 10°
y = 15°
y = 5°
y = 0°
Deflector angle ( ) degq
(b)
Drag coefficient ( )
C
D
1.1
1.0
0.9
0.8
0.7
0.6
0.5
40 50 60 70 80 9
0
l
x
q
x/l = 0.18
Deflector size 1.3 0.7 m´
l = 2.66 m
(a)
Fig. 14.59 (a and b) Effect of yaw angle upon drag reducing effectiveness of a cab roof deflector
626
Airstream
Drag coefficient ( )
C
D
0.8
0.7
0.6
0.5
0.4
3.0 3.2 3.4 3.6 3.8 4.0
Low cab
High cab
Adjustable deflector
(a) Low cab and high trailer body
Trailer body height (m)
(d) Effects of different cab roof configurations relative
to trailer body height
(b) Low cab with deflector and high trailer body (e) Articulated truck with different trailer body heights
(c) High cab and trailer body
∆h
h
Fig. 14.60 (a±e) Methods of optimizing air flow conditions with different trailer body heights
627
cab±trailer combinations use the same size trailer
bodies for one particular application so that the
roof deflector angle can be pre-set to the minimum
of drag resistance. With a low cab the drag coeffi-
cient tends to increase as the cab roof to body roof
step height becomes larger whereas with a high cab
the drag coefficient tends to decrease as trailer
body height rises, see Fig. 14.60(d and e).
14.8.5 Corner vanes (Fig. 14.61(a±c))
The cab of a commercial vehicle resembles a cube
with relatively flat upright front and side panels, thus
with well rounded roof and side leading edges the
cab still has a blunt front profile. When the vehicle
moves forward the cab penetrates the surrounding
air; however, the air flow passing over the top,
underneath and around the sides will be far from
being streamlined. Thus in particular the air flow-
ing around the side leading edges of the cab may
initially separate from the side panels, causing
turbulence and a high resistance to air flow, see
Fig. 14.61(a).
One method of reducing the forebody drag is
to attach corner vanes on each side of the cab
(Fig. 14.61(c)). The corner vane is set away from
the rounded vertical edges and has several evenly
spaced internal baffles which bridge the gap
between the cab and corner vane walls. Air meeting
the front face of the cab moves upwards and over
the roof, while the rest flows to the left and right
hand side leading edges. Some of this air also flows
around the leading edge through the space formed
between the cab and corner vanes (see Fig. 14.61
(b and c)); this then encourages the airstream to
remain attached to the cab side panel surface. Air
drag around the cab front and side panels is there-
fore kept to a minimum.
14.8.6 Cab to trailer body gap (Fig. 14.62)
Air passing between the cab and trailer body gap
with an articulated vehicle due to crosswinds sig-
nificantly increases the drag resistance. As the
crosswind angle of attach is increased, the flow
through the cab-trailer gap produces regions of
flow separated on the sheltered side of the trailer
body, see Fig. 14.62. This flow separation then
tends to spread rearwards, eventually interacting
with and enlarging the trailer wake, the net result
being a rise in the rearward pull due to the enlarged
negative pressure zone.
Direction
of air
flow
Corner
vane
(c) Pictorial view of corner
vanes mounted on cab
(b) Air flow with corner vanes
(a) Air flow without corner vanes
Cab
Flow
separation
Corner
vanes
Fig. 14.61 (a±c) Influence of corner vanes in reducing cab side panel flow separation
628
14.8.7 Cab to trailer body gap seals (Fig. 14.63
(a and b), 14.64, 14.65(a and b) and 14.66(a±d))
Simple tilt plate cab roof deflectors when subjected
to side winds tend to counteract the gain in head on
airstream drag resistance unless the deflector sides
are enclosed. With enclosed and streamlined cab
roof deflector sides, see Fig. 14.55(a and b), improve-
ments in the drag coefficient can be made with
yaw angles up to about 20
, see Fig. 14.63(a and b).
Further reductions in the drag coefficient are
produced when the cab to trailer gap is sealed by
some sort of partition which prevents air flowing
through the cab to body gap, see Fig. 14.63
(a and b). The difficulty with using a cab to trailer
air gap partition is designing some sort of curtain
or plate which allows the trailer to articulate when
manoeuvring the vehicle-trailer combination.
Cab to trailer gap seals can be divided into three
basic designs:
1 Cab extended side panels
2 Centre line gap seals (splitter plate seal)
3 Windcheater roller edge device (forebody edge
fairing).
Cab extended side panels (Fig. 14.64) These
devices are basically rearward extended vertical
panels attached to the rear edges of the cab which
are angled towards the leading edges of the trailer
body. This type of gap fairing (side streamlining) is
effective in reducing the drag coefficient with
increasing crosswind yaw angle. With zero and
10
yaw angles a drag coefficient reduction of
roughly 0.05 and 0.22 respectively have been
made possible.
Cab Trailer body
Tractor-
trailer
gap
Side
wind
Sheltered
side
Exposed
side
Fig. 14.62 Air flow through tractor-trailer gap with crosswind
629
Deflector
Gap seal
(b)
12
10
8
6
4
2
0
% reduction of C compared with basic cab
D
Yaw angle ( ) degψ
51015 2
0
0
(a) Low cab with roof deflector and gap seals
Deflector
Gap seal
Fig. 14.63 (a and b) Drag reductions with crosswinds when incorporating a roof deflector and gap seal
Extended
side panel
Minimum
turning
circle
King-pin
Gap
Cab
Trailer body
Fig. 14.64 Cab extended side panels
Cab
Standing
vortices
Minimum
turning
circle
Single splitter
plate
King-pin
Gap
(a) Centre line
g
ap seal (b) Offset flexible
g
ap seals
Cab
Standing
vortices
Double flexibe
vertical plates
King-pin
Gap
Fig. 14.65 (a and b) Cab to trailer body gap seals
630
Crosswind
Flow separation
Recirculating
air bubble
Sharp
leading
edge
Airstream
flow pattern
Unstable
vortices
Head on
wind
Crosswind
Flow
separation
Re-attachment
Rounded
leading
edge
Air stream
flow pattern
Head on wind
(a) Sharp corner with
and without crosswind
(b) Rounded corner with
and without crosswind
Roof
panel
Air
flow
stream
Trailer
body
front
panel
(c) Extended quadrant corner (windcheater)
Yaw angle ( ) deg.ψ
Change in drag coefficient ( )∆
C
D
0.9
0.8
0.7
0.6
0
5
10 15 20
Semicircular
Elongated semicircular
Quadrant
Extended quadrant
Extended
quadrant
section
Side
panel
(d) Effectiveness of various
forebody edge sections upon
drag coefficient
Fig. 14.66 (a±d) Trailer forebody edging fairings
631