Advanced Vehicle Technology Episode 3 Part 11 doc
Bạn đang xem bản rút gọn của tài liệu. Xem và tải ngay bản đầy đủ của tài liệu tại đây (290.62 KB, 20 trang )
direction of flow represented by the pulley weight
which opposes the movement of the plate.
Pressure drag can be reduced by streamlining any
solid form exposed to the air flow, for instance a
round tube (Fig. 14.12(b)) encourages the air to flow
smoothly around the front half and part of the rear
before flow separation occurs thereby reducing the
resistance by about half that of the flat plate. The
resistance of a tube can be further reduced to about
15% of the flat plate by extending the rear of the
circulating tube in the form of a curved tapering
lobe, see Fig. 14.12(c). Even bigger reductions in
resistance can be achieved by proportioning the
tube section (see Fig. 14.12(d)) with a fineness ratio
a/b of between 2 and 4 with the maximum thickness
b set about one-third back from the nose, see
Fig. 14.12(e). This gives a flow resistance of roughly
one-tenth of a round tube or 5% of a flat plate.
14.2.2 Air resistance opposing the motion
of a vehicle (Fig. 14.13)
The formula for calculating the opposing resistance
of a body passing though air can be derived as
follows:
Let us assume that a flat plate body (Fig. 14.13)
is held against a flow of air and that the air particles
are inelastic and simply drop away from the
perpendicular plate surface. The density of air is
the mass per unit volume and a cubic metre of air
at sea level has an approximate mass of 1.225 kg,
therefore the density of air is 1.225 kg/m
3
.
Then let
Mass m kg
Volume Q m
3
Density kg=m
Hence
m
Q
kg=m
À3
or m Q
kg
m
3
m
3
kg
Let
Density of air flow kg=m
3
Frontal area of plate A m
2
Velocity of air striking surface v m=s
Volume of air striking
plate per second Q vA m
3
Mass movement of air per second Q ÂvA
since Q vA
Momentum of this air (mv) vA Âv
therefore momentum lost by
air per second Av
2
From Newton's second law the rate at which the
movement of air is changed will give the force
exerted on the plate.
Roller
Direction
of force
Vortices
Air
flow
Pulley
Weight
Plate
Fig. 14.13 Pressure drag apparatus
592
Hence
force on plate Av
2
Newton's
However, the experimental air thrust against a
flat plate is roughly 0.6 of the calculated Av
2
force.
This considerable 40% error is basically due to the
assumption that the air striking the plate is brought
to rest and falls away, where in fact most of the air
escapes round the edges of the plate and the flow
then becomes turbulent. In fact the theoretical air
flow force does not agree with the actual experi-
mental force (F ) impinging on the plate, but it has
been found to be proportional to Av
2
hence
F G Av
2
therefore air resistance F C
D
Av
2
where C
D
is the coefficient of proportionality.
The constant C
D
is known as the coefficient of
drag, it has no unity and its value will depend upon
the shape of the body exposed to the airstream.
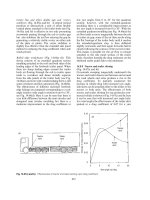
14.2.3 After flow wake (Fig. 14.14)
This is the turbulent volume of air produced at the
rear end of a forward moving car and which tends
to move with it, see Fig. 14.14. The wake has a
cross-sectional area equal approximately to that
of the rear vertical boot panel plus the rearward
projected area formed between the level at which
the air flow separates from the downward sloping
rear window panel and the top edge of the boot.
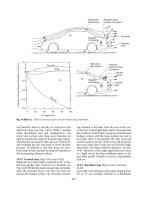
14.2.4 Drag coefficient
The aerodynamic drag coefficient is a measure of
the effectiveness of a streamline aerodynamic body
shape in reducing the air resistance to the forward
motion of a vehicle. A low drag coefficient implies
that the streamline shape of the vehicle's body is
such as to enable it to move easily through the
surrounding viscous air with the minimum of resis-
tance; conversely a high drag coefficient is caused
by poor streamlining of the body profile so that
there is a high air resistance when the vehicle is in
motion. Typical drag coefficients for various
classes of vehicles can be seen as follows:
Vehicle type drag coefficient C
D
Saloon car 0.22±0.4
Sports car 0.28±0.4
Light van 0.35±0.5
Buses and coaches 0.4±0.8
Articulated trucks 0.55±0.8
Ridged truck and draw bar trailer 0.7±0.9
14.2.5 Drag coefficients and various body shapes
(Fig. 14.15(a±f ))
A comparison of the air flow resistance for differ-
ent shapes in terms of drag coefficients is presented
as follows:
(a) Circular plate (Fig. 14.15(a)) Air flow is head
on, and there is an immediate end on pressure
difference. Flow separation takes place at the
rim; this provides a large vortex wake and a
correspondingly high drag coefficient of 1.15.
(b) Cube (Fig. 14.15(b)) Air flow is head on but
a boundary layer around the sides delays the
flow separation; nevertheless there is still a large
vortex wake and a high drag coefficient of 1.05.
(c) Sixty degree cone (Fig. 14.15(c)) With the
piecing cone shape air flows towards the
cone apex and then spreads outwards parallel
to the shape of the cone surface. Flow separ-
ation however still takes place at the periph-
ery thereby producing a wide vortex wake.
This profile halves the drag coefficient to
about 0.5 compared with the circular plate
and the cube block.
Flow
separation
Turbulent
volume
Wake
Fig. 14.14 After flow wake
593
(d) Sphere (Fig. 14.15(d)) Air flow towards the
sphere, it is then diverted so that it flows out-
wards from the centre around the diverging sur-
face and over a small portion of the converging
rear half before flow separation occurs. There is
therefore a slight reduction in the vortex wake
and similarly a marginal decrease in the drag
coefficient to 0.47 compared with the 60
cone.
(e) Hemisphere (Fig. 14.15(e)) Air flow towards
and outwards from the centre of the hemi-
sphere. The curvature of the hemisphere gradu-
ally aligns with the main direction of flow after
which flow separation takes place on the per-
iphery. For some unknown reason (possibly
due to the very gradual alignment of surface
curvature with the direction of air movement
near the rim) the hemisphere provides a lower
drag coefficient than the cone and the sphere
shapes this, being of the order of 0.42.
(f ) Tear drop (Fig. 14.15(f )) If the proportion of
length to diameter is well chosen, for example
0.25, the streamline shape can maintain a
boundary layer before flow separation occurs
almost to the end of its tail. Thus the resistance
to body movement will be mainly due to viscous
air flow and little to do with vortex wake suc-
tion. With these contours the drag coefficient
can be as low as 0.05.
14.2.6 Base drag (Fig. 14.16(a and b))
The shape of the car body largely influences the
pressure drag. If the streamline contour of
the body is such that the boundary layers cling to
a converging rear end, then the vortex area is con-
siderably reduced with a corresponding reduction
in rear end suction and the resistance to motion. If
the body was shaped in the form of a tear drop, the
contour of the body would permit a boundary layer
to continue a considerable way towards the tail
before flow separation occurs, see Fig. 14.16(a),
consequently the area heavily subjected to vortex
swirl and negative pressure will be at a minimum.
However, it is impractical to design a tear drop
body with an extended tapering rear end, but if
the tail is cut off (bobtailed) at the point where
the air flow separates from the contour of the
body (see Fig. 14.16(b)), the same vortex (negative
pressure) exists as if the tail was permitted to con-
verge. The cut off cross-section area where flow
separation would occur is known as the `base
area' and the negative vortex pressure produced is
referred to as the `base drag'. Thus there is a trend
(b) Cube ( = 1.05)
C
D
(c) 60 cone ( = 0.5)
C
D
°
(d) Sphere ( = 0.47)
C
D
(e) Hemisphere ( = 0.42)
C
D
(f) Tear drop ( = 0.05)
C
D
(a) Circular disc ( = 1.15)
C
D
Fig. 14.15 (a±e) Drag coefficient for various shaped solids
594
for car manufacturers to design bodies that taper
slightly towards the rear so that flow separation
occurs just beyond the rear axle.
14.2.7 Vortices (Fig. 14.17)
Vortices are created around various regions of a
vehicle when it is in motion. Vortices can be
described as a swirling air mass with an annular
cylindrical shape, see Fig. 14.17. The rotary speed
at the periphery is at its minimal, but this
increases inversely with the radius so that its
speed near the centre is at a maximum. However,
there is a central core where there is very little
movement, consequently viscous shear takes place
between adjacent layers of the static core and the
fast moving air swirl; thus the pressure within
the vortex will be below atmospheric pressure,
this being much lower near the core than in the
peripheral region.
14.2.8 Trailing vortex drag (Fig. 14.18(a and b))
Consider a car with a similar shape to a section
of an aerofoil, see Fig. 14.18(a), when air flows
from the front to the rear of the car, the air
moves between the underside and ground, and
over the raised upper body profile surfaces. Thus
if the upper and lower airstreams are to meet at the
rear at a common speed the air moving over the
top must move further and therefore faster than
the more direct underfloor airstream. The air
pressure will therefore be higher in the slower
underfloor airstream than that for the faster air-
stream moving over the top surface of the car.
Now air moves from high to low pressure regions
so that the high pressure airstream underneath the
car will tend to move diagonally outwards and
upwards towards the low pressure airstream flow-
ing over the top of the body surface (see Fig.
14.18(b)). Both the lower and the upper airstreams
eventually interact along the side-to-top profile
edges on opposite sides of the body to form an
inward rotary air motion that continues to whirl
for some distance beyond the rear end of the for-
ward moving car, see Fig. 14.18(a and b). The
magnitude and intensity of these vortices will to a
great extent depend upon the rear styling of the
Airstreamlines
Point of
separation
–Ve
Wake
+Ve
(a) Tear drop shaped body
–Ve
Wake
+Ve
Propelling
force
Drag
force
Base
area
(b) Bobtailed tear drop
Fig. 14.16 (a and b) Base drag
595
Inner region
Outer region
High
angular
speed
and
low
pressure
Low
angular
speed
and
high
pressure
Inner core
air mass
no
movement
Where V = Liner velocity
= Angular velocity
r = Radius
ω
ω =
∴ =ω
or r = a constantω
v
r
1
r
Outer
rim
Swirl
ω =0
0<ω
Fig. 14.17 The vortex
Direction
of motion
Negative
pressure
Trailing
vortex cone
Merging
airstream
(a) Pictorial view
Slower airstream
and higher air pressure
underneath body
Diagonal airstream
Trailing vortex
cone
(b) Plan view
Direction
of motion
Ideal aerofoil car shape
Air moving from
low to high
pressure region
Faster airstream low pressure
over upper body surface
Fig. 14.18 (a and b) Establishment of trailing vortices
596
car. The negative (below atmospheric) pressure
created in the wake of the trailing vortices at the
rear of the car attempts to draw it back in the
opposite direction to the forward propelling
force; this resistance is therefore referred to as the
`trailing vortex drag'.
14.2.9 Attached transverse vortices
(Fig. 14.19(a and b))
Separation bobbles which form between the bonnet
(hood) and front windscreen, the rear screen and
boot (trunk) lid and the boot and rear light panel
tend to generate attached transverse vortices (see
Fig. 14.19(a and b)). The front attached vortices
work their way around the `A' post and then
extend along the side windows to the rear of the
car and beyond. Any overspill from the attached
vortices in the rear window and rear light panel
regions merges and strengthens the side panel vor-
tices (see Fig. 14.19(b)); in turn the products of
these secondary transverse vortices combine and
enlarge the main trailing vortices.
Separation bubble
transforms into
transverse vortex
'A' post
Side
vortex
Side vortex
Trailing
vortex
cone
Transverse
vortex
(a) Front and side vortices
(
b
)
Rear and side vortices
Airstream
Fig. 14.19 (a and b) Notch back transverse and trailing vortices
597
14.3 Aerodynamic lift
14.3.1 Lift coefficients
The aerodynamic lift coefficient C
L
is a measure of
the difference in pressure created above and below
a vehicle's body as it moves through the surround-
ing viscous air. A resultant upthrust or downthrust
may be produced which mainly depend upon the
body shape; however, an uplift known as positive
lift is undesirable as it reduces the tyre to ground
grip whereas a downforce referred to as negative
lift enhances the tyre's road holding.
14.3.2 Vehicle lift (Fig. 14.20)
When a car travels along the road the airstream
moving over the upper surface of the body from
front to rear has to move further than the underside
airstream which almost moves in a straight line (see
Fig. 14.20). Thus the direct slower moving under-
side and the indirect faster moving top side air-
stream produces a higher pressure underneath the
car than over it, consequently the resultant vertical
pressures generated between the upper and under
surfaces produce a net upthrust or lift. The magni-
tude of the lift depends mainly upon the styling
profile of both over and under body surfaces, the
distance of the underfloor above the ground, and
the vehicle speed. Generally, the nearer the under-
floor is to the ground the greater the positive lift
(upward force); also the positive lift tends to
increase with the square of the vehicle speed. Cor-
respondingly a reduction in wheel load due to the
lift upthrust counteracts the downward load; this
therefore produces a reduction in the tyre to
ground grip. If the uplift between the front and
rear of the car is different, then the slip-angles
generated by the front and rear tyres will not be
equal; accordingly this will result in an under- or
over-steer tendency instead of more neutral-steer
characteristics. Thus uncontrolled lift will reduce
the vehicle's road holding and may cause steering
instability.
14.3.3 Underbody floor height versus
aerodynamic lift and drag
(Figs 14.21(a and b) and 14.22)
With a large underfloor to ground clearance the car
body is subjected to a slight negative lift force
(downward thrust). As the underfloor surface
moves closer to the ground the underfloor air
space becomes a venturi, causing the air to move
much faster underneath the body than over it, see
Figs 14.21(a) and 14.22. Correspondingly with
these changing conditions the air flow pressure on
top of the body will be higher than for the under-
body reduced venturi effect pressure, hence there
will be a net down force (negative lift) tending to
increase the contact pressure acting between the
wheels and ground. Conversely a further reduction
in underfloor to ground clearance makes it very
restrictive for the underbody air flow (see Figs
14.21(b) and 14.22), so that much of the airstream
is now compelled to flow over the body instead of
underneath it, which results in an increase in air
speed and a reduction in pressure over the top to
cope with the reduction in the underfloor air
Atmospheric
pressure (+ve)
Faster moving air
greater reduction
in pressure
Upthrust
(positive lift)
Low pressure
wake (–ve)
Direction
of motion
Drag
resistance
Higher stagnant
air pressure
Slower moving air
slight reduction
in pressure
Fig. 14.20 Aerodynamic lift
598
movement. Thus the over and under pressure con-
ditions have been reversed which subsequently now
produces a net upward suction, that is, a tendency
toward a positive lift.
14.3.4 Aerofoil lift and drag
(Figs 14.23(a±d), 14.24(a and b) and 14.25)
Almost any object moving through an airstream
will be subjected to some form of lift and drag.
Consider a flat plate inclined to the direction of
air flow, the pressure of air above the surface of
the plate is reduced while that underneath it is
increased. As a result there will be a net pressure
on the plate striving to force it both upwards and
backwards, see Fig. 14.23(a). It will be seen that
the vertical and horizontal components of the
resultant reaction represents both lift and drag
respectively, see Fig. 14.23(b). The greater the
angle of inclination, the smaller will be the upward
lift component, while the backward drag component
will increase, see Fig. 14.23(c and d). Conversely as
the angle of inclination decreases, the lift increases
and the drag decreases; however, as the angle of
inclination is reduced so does the resultant reaction
force. If an aerofoil profile is used instead of the flat
plate, (see Fig. 14.24(a and b)), the airstream over the
top surface now has to move further and faster than
the underneath air movement. This produces a
greater pressure difference between the upper and
lower surfaces and consequently greatly enhances
the aerodynamic lift and promotes a smooth air
flow over the upper profiled surface. A typical rela-
tionship between the C
L
, C
D
and angle of attack
(inclination angle) is shown for an aerofoil section
in Fig. 14.25.
14.3.5 Front end nose shape (Fig. 14.26(a±c))
Optimizing a protruding streamlined nose profile
shape influences marginally the drag coefficient
and to a greater extent the front end lift coefficient.
(a) Large ground clearance (negative lift downthrust)
(b) Small ground clearance (positive lift upthrust)
Slow air flow
high pressure
Fast air flow
low pressure
Positive
lift
(+ve)
Small increase in air speed
small reduction in pressure
(compared with Fig. 14.21(b))
Venturi effect
Small reduction in air speed
small increase in pressure
(compared with Fig. 14.21(b))
Negative
lift
(–ve)
h
h
Fig. 14.21 (a and b) Effects of underfloor to ground clearance on the surrounding air speed, pressure and aerodynamic
lift
599
With a downturned nose (see Fig. 14.26(a)) the
streamlined nose profile directs the largest propor-
tion of the air mass movement over the body, and
only a relatively small amount of air flows under-
neath the body. If now a central nose profile is
adopted (see Fig. 14.26(b)) the air mass movement
is shared more evenly between the upper and lower
body surfaces; however, the air viscous interfer-
ence with the underfloor and ground still causes the
larger proportion of air to flow above than below
the car's body. Conversely a upturned nose (see
Fig. 14.26(c)) induces still more air to flow
beneath the body with the downward curving
entry gap shape producing a venturi effect.
Consequently the air movement will accelerate
before reaching its highest speed further back at
its narrowest body to ground clearance. Raising
the mass airflow in the space between the body
and ground increases the viscous interaction of the
air with the under body surfaces and therefore
forces the air flow to move diagonally out and
upward from the sides of the car. It therefore
strengthens the side and trailing vortices and as a
result promotes an increase in front end aerody-
namic lift force.
The three basic nose profiles discussed showed,
under windtunnel tests, that the upturned nose had
the highest drag coefficient C
D
of 0.24 whereas
there was very little difference between the central
and downturned nose profiles which gave drag
coefficients C
D
of 0.223 and 0.224 respectively.
However the front end lift coefficient C
L
for the
three shapes showed a marked difference, here the
upturned nose profile gave a positive lift coefficient
C
L
of 0.2, the central nose profile provided an
almost neutral lift coefficient C
L
of 0.02, whereas
the downturned nose profile generated a negative
lift coefficient C
L
of À0.1.
0.3
0.2
0.1
0
–0.1
–0.2
–0.3
Small ground
clearance
Car height range
Positive lift upthrust
h/b
Lift coefficient ( )
C
L
Venturi
Free stream rangeVenturi effect range
Negative lift downthrust
0 0.2 0.4 0.6 0.8 1.0
Large
ground
clearance
h
b
Fig. 14.22 Aerodynamic lift versus ground, floor height
600
14.4 Car body drag reduction
14.4.1 Profile edge rounding or chamfering
(Fig. 14.27(a and b))
There is a general tendency for aerodynamic lift
and drag coefficients to decrease with increased
edge radius or chamfer: experiments carried out
showed for a particular car shape (see Fig. 14.27(a))
how the drag coefficient was reduced from 0.43 to
0.40 with an edge radius/chamfer increasing from
zero to 40 mm (see Fig. 14.27(b)), and there was a
slightly greater reduction with chamfering than
rounding the edges; however, beyond 40 mm radius
there was no further advantage in increasing the edge
radius or chamfer.
14.4.2 Bonnet slope and windscreen rake
(Fig. 14.28(a±c))
Increasing the bonnet (hood) slope angle a from
zero to roughly 10
reduces the drag coefficient,
but beyond 10
the drag reduction is insignificant,
see Fig. 14.28(b). Likewise, increasing the rake angle
g reduces the drag coefficient (see Fig. 14.28(c))
particularly when the rake angle becomes large;
Upward
force
Backward
force
Low
pressure
High
pressure
(a) Reaction force on an inclined plate
(c) Small angle of inclination
Direction of
air flow
Large lift
component
Smaller
lift
component
Resultant
reaction
Larger
drag
component
Resultant
reaction
Small
drag
component
(b) Lift and drag components on an inclined plate
(d) Large angle of inclination
Direction of
air flow
Lift
force
Total
reaction
Drag force
Angle of
inclination
(angle of attack)
q
q
q
q
Fig. 14.23 (a±d) Lift and drag on a plate inclined at a small angle to the direction of air flow
Turbulent flow
over upper surface
Direction of
air flow
Direction of
air flow
(a) Inclined plate (b) Inclined aerofoil
Vortices
Plate
Up wash
Decreased
air speed
higher pressure
Smooth flow over
upper surface
Increased air speed
lower pressure
Down wash
Fig. 14.24 (a and b) Air flow over a flat plate and aerofoil inclined at a small angle
601
however, very large rake angles may conflict with
the body styling.
14.4.3 Roof and side panel cambering
(Figs 14.29(a and b) and 14.30(a and b))
Cambering the roof (see Fig. 14.29(a and b)) and the
side panels (see Fig. 14.30(a and b)) reduces the drag
coefficient. However, if the roof camber curvature
becomes excessive the drag coefficient commences
to rise again (see Fig. 14.29(b)), whereas the reduc-
tion in drag coefficient with small amounts of side-
panel cambering is marked (see Fig. 14.30(b)), but
with excessive camber the reduction in the drag
coefficient becomes only marginal. Both roof and
side panel camber should not be increased at the
expense of enlarging the frontal area of the car as
this would in itself be counter-productive and would
increase the drag coefficient.
14.4.4 Rear side panel taper
(Fig. 14.31(a and b))
Tapering inwards the rear side panel reduces the
drag coefficient. This can be seen in Fig. 14.31
(a and b) which shows a marked reduction in the
drag coefficient with both a 50 mm and then a
125 mm rear end contraction on either side of the
car; however, there was no further reduction in the
drag coefficient when the rear end contraction was
increased to 200 mm.
14.4.5 Underbody rear end upward taper
(Fig. 14.32(a and b))
Tilting upwards the underfloor rear end produces
a diffuser effect which shows a promising way to
reduce the drag coefficient, see Fig. 14.32(a and b).
However, it is important to select the optimum
ratio of length of taper to overall car length and
the angle b of upward inclination for best results.
14.4.6 Rear end tail extension
(Fig. 14.33(a and b))
Windtunnel investigation with different shaped tail
models have shown that the minimal drag coeffi-
cients were produced with extended tails, see Fig.
14.33(a and b), but this shape would be impractical
for design reasons. Conversely if the rear end tail is
0.0
0.00
0.05
0.10
0.15
0.20
0.25
0.30
0 4 8 12 16 20
0.2
0.4
0.6
0.8
1.0
1.2
lift
Lift coefficient ( )
C
L
Drag coefficient ( )
C
D
An
g
le of attack ( ) de
g
Θ
drag
Fig. 14.25 Lift and drag coefficient versus angle of inclination (attack)
602
cropped at various lengths and curved downwards
there is an increase in the drag coefficient with each
reduction in tail length beyond the rear wheels.
14.4.7 Underbody roughness
(Fig. 14.34(a and b))
The underbody surface finish influences the drag
coefficient just as the overbody curvature, tapering,
edge rounding and general shape dictates the drag
resistance. Moulding in individual compartments in
the underfloor pan to house the various components
and if possible enclosing parts of the underside with
plastic panels helps considerably to reduce the drag
resistance. The underside of a body has built into it
many cavities and protrusions to cater with the
following structural requirements and operating
Small mass
air flow below
Large mass
air flow below
Medium mass
air flow below
Small trailing
vortices
Large trailing
vortices
Medium trailing
vortices
Large mass
air flow overhead
Small mass
air flow overhead
(a) Downturned nose profile
(b) Central nose profile
(c) Upturned nose profile
Medium mass
air flow overhead
Medium side
air flow
Large side
air flow
Small diagonal
side flow
Viscous air
interaction
Fig. 14.26 (a±c) A greatly exaggerated air mass distribution around a car body for various nose profiles
603
Optimum
nose
Chamfered
Rounded
Rounded
Chamfered
Radius or chamfer (mm)
Drag coefficient (C )
D
(a)
(b)
r
r
0.39
0.40
0.41
0.42
0.43
0 10203040
Fig. 14.27 (a and b) Influence of forebody bonnet (hood) edge shape on drag coefficient
Bonnet
(hood)
slope
Windscreen
rake angle
Windscreen rake angle ( ) degγBonnet slope angle ( ) degα
Drag coefficient ( )
C
D
(a)
(b) (c)
∝
∝
0.32 0.32
30 40 50 60 700 246810
0.34 0.34
0.36 0.36
0.38 0.38
0.40 0.40
Drag coefficient ( )
C
D
Dra
g
coefficient ( )
C
D
Fig. 14.28 (a±c) Bonnet slope and windscreen rake angle versus drag coefficient
604
Roof camber
Roof camber (h/l)
Change in drag coefficient ( )
C
D
(a)
(b)
–0.02
–0.01
–0.00
0 0.02 0.04 0.06 0.08 0.10
l
h
Fig. 14.29 (a and b) Effect of roof camber on drag coefficient
L
x
Body side panel camber
(a)
(b)
–0.03
Side panel camber ( /L)x
Change in drag coefficient ( )
C
D
0 0.02 0.04 0.06
–0.02
–0.01
0
Fig. 14.30 (a and b) Effect of side panel camber on drag coefficient
Fig. 14.31 (a and b) Effect of rear side panel taper on drag coefficient
605
components: front and rear wheel and suspension
arch cavities, engine, transmission and steering com-
partment, side and cross member channelling, floor
pan straightening ribs, jacking point straightening
channel sections, structural central tunnel and rear
wheel drive propeller shaft, exhaust system catalytic
converter, silencer and piping, hand brake cable,
and spare wheel compartment etc. A rough under-
body produces excessive turbulence and friction
losses and consequently raises the drag coefficient,
whereas trapped air in the underside region slows
down the air flow and tends to raise the underfloor
pressure and therefore positive lift force. Vehicles
with high drag coefficients gain least by smoothing
the underside. The underfloor roughness or depth of
irregularity defined as the centre line average peak
to valley height for an average car is around
150 mm. A predictable relationship between the
centre line average roughness and the drag coeffi-
cient for a given ground clearance and vehicle length
is shown in Fig. 14.34(a and b).
14.5 Aerodynamic lift control
14.5.1 Underbody dams (Fig. 14.35(a±c))
Damming the underbody to ground clearance at
the extreme rear blocks the underfloor airstream
and causes a partial pressure build-up in this
region, see Fig. 14.25(a), whereas locating the
underbody dam in the front end of the car joins
the rear low pressure wake region with the under-
floor space, see Fig. 14.35(b). Thus with a rear end
underfloor air dam the underfloor air flow pressure
increase raises the aerodynamic upthrust, that is, it
produces positive lift, see Fig. 14.35(a). Conversely
a front end air dam reduces the underfloor air
flow pressure thereby generating an aerodynamic
downthrust, that is, it produces negative lift (see
Fig. 14.35(b)). Experimental results show with a front
end dam there is a decrease in front lift (negative
lift) whereas there is a slight rise in rear end lift
(positive lift) as the dam height is increased, and
as would be expected, there is also a rise in drag as
the frontal area of the dam is enlarged, see
Fig. 14.35(c).
14.5.2 Exposed wheel air flow pattern
(Fig. 14.36(a±c))
When a wheel rotates some distance from the
ground air due to its viscosity attaches itself to the
tread and in turn induces some of the surrounding
air to be dragged around with it. Thus this con-
centric movement of air establishes in effect a weak
vortex, see Fig. 14.36(a). If the rotating wheel is in
contact with the ground it will roll forwards which
makes windtunnel testing under these conditions
difficult; this problem is overcome by using a sup-
portive wheel and floor rig. The wheel is slightly
submerged in a well opening equal to the tyre width
and contact patch length for a normal loaded wheel
and a steady flow of air is blown towards the
frontal view of the wheel. With the wheel rig simu-
lating a rotating wheel in contact with the ground,
the wheel vortex air movement interacts and dis-
torts the parallel main airstream.
t
L
β
Diffuser angle ( ) degβ
0 5 10 15 20 25
Change in drag coefficient ( )
C
D
– 0.05
– 0.04
– 0.03
– 0.02
– 0.01
0
0.01
0.02
t
/ = 0.5
L
t
/ = 0.2
L
(a)
(b)
Fig. 14.32 (a and b) Effect of rear end upward taper on drag coefficient
606
The air flow pattern for an exposed wheel can be
visualized and described in the following way. The
air flow meeting the lower region of the wheel will
be stagnant but the majority of the airstream will
flow against the wheel rotation following the con-
tour of the wheel until it reaches the top; it then
separates from the vortex rim and continues to flow
towards the rear but leaving underneath and in the
wake of the wheel a series of turbulent vortices, see
Fig. 14.36(b). The actual point of separation will
creep forwards with increased rotational wheel
speed. Air pressure distribution around the wheel
will show a positive pressure build-up in the stag-
nant air flow front region of the wheel, but this
changes rapidly to a high negative pressure where
the main air flow breaks away from the wheel rim,
see Fig. 14.36(c). It then declines to some extent
beyond the highest point of the wheel, and then
remains approximately constant around the rear
wake region of the wheel. Under these described
conditions, the exposed rotating wheel produces
a resultant positive upward lift force which tends
to reduce the adhesion between the tyre tread and
ground.
(a)
(b)
0.0
0.1
0.2
0.3
0.4
Tail extension (mm)
Drag coefficient ( )
C
D
0 500 1000 1500 2000 6000
432
1
2
3
4
700
1300
1900
5720 mm5650 mm
1
Fig. 14.33 (a and b) Effect of rear end tail extension on drag coefficient
607
+
0
–
Underbody
surface profile
(a)
Drag coefficient ( )
C
D
(b)
0.4
0.3
0.2
0 100 200 300
S
m
a
l
l
g
r
o
u
n
d
c
l
e
a
r
a
n
c
e
L
a
r
g
e
g
r
o
u
n
d
c
l
e
a
r
a
n
c
e
Roughness (centre line average) ± mm
Fig. 14.34 (a and b) Effect of underbody roughness on drag coefficient
Reducing
pressure
Air dam
(rear & partial sides)
Air dam
(front & partial sides)
Reducing
pressure
Wake negative
pressure (–ve)
Upthrust
positive
lift (+ve)
Front end
vented
Semi high
stagnant
pressure
High speed
low pressure
High speed
low pressure
Low
pressure
Rear end
vented
Downthrust
negative
lift (–ve)
(a) Rear end underbody air dam
Change in drag and lift coefficients (C and )
DL
C
0.2
0.1
0
– 0.1
–0.2
–0.3
(b) Front end underbody air dam
(c)
R
e
a
r
l
i
f
t
D
r
a
g
F
r
o
n
t
l
i
f
t
0 100 200 300
Dam height (mm)
h
Fig. 14.35 (a±c) Effects of underbody front and rear end air dams relative to the lift and drag coefficient
608
14.5.3 Partial enclosed wheel air flow pattern
(Figs 14.37(a and b) and 14.38(a±c))
The air flow passing beneath the front of the
car initially moves faster than the main airstream,
this therefore causes a reduction in the local air
pressure. At the rear of the rotating wheel due to
viscous drag air will be scooped into the upper
space formed between the wheel tyre and the
wheel mudguard arch (see Fig. 14.37(a and b)). The
air entrapped in the wheel arch cavity circulates
towards the upper front of the wheel due to a
slight pressure build-up and is then expelled
through the front end wheel to the mudguard gap
which is at a lower pressure in both a downward
and sideward direction. Decreasing the clearance
between the underside and the ground and shield-
ing more of the wheel with the mudguard tends to
produce a loss of momentum to the air so that both
Concentric
streamlines
Weak
vortex
Velocity
gradi nte
Separation
vortices
Positive
lift (+ve)
Point of
separation
Airstream
Direction of
wheel movement
θ
Low pressure
region
High pressure
region
(b) Air flow pattern with wheel rolling on the ground
(a) Wheel rotation in still air away from the ground
Resultant
upward
lift (+ve)
Pressure
distribution
ω
Positive
pressure (+ve)
Negative
pressure (–ve)
Direction
of motion
(c) Air pressure distribution with wheel rolling on the ground
ω
ω
Fig. 14.36 (a±c) Exposed wheel air flow pattern and pressure distribution
609
aerodynamic lift C
LW
and drag C
DW
coefficients,
and therefore forces, are considerably reduced
Fig. 14.38(a±c).
14.5.4 Rear end spoiler (Fig. 14.39(a±c))
Generally when there is a gentle rear end body
profile curvature change, it will be accompanied
with a relatively fast but smooth streamline air flow
over this region which does not separate from the
upper surface. However, this results in lower local
pressures which tend to exert a lift force (upward
suction) at the rear end of the car. A lip, see Fig.
14.39(a), or small aerofoil spoiler, see Fig. 14.39(b),
attached to the rear end of the car boot (trunk)
interrupts the smooth streamline air flow thereby
slowing down the air flow and correspondingly
raising the upper surface local air pressure which
effectively increase the downward force known as
negative lift. A typical relationship between rear
lift, front lift and drag coefficients relative to the
spoiler lip height is shown in Fig. 14.39(c). The
graph shows a general increase in negative lift
(downward force) by increasing the spoiler lip
height. However, this is at the expense of a slight
rise in the front end lift coefficient, whereas the
drag coefficient initially decreases and then mar-
ginally rises again with increased spoiler lip height.
It should be appreciated that the break-up of the
smooth streamline air flow and the increase in rear
downward pressure should if possible be achieved
without incurring too much, if any, increase in
front end positive lift and aerodynamic drag.
14.5.5 Negative lift aerofoil wings
(Fig. 14.40(a±c))
A negative lift wing is designed when attached to
the rear end of the car to produce a downward
thrust thereby enabling the traction generated by
the rear driving wheels to be increased, or if a
forward negative lift wing is fitted to improve the
grip of both front steering wheels.
With the negative lift wing the aerofoil profile is
tilted downward towards the front end with the
negative and positive aerofoil section camber at
the top and bottom respectively, see Fig. 14.40(a).
The airstream therefore moving underneath the
Wheel
arch
Vortices
Cavity
Airstream
(a) Side view
Vortices
Flow separation
(b) Plan view
ω
Fig. 14.37 (a and b) Wheel arch air flow pattern
610
aerofoil wing has to move further and faster than
the airstream flowing over the upper surface; the
pressure produced below the aerofoil wing is there-
fore lower than above. Consequently there will be a
resultant downthrust perpendicular to the cord of
the aerofoil (see Fig. 14.40(b)) which can be resolved
into both a vertical downforce (negative lift) and a
horizontal drag force. Enlarging the tilt angle of the
wing promotes more negative lift (downthrust) but
this is at the expense of increasing the drag force
opposing the forward movement of the wing, thus
a compromise must always be made between
improving the downward wheel grip and the extra
drag force opposing the motion of the car. Racing
cars have the aerofoil wing over the rear wheel
axles or just in front or behind them, see Fig.
14.40(c). However, the drag force produces a clock-
wise tilt which tends to lift the front wheels of the
ground, therefore the front aerofoil wings (see Fig.
14.40(c)) are sometimes attached low down and
slightly ahead of the front wheels to counteract
the front end lift tendency.
14.6 Afterbody drag
14.6.1 Squareback drag (Figs 14.41 and 14.42)
Any car with a rear end (base) slope surface angle
ranging from 90
to 50
is generally described as a
squareback style (see Fig. 14.42). Between this
angular surface inclination range for a squareback
car there is very little change in the air flow pattern
(a) Side view (b) Front view
h
D
1.2
1.0
0.8
0.6
0.4
0.2
0
0 0.2 0.4 0.6 0.8 1.0
(c)
C
DW
C
LW
–0.6
–0.4
–0.2
0
0.2
0.4
0.6
h/D
Wheel drag coefficient( )
C
DW
Wheel lift coefficient
(
)
C
LW
Fig. 14.38 (a±c) Effect of underside ground clearance on both lift and drag coefficients
611