Applied Wetlands Science - Chapter 10 ppsx
Bạn đang xem bản rút gọn của tài liệu. Xem và tải ngay bản đầy đủ của tài liệu tại đây (4.2 MB, 42 trang )
Kent, Donald M. “Design and Management of Wetlands for Wildlife”
Applied Wetlands Science and Technology
Editor Donald M. Kent
Boca Raton: CRC Press LLC,2001
©2001 CRC Press LLC
CHAPTER
10
Design and Management of
Wetlands for Wildlife
Donald M. Kent
CONTENTS
Design
Size
Relationship to Other Wetlands
Disturbance
Design Guidelines
Management
Management Approaches
Management Techniques
Vegetation Management
Burning
Grazing
Herbicide Application
Mechanical Management
Blasting
Bulldozing, Draglining, and Dredging
Crushing
Cutting
Disking
Propagation
Water-Level Manipulation
Artificial Nesting and Loafing Sites
Fisheries
References
©2001 CRC Press LLC
Wildlife management had been concerned primarily with the administration and
regulation of waterfowl and furbearer harvests prior to the 1930s. It was about this
time that wildlife managers, as well as the public, recognized that wildlife resources
were not limitless. Leopold crystallized this emerging perspective in his book
Game
Management
(1933) that gave birth to the scientific management of wildlife popu-
lations and wildlife habitats.
Wetlands are especially critical habitats for wildlife and exceed all other land
types in wildlife productivity (Vaught and Bowmaster, 1983; Cowardin and Goforth,
1985; Payne, 1992). Wildlife species use wetlands on either a permanent or transitory
basis for breeding, food, and shelter (Pandit and Fotedar, 1982; Rakstad and Probst,
1985). In the United States, wetlands provide critical habitat for 80 of 276 threatened
and endangered species. Approximately 64 percent of the wildlife in the Great Lakes
region of the United States inhabit or are attracted to wetlands, including 62 percent
of the birds, 69 percent of the mammals, and 71 percent of the amphibians and
reptiles (Rakstad and Probst, 1985). From 67 to 90 percent of commercial fish and
shellfish species are either directly or indirectly dependent upon wetlands (Peters
et al., 1979; Vaught and Bowmaster, 1983; Radtke, 1985). Wetlands are also the
principal habitat for furbearers and waterfowl. Approximately 10 to 12 million ducks
breed in the contiguous United States and 45 million ducks depend on wetlands
throughout the United States and Canada for their existence (Vaught and Bowmaster,
1983; Radtke, 1985).
Wetland wildlife has a quantifiable economic value. Hundreds of millions of
dollars are spent annually on birdwatching and other wildlife observations. Fresh-
water fisherman spent $7.8 billion dollars in 1980 and waterfowl hunters spent $950
million in 1975 (Radtke, 1985). In 1975–1976, more than 8.5 million furbearer pelts
with a value in excess of $35.5 million were harvested (Chabreck, 1979).
Valuable wetland habitats are being lost and degraded at an alarming rate;
more than 200,000 ha of wetlands are lost per year (Low in Payne, 1992). Annual
losses to agriculture range from 1 to 4 percent (Weller, 1981). Prairie potholes in
the United States and Canada are lost at a rate of 1 to 2 percent per year, and 75
percent of northern central United States wetlands were lost between 1850 and
1977 (U.S. Department of Agriculture, 1980; Radtke, 1985; Melinchuk and
Mackay, 1986). Bottomland hardwood forests were cleared at a rate of 66,800 ha
per year between 1940 and 1980, reducing forested wetlands in some states by
96 percent (Korte and Fredrickson, 1977; Radtke, 1985). Coastal wetlands have
also suffered dramatic losses, with more than 10,000 ha per year being lost from
Gulf Coast wetlands (Chabreck, 1976; Gagliano, 1981). Many of the wetlands
that remain are degraded from channelization, damming, and agricultural and
urban surface runoff. As well, these remaining wetlands are typically fragmented
or isolated and occur on private land.
Coincident with the loss and degradation of wetlands is a decline in continental
waterfowl populations. Breeding mallard populations have declined at a rate of up
to 19 percent since 1970 (Melinchuk and MacKay, 1986). Weller (1981) estimates
that 90 million waterfowl nests were lost in the north central United States between
1850 and 1977, and wintering waterfowl populations declined by 70 percent between
©2001 CRC Press LLC
the mid-1950s and 1983 (Whitman and Meredith, 1987). The effect of wetland loss
and degradation on other wildlife remains largely undetermined.
The exceptional value of wetlands as wildlife habitat, and the continued loss and
degradation of wetlands, necessitate the careful design of new habitats and the
management of existing habitat. The majority of high quality wetland habitats, those
uninfluenced by extrinsic disturbances, are already preserved in parks and refuges.
Opportunities for designing new habitats are few. Many other wetland habitats offer
less than optimal habitat. For the latter, application of management techniques can
increase productivity.
DESIGN
A wetland designed for wildlife is the combination of details and features that,
when implemented, results in the provision of habitat for wildlife that use wetlands
to satisfy all or part of their life requisites. The design should be a preliminary sketch
or plan for work to be executed, conceived in the mind, and fashioned skillfully. In
practice, designs for wetlands can take several forms.
The simplest and earliest efforts at designing wetlands for wildlife were char-
acterized by the preservation of wildlife habitat. The most prominent effort among
these in the United States was the establishment of the National Wildlife Refuge
system, which protects uplands as well as wetlands. Florida's Pelican Island was the
first refuge, established in 1903 by President Theodore Roosevelt to protect egrets,
herons, and other birds that were being killed for their feathers. There are presently
over 450 National Wildlife Refuges, comprising a network that encompasses over
90 million acres of lands and waters. Southern bayous, bottomland hardwood forests,
swamps, prairie potholes, estuaries, and coastal wetlands are represented. Preserva-
tion of wetland wildlife habitat continues, although at a slower pace, through the
efforts of government initiatives and private organizations.
The restoration and enhancement of historic wetlands and the creation of new
wetlands characterize more complex approaches to the design of wetlands for wild-
life. Illustrative of large-scale restoration efforts in the United States, the 1985 Food
Security Act has provided for wetland restoration on Farmers Home Administration
and Conservation Reserve Program lands. Almost 55,000 acres of agricultural lands
were restored to wetlands between 1987 and 1989, and another 90,000 acres were
targeted for restoration in 1990 and 1991 (Mitchell in Kusler and Kentula, 1990).
The North American Wetlands Conservation Act enacted in 1989 will provide 25
million dollars annually in federal matching funds over the next 15 years for resto-
ration of wetlands vital to waterfowl and other migratory birds. Wildlife managers
(Weller, 1987, 1990; Weller et al., 1991) have effected other restoration and enhance-
ment efforts for years, in some cases to counteract the effects of previous manage-
ment efforts (Talbot et al., 1986; Newling, 1990; Rey et al., 1990). At a generally
smaller scale, restoration designs occur as mitigation requirements for regulated
wetland fills (Kusler and Kentula, 1990).
Designing wetlands for wildlife through creation of wetlands is undoubtedly
a greater challenge than preservation or restoration. Whereas design through
©2001 CRC Press LLC
preservation is accomplished through observation of current wildlife use, and design
through restoration is accomplished through historical knowledge of wildlife use,
creation requires the attraction of wildlife to a new resource. Prominent among
creation efforts in the United States is the Dredged Material Research Program of
the U.S. Army Corps of Engineers (1976). Authorized by the River and Harbor Act
of 1970, the USACOE Waterways Experiment Station (WES) initiated research in
1973 that included testing and evaluation of concepts for wetland and upland habitat
development (Garbisch, 1977; Lunz et al., 1978a). WES has since designed and
constructed thousands of acres of freshwater and coastal wetlands from dredged
material and demonstrated the value of these wetlands to wildlife (Cole, 1978;
Crawford and Edwards, 1978; Lunz et al., 1978b; Webb et al., 1988; Landin et al.,
1989). As is the case with restoration, the wetland regulatory process has resulted
in a large number of small-scale wetlands designed at least in part for wildlife
(Michael and Smith, 1985; USCOE, 1989; Kusler and Kentula, 1990).
The fundamental principles for effective design are the same regardless of
whether a design for wetland wildlife is accomplished through preservation of
existing wildlife habitat, restoration or enhancement of historic wetland habitat, or
the creation of new wetland habitat. The principles are related to minimum habitat
area, minimum viable population, and tolerance of the wildlife species for distur-
bance. Therefore, the objective of this chapter is to discuss the effects of wetland
size, the relationship of the wetland to other wetlands, and anthropogenic disturbance
on wetland effectiveness for providing wildlife habitat.
Size
Size is generally the first factor considered in designing a wetland for wildlife.
Ideally, the objectives of the design, for example provision of all life requisites for
the species of interest, determine wetland size. More often, land or financial con-
straints, or even mitigation requirements, pre-ordain the size of the wetland. In these
instances, an assessment should be made of what wildlife species can reasonably
be supported.
Grinnell and Swarth (1913) were the first to note the relationship between the
number of species and the size of the habitat in their study of montane peaks.
Following attempts to quantify the relationship for terrestrial habitats (Cain, 1938),
it was the application of the concept to true islands which led to its widespread
recognition (MacArthur and Wilson, 1963, 1967). In what has become known as
the theory of island biogeography, the greater the size of the island the greater the
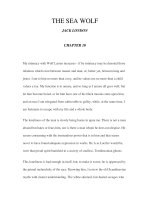
species richness. This relationship is described by
S
=
CA
z
where
S
is the number of species,
A
is the area, and
C
and
z
are dimensionless
constants that need to be fitted for each set of species-area data (Figure 1, MacArthur
and Wilson, 1967). The relationship is thought to occur primarily because larger
islands have more habitat and greater habitat diversity.
©2001 CRC Press LLC
Although the theory has its origins in terrestrial ecology, there are reservations
about the applicability of island biogeography to terrestrial reserves (Kushlan, 1979;
Harris, 1984; Forman and Godron, 1986). Certainly there are inherent differences
between the two systems because the nature of surrounding habitat is far more
distinct for oceanic islands than terrestrial islands. This should result in differences
in true island and terrestrial island immigration rates. Nevertheless, the relationship
between terrestrial island size and species richness has been demonstrated to hold
for birds and large mammal species and for habitat types such as forests, urban
parkland, caves, and mountains (Culver, 1970; Vuilleumier, 1970, 1973; Brown,
1971; Peterken, 1974, 1977; Moore and Hooper, 1975; Galli et al., 1976; Gavareski,
1976; Whitcomb, 1977; Thompson, 1978; Fritz, 1979; Gottfried, 1979; Robbins,
1979; Bekele, 1980; Whitcomb et al., 1981; Ambuel and Temple, 1983; Lynch and
Whigham, 1984). Therefore, despite inherent differences between oceanic and ter-
restrial islands, there is evidence that the same isolating mechanisms are operating.
The degree to which these mechanisms operate is, of course, dependent upon the
degree of habitat insularity, which in turn depends on species-specific habitat spec-
ificity, tolerance, and vagility. Harris (1984) has suggested that the isolating mech-
anisms operate most strongly on amphibians and reptiles, followed by mammals,
resident birds, and then migratory birds. The degree to which the latter group is
susceptible depends on breeding site fidelity and the extent to which reproduction
is restricted to the breeding site.
Figure 1
The theory of island biogeography suggests that the greater the size of the island,
the greater the species richness (MacArthur and Wilson, 1967). The relationship
is thought to occur because larger islands have more habitat and greater habitat
diversity.
z
s
©2001 CRC Press LLC
An estimated 47 million ha of wetlands were lost in the contiguous United States
between 1780 and 1980 (Dahl, 1990). This loss has fragmented and insularized
remaining wetlands, producing in many cases relatively small terrestrial islands.
Wildlife populations are increasingly isolated and reduced in size, leading inevitably
to extinction (Senner, 1980). Extinction occurs for several reasons. First, small,
closed populations are more susceptible to extrinsic factors such as predation, dis-
ease, and parasitism, and to changes in the physical environment. Second, demo-
graphic stochasticity, the random variation in sex ratio and birth and death rates,
contributes to fluctuations in population size (Steinhart, 1986), increasing the sus-
ceptibility of small, closed populations to random extinction events. Finally, small,
closed populations suffer genetic deterioration, primarily due to inbreeding, leading
to a decrease in population fitness (Soulé, 1980; Allendorf and Leary, 1986; Ralls
et al., 1986; Soulé and Simberloff, 1986).
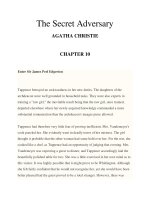
The effects of inbreeding depression can be illustrated by considering the fate
of a small, closed population (Senner, 1980). For an effective population size (
N
e
,
number of breeding individuals) of 4, constrained by extrinsic factors to a maximum
of 10 individuals, genetic heterozygosity declines with each successive generation
(Figure 2). As heterozygosity declines, the average survival of offspring declines
due to inbreeding depression. Inbreeding depression includes viability depression,
which is the failure of offspring to survive to maturity, and fecundity depression,
which is the tendency for inbred animals to be sterile. Mammals, in which the male
X chromosome is always hemizygous, also suffer sex ratio depression by way of a
relative increase in males. As fecundity decreases, the population size can no longer
be maintained at its limit. The probability of survival, while initially very high, drops
very sharply after approximately 15 generations. The population approaches extinc-
tion after approximately 25 generations.
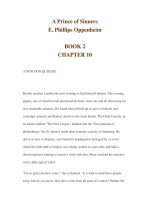
The rate of loss of heterozygosity per generation (
f
) for inbreeding populations
is equal to 1/2
N
e
, and animal breeders note an obvious effect on fecundity as
f
approaches 0.5 or 0.6 (Soulé, 1980). Because
∆
f
= 1 – (1 – 1/
2N
e
,)
t
substituting 0.6 for
∆
f
and solving for
t
(number of generations) indicates that the
number of generations to the extinction threshold is approximately 1.5 times
N
e
(Soulé, 1980). Smaller populations and those with shorter generation times become
extinct in less time than larger populations and those with longer generation times
(Figure 3).
Domestic animal breeders have determined that an inbreeding rate of 2 or 3
percent per generation is sufficient for selection to eliminate deleterious genes
(Stephenson et al., 1953; Dickerson et al., 1954). Citing differences between domes-
tic and natural populations, Soulé (1980) has recommended that a 1 percent inbreed-
ing rate be adapted as the threshold for natural populations. Because
f
= 1/2
N
e
,
©2001 CRC Press LLC
the minimum effective population size is 50 if the inbreeding rate is to be maintained
at 1 percent. However, even at this rate a population of
N
e
= 50 will lose about 1/4
of its genetic variation in 20 to 30 generations (Soulé, 1980). Setting the inbreeding
rate at 0.1 percent, Franklin (1980) has recommended a minimum effective popu-
lation size of 500 individuals for long-term survival. Depending upon generation
length, number of young, and percent survival, the minimum viable population size
may be somewhat more or less than 500 (Shaffer, 1981).
Of course, genetic risks are not the only threat to long-term population survival.
Demographic risks such as disease, meteorological catastrophes, and populations
too dispersed to effect breeding can also be important contributors to the determi-
nation of minimum viable population size when populations are very small (Good-
man, 1987). However, with few exceptions, genetic deterioration should occur well
in advance of demographic extinction, and demographic risks will be seen to exac-
erbate genetic risks. Also, many demographic risks are largely unpredictable, there-
fore negating the development of effective design criteria discrete from those derived
from genetic considerations. Therefore, it seems reasonable to emphasize genetic
risks when estimating minimum viable population size.
For reproductively isolated populations, minimum refuge size is a product of
home range size and minimum effective population size. The home range sizes for
many wetland wildlife species are poorly understood (as is the degree of reproductive
Figure 2
The fate of a small (
N
e
= 4), closed population constrained by extrinsic factors to
few individuals (10 in this example) is a decline in genetic heterozygosity, a decline
in offspring survival, and a decline in population size (Senner, 1980).
©2001 CRC Press LLC
isolation). Nevertheless, for purposes of illustration, consider three distinct wetland
species: the bullfrog (
Rana catesbeiana
), the Pacific water shrew (
Sorex bendirei
),
and the mink (
Mustela vison
). The bullfrog is territorial only during breeding and
has been observed living and breeding in permanent ponds as small as 1.5 m diameter
(Graves and Anderson, 1987). Pacific water shrew are territorial and have a home
range of approximately 1 ha (Harris, 1984). Male and female mink have generally
distinct home ranges of approximately 12 ha (Allen, 1986). Minimum refuge sizes
for a minimum effective population size of 50 are 1.9
×
10
–2
, 54.5, and 600 ha,
respectively. For a minimum effective population size of 500 individuals, refuge
sizes are 0.19, 545, and 6000 ha. These estimates are likely conservative because
they assume all individuals in the populations are contributing to the gene pool. As
Figure 3
Based on the rate of loss of heterozygosity per generation for inbreeding popula-
tions, the number of generations to the extinction threshold is 1.5 times
N
e
(Soulé, 1980). Smaller populations and those with shorter generation times
become extinct in less time than larger populations and those with longer gener-
ation times.
e
©2001 CRC Press LLC
noted above, minimum refuge size is modified by generation length, number of
young, and percent survival.
Some existing preserves appear to be large enough to support minimum viable
populations of at least some species. National Wildlife Refuges range in size from
0.4 ha in Mille Lacs, AK, to 8 million ha in Yukon Delta, AK, and average approx-
imately 80,000 ha. Although many refuges consist of uplands as well as wetlands,
it is clear that at least some National Wildlife Refuges are large enough to support
minimum viable populations of some species. However, few opportunities remain
for the preservation of such large tracts, and wetlands outside the refuge system may
not be large enough to support minimum viable populations. For example, 28 percent
of wetland habitats in the east and central Florida region are less than 2 ha in size,
and 40 to 60 percent are less than 20 ha in size (Gilbrook, 1989). Restoration,
enhancement, and creation of riverine wetlands have sometimes resulted in relatively
large contiguous habitats (Baskett, 1987; Weller et al., 1991). More frequently how-
ever, these efforts result in wetlands of hundreds of ha, tens of ha, and even areas
of less than 1 ha (Michael and Smith, 1988; Ray and Woodroof, 1988; Reimold and
Thompson, 1988; U.S. Army Corps of Engineers, 1989; Landin and Webb, 1989).
Relationship to Other Wetlands
Given the paucity of large wetlands available for preservation, and the very real
possibility that smaller wetlands will not support minimum viable populations of
many species, it is necessary to provide mechanisms for interpopulation movement.
Interpopulation movement increases effective habitat size and creates a metapopu-
lation (Gilpin, 1987). The metapopulation is composed of an interacting system of
local populations that suffer extinction and are recolonized from within the region.
The metapopulation will be sustained if the source(s) of colonists are proximally
located, and the immigration rate is greater than the reciprocal of the time to
extinction (Brown and Kodric-Brown, 1977). The metapopulation has a decreased
danger of accidental extinction compared to individual populations and an ability
to counter genetic drift through occasional migration. In the absence of a metapo-
pulation, the wetland internal disturbance regime becomes the critical design feature,
and the minimum dynamic area must be large enough to support internal colonization
sources (Pickett and Thompson, 1978). As discussed above, this minimum dynamic
area is likely to be unattainable in many instances.
Metapopulations can reasonably be established and maintained if interpopulation
movement can be effected at a minimum rate of every few generations (Wright,
1969; Nei et al., 1975; Kiester et al., 1982; Allendorf, 1986). The rate of movement
is a function of the distance between populations and the quality of the intervening
habitat, and will vary among species based upon dispersal ability, habitat specificity,
and habitat tolerance.
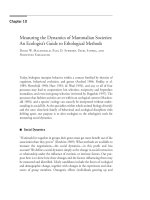
The rate of movement between populations varies inversely with the distance
between habitats (McArthur and Wilson, 1967; Diamond, 1975; Gilpin, 1987; Soulé,
1991). Animals find it more difficult to disperse from one habitat to another as the
distance between habitats increases, and habitats are more likely to be recolonized
following extinction events if habitats occur in close proximity (Figure 4, Wilson
©2001 CRC Press LLC
and Willis, 1975; Brown and Kodric-Brown, 1977; Soulé, 1991). For example,
unoccupied spruce grouse (
Dendragapus canadensis
) habitat is significantly further
from occupied habitat than other occupied habitat (Fritz, 1979). Rodents, rabbits,
and hares appear to benefit from proximally located habitats (Soulé, 1991), and
mammals typically disperse less than 5 home range diameters (Chepko-Sade and
Halpin, 1987). Generally, small, sedentary, cursorial species with narrow habitat
tolerances will be more greatly affected by the distance between habitats than will
large pedestrian species, volant species, migratory species, and species with broad
habitat tolerances.
Ultimately, interpopulation movement is determined by the quality of the inter-
vening habitat, with quality a function of species-specific habitat tolerance (Harris,
1984; Forman and Godron, 1986; Noss, 1987). At its simplest, intervening habitat
can be viewed as either unsuitable or suitable, with unsuitable habitat constituting
barriers to movement and suitable habitat constituting corridors. Roadways are
classic barriers that inhibit the movement of mammals (Oxley et al., 1974; Madsen,
1990), and are responsible for the death of an estimated 100 million amphibians,
reptiles, birds, and mammals per year (Arnold, 1990; Anon., 1992; Lopez, 1992).
Some bird species have an intrinsic aversion to abandoning cover (Diamond, 1973;
Soulé, 1991), and rodents tend to stay within suitable habitat (Holekamp, 1984;
Garrett and Franklin, 1988; Wiggett and Boag, 1989). At the mesoscale and
Figure 4
Animals find it easier to disperse from one habitat to another if those habitats are
closely juxtaposed than if habitats are widely separated. For example, in this
photograph two wetlands are separated by about 20 m of upland. Close juxtapo-
sition of habitats also facilitates recolonization following local extinction events.
©2001 CRC Press LLC
macroscale, lakes, mountains, and valleys affect mammal dispersal (Shirer and
Downhower, 1968; Seidensticker et al., 1973; Storm et al., 1976).
For species such as these with poor dispersal abilities or narrow habitat toler-
ances, individual populations comprising the metapopulation must be connected by
suitable habitat. Alternatively, discrete habitats could be closely juxtaposed. Road-
way crossings should be avoided, although movement can be effected for some
species by the use of underpasses (Arnold, 1990; Madsen, 1990; Soulé, 1991).
Unsuitable habitat is more likely to be used as a corridor if the transit time between
populations is short enough that forage and cover are not required.
Other species have greater dispersal abilities and broader habitat tolerances. For
example, a Florida black bear (
Ursus americanus
) traversed eight major highways,
a dozen other roadways, a river, several canals, fences, farmland, and skirted sub-
urban areas in an 11 week journey (Arnold, 1990). As another example, McIntyre
and Barrett (1992) noted that Australian bird species preferred to move within
forested areas but traversed open areas when necessary. For species such as these,
intervening habitat is comprised of various degrees of suitability, each of which can
be tolerated for various lengths of time.
Few, if any, specific guidelines exist for determining the effective distance
between populations, or the quality of intervening habitat. In the absence of specific
information demonstrating the broader abilities of dispersers, wetland design efforts
should focus on establishing corridors of habitat similar to that being used by existing
individual populations. Individual populations should be located as closely together
as possible so as to minimize transit time, and corridor width should approach home
range diameter as transit time increases. Noss (1993) recommends that corridors be
wide enough to minimize edge effects, meet the needs of the most sensitive species,
and accommodate a variety of successional stages. This conservative approach is
more likely to ensure long-term survival of species with poor dispersal abilities such
as amphibians, reptiles, some bird species, and small mammals than other designs.
For large mammals and some bird species, corridors may consist of dissimilar habitat
if species use can be demonstrated. For migratory bird species, corridors may be
largely unnecessary, and design efforts should focus on providing habitat require-
ments at breeding and wintering sites, and stopping points in-between.
Disturbance
Disturbance is a change in structure caused by factors external to the hierarchical
level of the system of interest (Pickett et al., 1989). As it pertains to wildlife,
disturbance alters birth and death rates by directly killing individuals or by affecting
resources upon which those individuals rely (Petraitis et al., 1989). Generally, small
areas are more susceptible to disturbance than larger areas (Norse et al., 1986).
Disturbance can be either natural, in that it occurs as part of normal community
dynamics, or anthropogenic. Natural disturbance provides for the continued exist-
ence of species which use temporary habitats (Soulé and Simberloff, 1986), and
species richness is generally maximized at moderate frequencies or intensities of
disturbance (Connell, 1978; Pickett and White, 1985). Natural disturbance regimes
©2001 CRC Press LLC
can be accommodated within a single large reserve (alpha diversity) or by a series
of reserves (beta diversity) serving a metapopulation.
By contrast, anthropogenic disturbance is generally detrimental to overall, long-
term community health. Anthropogenic disturbance can be intrusive, in which people
or domesticated animals enter wetland habitat and normal community processes are
disrupted. Intrusive disturbance has been institutionalized at many local, state, and
federal reserves with the advent of nature trails and viewing areas. Other examples
of intrusive disturbance include boat and vehicle incursions, hunting, and lumbering.
The primary effect of intrusive disturbance is to disrupt waterfowl, wading bird, and
raptor nesting and foraging (Pough, 1951; Kushlan, 1976; Palmer, 1976; Kale, 1978;
U.S. Fish and Wildlife Service, 1984; Short and Cooper, 1985; Peterson, 1986;
Ambruster, 1987).
The simplest way to counter intrusive disturbance is to prevent access to habitats.
However, denying public access to natural areas is difficult to justify and even more
difficult to enforce. Moreover, denied access diminishes the educational value of
natural areas. Therefore, more realistic efforts will focus on minimizing the disrup-
tive effects of the intrusion by avoiding sensitive areas, restricting access at critical
times of the year, and limiting the number of people accessing the area at any one
time. Secondary efforts will include avoiding damage to vegetative and water
resources by constructing low impact trails and establishing viewing areas at the
periphery of the habitat.
Anthropogenic activities external to the wetland also cause disturbances. Clas-
sically, the wetland edge was viewed as an area of increased vertebrate biomass and
productivity (Leopold, 1933; Lay, 1938; McAtee, 1945; Giles, 1978). Certain species
of wildlife, notably deer (
Odocoileus
spp.), rabbits (
Sylvilagus
spp.), gamebirds, and
some raptors, appear to benefit from the juxtaposition of wetlands and uplands
(Bider, 1968; Gates and Hale, 1974; Gates and Gysel, 1978; Petersen, 1979; Wilcove
et al., 1986). More recently, there has been recognition of the detrimental effects of
this juxtaposition (Figure 5). The edge is subject to an increased frequency and
severity of fire, hunting and poaching, nest predation, nest parasitism, and a replace-
ment of the native mammal community by exotic species (Stalmaster and Newman,
1978; Robbins, 1979; Tremblay and Ellison, 1979; Rodgers and Burger, 1981;
Whitcomb et al., 1981; Brittingham and Temple, 1983; Wilcove, 1985a, b; Klein in
Brown et al., 1989; Soulé, 1991). Differences in microclimate, browsing, and other
disturbances favor weedy plant species and a vegetation community that differs
markedly from the interior (Wales, 1972; Ranney, 1977; Forman and Godron, 1986;
Lovejoy et al., 1986).
The extent of the edge effect on interior species has only been reasonably
quantified for forest bird species. The effect, if any, to emergent and other open
wetland systems remains to be addressed. Nevertheless, Wales (1972) and Ranney
(1977) determined that major vegetation changes occur from 10 to 30 m into the
forest, with the greatest effects occurring along the southerly edge. Lovejoy et al.
(1986), working in tropical rainforests, found microclimate varied up to 100 m into
the interior, and that interior birds did not occur within 50 m of the edge. In temperate
forest, Whitcomb et al. (1981) found a negative impact from surrounding altered
habitats on interior bird species occurring up to 100 m from the forest edge, whereas
©2001 CRC Press LLC
Wilcove (1985a) found edge-related nest parasitism and predation to songbirds up
to 600 m from the edge.
Whether the edge is viewed as beneficial or detrimental depends upon the
objectives of the design. Regardless of objectives, a decrease in the ratio of interior
to edge will increase the relative number of edge adapted species and decrease the
relative number of interior adapted species. Isodiametric (round) wetlands will
maximize the interior-to-edge ratio, whereas elongated wetlands will minimize the
interior-to-edge ratio. Isodiametric wetlands also have a secondary benefit of mini-
mizing internal dispersal distance (Diamond, 1975; Wilson and Willis, 1975). Main-
taining interior adapted species with a decreasing interior-to-edge ratio will likely
require increased protection and management.
Clearly, detrimental edge effects on interior species will be reduced as refuge
size increases. If the edge effect extends to 100 m (Lovejoy et al., 1986), then wetland
refuges must be larger than 10 ha to accommodate interior species. Wetland refuges
must be greater than 100 ha to accommodate interior species if the effect extends
600 m as Wilcove (1985a) has suggested. Wetlands smaller than these minimum
sizes will, in theory, accommodate only edge adapted or disturbance tolerant species.
However, caution must be exercised in extrapolating effects on temperate and tropical
forest bird species to wetland species in general.
Another way in which to minimize disturbance associated with detrimental edge
effects is to establish upland buffers to the wetland refuge. Wetland-related wildlife
use surrounding uplands to fulfill part of their life requisites. In the United States,
Figure 5
Although the edge was historically viewed as an area of increased productivity,
recent evidence has illustrated detrimental effects to interior species from exposure
to anthropogenic disturbance.
©2001 CRC Press LLC
Errington (1957) noted rabbits, woodchucks, foxes, ducks, herons, small birds, and
mammals, skunks, minks, and muskrats using the upland areas adjacent to Iowa and
South Dakota marshes. Deer (
Odocoileus virginianus
) and pheasants (
Phasianus
colchicus
) seek cover in dense upland vegetation surrounding wetlands (Gates and
Hale, 1974; Linder and Schitosky, 1979). Red-tailed hawk (
Buteo jamaicensis
),
pheasant, northern harrier (
Circus cyaneus
), and leopard frog (
Rana pipiens
) forage
in upland borders (Errington and Breckenridge, 1936; Dole, 1965; Gates and Hale,
1974; Petersen, 1979). Salamanders, and some frogs and toads, spend the majority
of their adult lives in fields and forests (Behler and Find, 1979). Waterfowl, turtle,
and mammal breed along the upland border of wetlands (Allen and Shapton, 1942;
Errington, 1957; Jahn and Hunt, 1964; Pils and Martin, 1978; Weller, 1978; DeGraaf
and Rudis, 1986; Kirby, 1988). The upland buffer also serves as a travel corridor, a
refuge during periods of high water, and a shield for wetland species from anthro-
pogenic activity (Meanly, 1972; Porter, 1981)
In large part, buffers proposed to protect wetland wildlife are based upon best
professional judgment or knowledge of species spatial requirements. Leedy et al.
(1978) determined that a buffer of up to 92 m is necessary on either side of a stream
to provide required wildlife habitat elements. This opinion has surfaced in several
efforts to establish effective wildlife buffers in New Jersey (Roman and Good, 1985;
Diamond and Nilson, 1988; New Jersey Department of Environmental Regulation,
1988). Adopting a more rigorous approach, Brown et al. (1989) considered spatial
requirements, and using guilds and indicator species, determined that buffers should
be 98 to 224 m wide, with a minimum of 15 m of upland included in the buffer.
Buffers in the latter study are measured from the waterward edge of forested areas,
whereas marsh buffers are measured from the landward edge of the wetland.
There are few studies which note the distance at which wildlife are disturbed by
human activity, and much of this information is anecdotal (Short and Cooper, 1985;
Brady and Buchsbaum, 1989; Brown et al., 1989). Disturbance distances for 23
species of birds range from 6 to 459 m, and averaged 74 m (Table 1). No strong
patterns are apparent that would suggest a relationship between disturbance distance
and taxonomic group, body size, or ecological niche.
In a less direct manner, buffers protect wetland wildlife by removing sediment,
nutrients, salt, bacteria, virus, and chemical pollutants from agricultural and urban
surface runoff (Karr and Schlosser, 1977; Sullivan, 1986; U.S. Department of Agri-
culture Soil Conservation Service, 1986; Potts and Bai, 1989). Berger (1989) sug-
gested that one reason for a general decrease in the number of amphibians is
excessive agricultural chemical pollution. Vegetated buffers can be effective in pre-
venting or minimizing environmental degradation of wetlands (Dillaha et al., 1989).
Determining appropriate buffer widths adequate to reduce the level of distur-
bance to wetlands from surface runoff has received more rigorous examination than
attempts to establish buffers based upon direct disturbance to wildlife. Recommen-
dations vary considerably and reflect regional and local differences in the aforemen-
tioned factors (Table 2). Empirical studies have identified buffer needs of 15 m to
61 m to prevent natural debris and sediment accumulation in streams (Trimble and
©2001 CRC Press LLC
Sartz, 1957; Broderson, 1973). Theoretical treatments have identified buffer needs
of 15 to 224 m (New Jersey Department of Environmental Regulation, 1988; Brady
and Buchsbaum, 1989; Brown et al., 1989; Dillaha et al., 1989; Potts and Bai, 1989;
East Central Florida Regional Planning Council, 1991).
Generally, wetland refuges surrounded by natural vegetation, particularly trees
and shrubs that serve as visual and auditory screens from anthropogenic activity,
will likely withstand smaller buffers than wetlands surrounded by disturbed habitats.
Wetlands surrounded by passive recreational areas, such as golf courses and ball
fields, will likely withstand smaller buffers than wetlands surrounded by residential,
commercial, and industrial development. Wetland refuges surrounded by gentle
slopes, natural vegetation communities, and course-grained, well-drained soils with
a relatively high organic content will likely withstand smaller buffers than refuges
surrounded by steeper slopes, disturbed vegetation communities, and fine-grained,
poorly drained soils with a relatively low organic content. Buffer size should
generally increase with an increase in the quality of the wetland, an increase in the
size and intensity of surrounding development, and a decrease in surface runoff
particle size.
Table 1 Disturbance Tolerance Distances for 23 Species of Birds (Short and
Cooper, 1985; Brady and Buchsbaum, 1989; and Brown et al., 1985)
Scientific Name Common Name
Disturbance
Distance (m)
Anas americana
American widgeon 92
Anas clypeata
Northern shoveler 92
Anas discors
Blue-winged teal 92
Anas fulvigula
Mottled duck 37
Anhinga anhinga
Anhinga 6
Ardea horodias
Great blue heron 100
Buteo jamaicensis
Red-tailed hawk 31
Calidra alba
Sanderling 73
Calidris alpina
Dunlin 92
Calidris mauri
Western sandpiper 73
Calidris minutilla
Least sandpiper 73
Casmerodius albus
Great egret 18
Catoptrophorus semipalmatus
Willet 73
Charadrius vociferus
Killdeer 55
Egretta caerulea
Little blue heron 55
Egretta thula
Snowy egret 73
Eudocimus albus
White ibis 73
Fulica americana
American coot 37
Haliaetus leucocephalus
Bald eagle 459
Pandion haliaetus
Osprey 6
Pelicanus occidentalis
Brown pelican 6
Phalacrocorax auritus
Double-crested cormorant 6
Podilymbus podiceps
Pied-billed grebe 73
Average 74
©2001 CRC Press LLC
Design Guidelines
Wildlife responds to largely physical characteristics when selecting a habitat.
Nevertheless, three factors,
1. The size of the wetland
2. The relationship of the wetland to other wetlands
3. The level and type of disturbance
will largely determine the effectiveness of a wetland for long-term wildlife use.
Ideally, a wetland designed for wildlife, regardless of whether the design uses
preservation, enhancement, restoration, or creation to achieve its objectives, should
be large enough to support an estimated minimum viable population of the species
of interest. In many cases, establishment of a wildlife community is the objective,
and an indicator species with significant areal requirements should be identified.
The wetland should be large enough to support at least 50, and ideally 500, breeding
individuals, and area requirements can be estimated from knowledge about species
home range sizes.
In most instances, wetlands being designed will be large enough to support
minimum viable populations of only those species with small areal requirements.
For other species, the design should focus on establishment of a metapopulation
through ensuring interpopulation movement. Interpopulation movement can be
Table 2 Suggested Buffer Widths to Reduce the Level of Disturbance to Wetlands
Suggested Buffer (m) Basis Study
Up to 43 Maximum distance sediment
transported from logging road
to streams
Trimble and Sartz (1957)
15–61 Natural control of debris and
sediment accumulation in
streams
Broderson (1973)
15–92 Vegetation interspersion,
wetland size, quality of
surrounding habitat, potential
for impacts
Roman and Good 1985
15–86+ Slope, vegetation, soil
characteristics, value of
wetland, intensity of
development
New Jersey Department of
Environmental Regulation
(1988)
92–122 Water quality maintenance,
public health protection,
wildlife protection
Brady and Buchsbaum (1989)
23–224 Groundwater drawdown,
sediment and turbidity control,
wildlife
Brown et al. (1989)
20–30 Vegetation Dillaha et al. (1989)
75+ Vegetation and soil
characteristics, development
intensity, and type
Potts and Bai (1989)
0–159 Wetland quality, soil type East Central Florida Regional
Planning Council (1991)
©2001 CRC Press LLC
effected for all species by close juxtaposition of individual populations or provision
of habitat corridors. Species with broad habitat tolerances will use a variety of
landscape elements as long as barriers such as roads, waterways, and waterbodies
are avoided. Wetlands for migratory bird species will not require corridors. However,
designers of wetlands for migratory bird species should recognize that sustainability
of a seasonal population is dependent upon one or more wetlands hundreds or even
thousands of kilometers distant.
Wetlands designed to support disturbance intolerant species should limit intru-
sions or protect critical areas during sensitive times of the year. Interior species are
unlikely to thrive in wetlands less than 100 ha in size or to persist in wetlands less
than 10 ha. The establishment of an upland buffer can increase the effective size
of a wetland. Buffers should be established on a case by case basis through con-
sideration of soil type, vegetation type in the buffer, adjacent land use, slope, runoff
particle size, wetland quality, and indigenous wildlife. Nevertheless, a buffer of
approximately 200 m width appears to be adequate in most instances to minimize
direct disturbance to wildlife and to reduce water quality impacts from contaminated
surface runoff. An upland buffer also provides life requisites to many wetland
wildlife species.
MANAGEMENT
Management Approaches
Management of wildlife ranges from passive approaches exemplified by preser-
vation of self-regulating habitat, to semi-active approaches such as the installation
of nest boxes, to active approaches such as impoundments that require periodic
water, soil, and vegetation manipulation. As management schemes become more
active, and intrinsically more complex, monetary and labor costs increase, and the
chances for sustainability and success decrease.
To many, purchase of existing habitat is the only feasible way of protecting
unique areas for bird nesting or migration stopovers (Weller, 1987). In the United
States, this approach is illustrated by the actions of the National Audubon Society,
Ducks Unlimited, The Nature Conservancy, and the U.S. Fish and Wildlife Service.
The latter group has been purchasing Waterfowl Production Areas since the 1960s
in an effort to maintain continental waterfowl populations.
It is vainglorious to expect that managers can improve on the complex dynamic
processes of natural undisturbed wetlands. Active management will, by necessity,
enhance habitat for some species while degrading habitat for other species. Man-
agement may fail because of inadequate or inaccurate information, imprecise water
control, colonization, and modification by nuisance species, or even political or
public pressure to terminate or modify management techniques or goals (Fredrick-
son, 1985). Therefore, it seems reasonable to reserve active management for wetlands
known to be degraded and created wetlands.
Historically, wildlife management overwhelmingly emphasized waterfowl, and
other species were managed incidentally, if at all (Figure 6, Payne, 1992). In large
©2001 CRC Press LLC
part, management was applied to game species (Graul and Miller, 1984). Single
species (or in some cases guild) management typically included prioritization of
wildlife species, determining the requirements of these species, obtaining informa-
tion on local environmental conditions, and determining the wildlife value and
growth requirements of local plants (Chabreck, 1976).
The 1970s gave rise to regulations in the United States that required the man-
agement of wildlife for diversity, as well as to an increased public interest in
managing species other than waterfowl (Rundle and Fredrickson, 1981). Both con-
sumptive and nonconsumptive species were to be preserved (Odom, 1977; Martin,
1979). The Colorado Nongame Act of 1973 required that all native species be
perpetuated, and the 1976 National Forest Management Act required the maintenance
of animal diversity. Managers recognized early that the single species approach was
inadequate for ensuring the maintenance of diversity, and yet it was impossible to
manage for all species (Wagner, 1977).
Graul and Miller (1984) reviewed several approaches to managing for diversity.
The management indicator approach is intended to benefit a featured species. Typ-
ically, this is a game species, but sometimes a threatened or endangered species or
a species of public interest is selected (Gould, 1977). The relationship between the
featured species and other species must be understood to ensure maintenance of
diversity. The ecological indicator approach manages for stenotopic species, species
having a narrow range of adaptability to changes in environmental conditions. The
approach assumes that eurytopic species, species tolerant of wide variation in their
environment, will have their requirements satisfied indirectly (Graul et al., 1976).
Figure 6
Until recently, wildlife management efforts were focused largely on preservation
and creation of waterfowl production areas.
©2001 CRC Press LLC
The habitat diversity approach manages vegetation stand type and age class rather
than individual wildlife species (Siderits and Radtke, 1977). The success of the
approach is sensitive to the size of habitat blocks set aside. Finally, the special
features approach emphasizes habitat features such as snags, edges, perches, etc.
(Graul, 1980). None of these approaches have been tested in any rigorous manner
that would permit determination of their effectiveness. Another approach applicable
to active management, and also untested, is to mimic the soil, hydrology, or vege-
tation of a natural, undisturbed wetland that has the desired species.
Management Techniques
There are a number of techniques used to manage wetlands for wildlife (e.g.,
Weller, 1987; Whitman and Meredith, 1987; Payne, 1992). The majority of these
techniques are directed at managing vegetation. Other techniques are directed at
providing nonvegetative structural requirements such as feeding opportunities and
breeding sites. Selected vegetation management techniques, including burning,
grazing, herbicide application, mechanical manipulation, propagation, and water
level manipulation, are discussed herein. Artificial breeding and loafing sites are
also discussed.
Vegetation Management
Burning
Fires were a naturally occurring event in many palustrine emergent wetlands
prior to mankind's intervention. Fire functioned to eliminate accumulated plant
material and to return nutrients to the soil. Burning has been widely used for marsh
management, particularly in United States Gulf Coast marshes (Hoffpauer, 1968;
Chabreck, 1976; Wright and Bailey, 1982). Wetland wildlife managers use fire to
promote the growth of green shoots, roots, and rhizomes of grasses and sedges that
are then available to foraging geese. Fallen seeds are exposed to ducks, and dead
plant material is eliminated which increases the value of the habitat to ducks,
muskrats (
Ondatra zibethica
), and nutria (
Myocastor coypus
). Burning creates deep
pools and edge for nesting and feeding waterfowl and controls or eliminates unde-
sirable vegetation.
There are three types of burns: cover, root, and peat (Payne, 1992). Cover
(surface, wet) burns are conducted when the water level is at or above the root
horizon and are used to convert monotypic stands of reed (
Phragmites communis
),
cattail
(Typha
spp.), or unproductive sedge to plants that provide food and cover to
nutria, muskrat, duck, and geese. This is accomplished by releasing plants with an
earlier growing season than the undesirable plant species. Root burns are used to
control or eliminate climax vegetation or other plants of low wildlife value. Hotter
than cover burns, root burns are conducted when the soil is dry to a depth of 8 to
15 cm. The roots of undesirable plants are burned, and more desirable plants, which
have roots extending to greater depths, are spared. Peat burns are conducted during
droughts in an effort to convert marsh into aquatic habitat. The fire burns a hole in
©2001 CRC Press LLC
the peat which then fills with water. Peat burns are more common in freshwater
marshes where there is sufficient organic material in the soil to support the fire than
in coastal marshes.
Timing of the burn depends upon the type of burn (cover, root, or peat) and the
intended objective. Patchy late summer cover burns expose insects to migrating
shorebirds (Bradbury, 1938). Root and peat burns at this time of year can be used
to eliminate reed and cattail, and are most effective if reflooding can be accomplished
(Mallik and Wein, 1986). Late summer or early fall cover burning will decrease
muskrat populations by decreasing the availability of den building material (Daiber,
1986). Elimination of undesirable woody vegetation is also accomplished in late
summer or early fall through a root burn (Linde, 1985). Patchy winter cover burns
increase edge and access for waterfowl nesting the following spring and provide for
control of reed and cattail (Ward, 1942; Beule, 1979). Olney threesquare (
Scirpus
olneyi
), American bulrush (
Scirpus americanus
), and saltmarsh bulrush (
Scirpus
robustus
) benefit by late winter cover burning and reflooding of saltmarsh cordgrass
(
Spartina patens
). Spring cover burns will increase muskrat populations by stimu-
lating the production of succulent shoots (Daiber, 1986).
Fires are difficult to direct and extinguish. This is particularly true in bog
wetlands where fires may burn for days or weeks (Payne, 1992). A means for
extinguishing the fire, either an auxiliary water supply that can be sprayed on the
marsh or a means for reflooding, should be provided. Burns should not be conducted
during the waterfowl breeding season because ducklings are particularly susceptible
to fast fires through dead vegetation. Nor should burns be conducted in areas with
a high erosion potential or in drought years unless a root or peat burn is intended.
Burning has some short-term adverse impacts on wetland wildlife. Inevitably,
cover is reduced, forcing ducks to concentrate in unburned areas which increases
their susceptibility to predation. Winter cover is reduced, which has an ancillary
effect of reducing the wetland's ability to trap and retain snowfall. This latter effect
can be significant in precipitation deficit regions (Ward, 1968). Burning also results
in a short-term reduction in the insect prey base (Opler, 1981). These short-term
impacts are overshadowed by the long-term benefits to wildlife.
Grazing
Weller (1987) has suggested that bison grazing on northern prairies may have
benefited certain wildlife species by opening up dense stands of vegetation. Grazing
in wetlands arrests plant community succession and tends to reduce undesirable
perennials and increase annuals (Chabreck et al., 1989). Grazing animals may create
openings in dense vegetation bordering riparian areas (Krueger and Anderson, 1985).
In uplands bordering wetlands, grazing reduces cover for predators and fuel for fires
and inhibits grassland invasion by brush.
Today, cattle are the primary agent for habitat management through grazing,
although sheep, horses, and even muskrat can be effective. Sheep are more easily
controlled than cattle and tend to be more effective at removing undesirable plants
through their close grazing (Ermacoff, 1968). Horses are better at controlling woody
©2001 CRC Press LLC
vegetation (Pederson et al., 1989). Muskrats are very effective at reducing persistent
emergent cover but are very difficult to control (Weller, 1987).
Waterfowl are the primary beneficiaries of controlled grazing, although shore-
birds and furbearers may occasionally benefit. Openings in otherwise impenetrable
cover allow access by nesting ducks. Migrating and wintering waterfowl, especially
snow geese (
Chen caerulescens
), forage on exposed seeds, sprouts stimulated by
grazing, and roots and rhizomes exposed by hoof impacts (Chabreck, 1968; Daiber,
1986). Snipe (
Gallinago gallinago
) concentrate in overgrazed marshes, and upland
sandpiper (
Bartramia longicauda
) are attracted by shorter cover (Chabreck, 1976;
Weller, 1987). O’Neil (1949) has suggested that marshes managed for furbearers be
subjected to grazing.
Grazing intended to improve waterfowl nesting habitat should occur in the winter
or early spring (Rutherford and Snyder, 1983), and no more than 50 percent of the
forage plants should be removed annually (Payne, 1992). To increase the value of
marsh habitat for migratory and wintering waterfowl, grazing may continue through
spring and early summer. Cattle (or other grazing agent) should be excluded July
through September to promote the growth and seed production of annual grasses
and sedges (Chabreck, 1976; Chabreck et al., 1989). The marsh can be flooded in
fall and winter to attract ducks or left unflooded to attract geese.
There are drawbacks to the management of wetlands through grazing in that
management for one guild, waterfowl, inevitably reduces habitat value for other
species such as small birds and mammals. Cattle trample dens and cause underground
tunnels to collapse. Domestic grazers also compete with wildlife herbivores for food.
Overgrazing has more serious consequences in that it negatively impacts habitat for
all wildlife species. Ducks and other waterfowl will not nest or feed in exposed
areas, and overgrazing of riparian areas can destroy the streambank, increase erosion,
and decrease plant vigor.
Herbicide Application
Application of herbicides should, in most instances, be used as a last resort.
Herbicides exhibit lethal and sublethal effects on plants and animals, a problem
exacerbated by the difficulty needed to apply and control their application. Therefore,
application is likely to affect nontarget species, including desired species. Further-
more, some herbicides will persist in the soil and potentially could contaminate
surface water and ground water. In aquatic environments, treatment of large areas
can result in oxygen depletion from decaying plants.
To minimize the potential negative impacts of herbicide application, herbicides
should only be used where other methods are ineffective, treat the smallest area
possible, apply the herbicide when hazards to wildlife are least, and follow the
manufacturer’s instructions. The safest herbicides are organophosphates and carbam-
ates because they persist in the environment for relatively short periods compared
with organochlorine herbicides.
Despite the drawbacks of herbicide use, they can be effective in eliminating or
reducing dense emergent vegetation. Herbicides have successfully been used to
create open water areas in dense marsh vegetation, thus increasing habitat value for
©2001 CRC Press LLC
waterfowl (Weller, 1987; Payne, 1992). Water hyacinth (
Eichornia crassipes
) has,
for the most part, been impossible to control without the use of herbicides. Extensive
efforts have been undertaken along the eastern seaboard of the United States to rid
coastal marshes of common reed and to encourage revegetation with native species
(Jones and Lehman, 1987). Application of herbicide to reed is generally required in
two successive years, with burning off of dead reed following treatment.
Annuals, biennials, and perennials are most easily controlled at the seedling
stage. Summer annuals are best treated in spring, and winter annuals in fall, during
germination. Biennials are most effectively treated as rosettes in the fall. The veg-
etative stage of annuals and perennials is moderately to poorly controlled with
herbicides, and control during seed set is largely ineffective (Hansen et al., 1984).
Aquatic vegetation is best treated when the foliage is above the water and is rain or
dew free (Gangstad, 1986). Herbicides injected into the ground are most effective
when applied in the spring.
Cattail and common reed are treated somewhat differently than other plants.
Existing growth should be cut so that the herbicide can be applied to seedlings. If
cutting is not feasible, a herbicide that will be translocated from the leaves to the
rhizome should be applied to the foliage in the fall immediately prior to senescence.
For the most part, woody perennials can be effectively treated at any time of the
year. Herbicides can be applied to cuts or notches in the trunk or to stumps after
cutting. Herbicides applied to the canopy should occur after the leaves have fully
formed but prior to the development of a heavy cuticle.
Mechanical Management
Mechanical methods of management include blasting, bulldozing, crushing, cut-
ting, disking, draglining, and dredging. These methods are applied to decrease the
density of existing vegetation or to ensure the maintenance of open areas in newly
created or restored habitat. This is achieved by scraping vegetation, deepening basins,
breaking up sod-forming grasses or organic deposits, and retarding woody growth.
The result is the creation of open water areas for feeding and breeding waterfowl
in deeper marshes and for ground-dwelling wildlife in shallow marsh and wet
meadow habitat (Linde, 1985; Weller, 1987; Payne, 1992). Also, mechanical man-
agement is used to prepare newly constructed wetlands or dewatered wetlands for
planting. Prior to management through mechanical methods, an evaluation should
be conducted that compares long-term expected benefits to short-term impacts to
plant and animal communities.
Blasting
Blasting is a relatively inexpensive method for creating openings in dense,
emergent vegetation. It is best applied in mineral soils, when the water level is at
the soil surface to 20 cm below the surface (Hopper, 1971). Historically, dynamite
was used to blast openings, but beginning in the 1960s ammonium nitrate fertilizer
mixed with fuel oil has been used. The latter is approximately 1/10th the cost of
dynamite and much safer to handle.
©2001 CRC Press LLC
Basins created by blasting are generally bowl or cone-shaped with steep sides.
Although blasting is the least expensive way to create open water areas and to
reduce the density of vegetation, there is very little control over the shape and size
of the areas created. Sloughing of the sides will likely occur over the first year or
two following blasting, and basins in organic soils may refill requiring a repeat of
the process.
Bulldozing, Draglining, and Dredging
Bulldozing, draglining, and dredging are used to open up dense marsh by scrap-
ing or basin deepening (Figure 7). To prevent regrowth, basins must be excavated
below the photic zone. The methods can be applied to dewatered impoundments, or
to newly constructed wetlands that have not been flooded, to the benefit of waterfowl
and muskrat (Linde, 1985; Weller, 1987). The abrupt edges and absence of vegetation
which characterize newly constructed basins cause them to appear unnatural for a
few years and will likely be less attractive to water birds (Provost, 1948; Strohmeyer
and Fredrickson, 1967; Weller, 1987).
Bulldozing is the more economical of the methods and allows the most accurate
contouring. It can be effective in dry to moist mineral soils. Draglines are used in
wetter situations and are more difficult to control than a bulldozer. The dragline can
be operated from upland, on mats placed on the wetland, or on a frozen surface
during winter in temperate regions. Dredging is the most costly of the methods and
is generally impractical except for very large projects.
Figure 7
Bulldozers can be used to open up dense vegetation or create new basins.
©2001 CRC Press LLC
Crushing
Crushing is an effective method for creating openings in dense, persistent emer-
gent vegetation such as cattail and common reed. It is most effective when treatment
takes advantage of the plant’s natural carbohydrate translocation cycle (Beule, 1979).
Carbohydrate reserves stored in the rhizome are used in the spring to produce new
leaves. When fully formed, the new leaves will replace the drawn-down reserves by
translocating the products of photosynthesis. Crushing of the new leaves when they
are nearly fully formed interrupts the cycle and rhizome reserves are depleted.
Regrowth will be stunted or precluded. Successive annual treatments are generally
sufficient to permit establishment of more desirable plant species from the seed bank
or from planting or seeding.
Cutting
Plants vary in their response to cutting. For example, cattail abundance is gen-
erally decreased by cutting, especially successive annual cutting. By contrast, marsh
smartweed (
Polygonum coccineum
) appears to tolerate and, perhaps, even to be
stimulated by cutting (Pederson et al., 1989).
Cutting is effective because rhizomes are dependent upon oxygen which is
supplied to the rhizomes by way of aerenchyma in the leaves. If the leaves are cut,
and the substrate remains inundated, oxygen flow to the rhizomes is cut off and the
plant will die (Laing, 1941). An effective strategy is to cut the leaves as close to the
ground surface as possible in the fall or winter. In colder climates, the leaves can
be on ice. Cutting success can be improved by inundating the stubble to a depth of
10 to 20 cm and repeating the operation for 2 or 3 consecutive years.
Disking
Disking is used to break up sod-forming grasses too dense to be used by ground-
dwelling wildlife. Also, disking helps to prevent growth of woody vegetation, retards
filling in of wetlands by breaking up organic deposits, prepares new marsh for
planting by breaking up sod and peat, and aerates dewatered soils thereby stimulating
plant growth upon reflooding (Griffith, 1948; Burger, 1973). The technique is most
effective if repeated every 3 to 4 years. Disking is largely ineffective for control of
cattail and other plants with rhizomes due to resprouting (Payne, 1992).
Managers of marshes in the southeastern United States use disking to stimulate
the growth of Asiatic dayflower (
Aneilema keisak
) which is a valuable duck food.
Disking occurs in February or March. Fall disking creates habitat for common snipe
(
Gallinago gallinago
).
Propagation
Propagation of wetland plants was relatively common in the 1940s, and was
used primarily to establish emergents and marsh edge species (Linduska, 1964). The
technique has experienced a revival of sorts with the advent of wetlands mitigation.