Báo cáo nghiên cứu khoa học: " EXPERIMENTAL AND THEORETICAL ANALYSIS OF A CRITICAL CHEMICAL REACTION: DECOMPOSITION OF HYDROGEN PEROXIDE (H2O2)" potx
Bạn đang xem bản rút gọn của tài liệu. Xem và tải ngay bản đầy đủ của tài liệu tại đây (435.83 KB, 9 trang )
Science & Technology Development, Vol 11, No.08 - 2008
Trang 28
EXPERIMENTAL AND THEORETICAL ANALYSIS OF A CRITICAL
CHEMICAL REACTION: DECOMPOSITION OF HYDROGEN PEROXIDE
(H
2
O
2
)
Mai Thanh Phong
(1)
, Carolina de Barros Aires
(2)
(1)University of Technology, VNU-HCM
(2)O-v-G Magdeburg University, Germany
(Manuscript Received on January 10
th
, 2008, Manuscript Revised May 12
th
, 2008)
ABSTRACT: The decomposition of hydrogen peroxide was studied using a reaction
calorimeter.The solution of Iron (III) Nitrate was used as a homogeneous catalyst. The
reaction rate was quantified from the course of the heat flux due to reaction measured during
the experiments. To this end, the reaction rate was modeled as: a) a first order reaction, and
b) an “m
th
” order reaction. The studies showed that the obtained results based on the
assumption of a first order reaction were not good as expected, while the model based on
“m
th
” order kinetics provided much better results and the experimental data could be well
described.
1. INTRODUCTION
The main role of hydrogen peroxide in the actual industry and the versatility that this
compound presents to be used as an intermediate in many processes and also the use of
hydrogen peroxide in the remediation of soils and wastewater treatment is one of the
motivations for this work.
The catalyzed decomposition of the hydrogen peroxide is a subject of study to many
researchers around the world. There have been several researches on the decomposition
catalyzed by iron compounds. Chou and Huang [1] studied this decomposition catalyzed by
iron oxide in a fluidized bed reactor. Lin and Gurol [2] studied the effects of goethite as a
catalyst to the same reaction. De Laat and Gallard [3] investigated the kinetics of the
homogeneous decomposition by ferric ion. All the studies cited the importance of this reaction
especially to the wastewater treatment. Several models that describe the kinetics of reaction
were previously presented.
This work intends to analyze the kinetics of the homogeneously catalyzed decomposition
of hydrogen peroxide with ions of iron (III) using data from the heat released during the
reaction, obtained by the use of reaction calorimetry. The possibility of using the heat flux data
to obtain kinetic parameters lies in the energy balance that connects kinetics with the energy
content of the substances.
2. THEORY
2.1. Decomposition of hydrogen peroxide
Hydrogen peroxide decomposes into water and oxygen through a disproportionation
reaction:
2222
2
1
OOHOH +⎯→⎯
(1)
TẠP CHÍ PHÁT TRIỂN KH&CN, TẬP 11, SỐ 08 - 2008
Trang 29
The homogeneous decomposition catalyzed by metal ions in a low oxidation state occurs
via typical free radicals reactions. The most used ions are ferrous and cuprous. The mechanism
of decomposition with ferrous ion is known as the Haber – Weiss Cycle [4]:
HOOH + Fe2+ → Fe3+ + OH- + ·OH
HOOH + Fe3+ → Fe2+ + H+ + ·OOH (2)
·OOH → O2 + ·H
2 H
2
O
2
⎯⎯⎯→⎯
++ 32
/ FeFe
O
2
+ 2 H
2
O
The solution with hydrogen peroxide and ferrous ions is known as Fenton’s reagent and is
used for the initiation of polymerizations, hydroxylation of aromatic derivatives and oxidative
couplings, among others [4].
The decomposition of hydrogen peroxide is a very exothermic reaction as already
presented. The heat released is sufficient to vaporize the water in the solution what makes the
concentration of peroxide rise until a point at which the decomposition becomes autocatalytic,
or in other words, self-sustainable [4]. This high amount of heat released makes the processes,
in which hydrogen peroxide is used as an auxiliary, more difficult regarding safety aspects.
2.2. Kinetics of the decomposition of hydrogen peroxide
In the case of the decomposition of hydrogen peroxide, the reaction is regarded as
irreversible, since one of the products is gaseous oxygen and it can not react back because it
leaves the aqueous phase of the reaction. Taking equation (1) that represents such
decomposition, the reaction rate would be formulated as:
22
OH
kCr =
(3)
Since in equation (3), the power of the hydrogen peroxide concentration is equal to one,
this equation for the reaction rate describes a kinetic of first order for this decomposition.
Assuming that the reaction is not elementary and that it is not first order with respect to the
concentration of hydrogen peroxide, the rate equation for this decomposition would be:
m
OH
kCr
22
=
(4)
Equation (4) is a more general and describes an “mth” order reaction. It resumes to
equation (3) when “m” is equal to unity.
In the case of a pseudo-first order, some attempts to clarify the influences of pH and the
concentration of catalyst that are grouped in the kinetic constant were made. A model for a
pseudo-first order kinetics with such parameters in an explicit way was presented in [5] as:
22
01.0
,
OH
H
initcat
C
C
C
kr
+
=
+
(5)
2.3. Mass and energy balances
In this work, a reaction calorimeter containing a homogeneous reaction mixture was
employed. To describe the development of heat fluxes due to reaction in the reaction
calorimeter, a mathematical model was used as described below.
For the continuous stirred tank reactor (CSTR), it is assumed an ideal mixing condition.
This means that the composition in any point of the reactor is equal and so the properties of the
mixture inside the reactor are the same as in the outflow.
With the characteristics above, the mass balance with a “mth” order kinetics is:
Science & Technology Development, Vol 11, No.08 - 2008
Trang 30
r
m
OHOHoutinOHin
r
OH
OH
r
VkCCVCV
dt
Vd
C
dt
Cd
V
22222222
22
,
)(
)(
−−=+
&&
(6)
Assuming that Vr is constant (
in
V
&
=
out
V
&
and ρ=constant) and rearranging the equation
above, a new variable appears. It is the division of the volumetric inflow,
V
&
, by the volume of
the reactor, Vr, and this is equivalent to 1/τ, where τ represents the residence time for the
reactor. This residence time can be taken as the average time that the mass going into the
reactor stays inside and for the assumption that Vr is constant, τ is also a constant.
m
OH
OHinOHOH
kC
CC
dt
dC
22
222222
,
−
−
=
τ
(7)
Initial conditions at t = 0: CH2O2 = CH2O2, init, Vr = Vr,init,
in
V
&
=
out
V
&
The variation of the concentration with time happens only during the time that the steady
state is not reached or when problems force the reactor out of the steady state. Otherwise, the
steady state is followed and the differential term with respect to time is equal to zero. For a
first order kinetics (m=1), the solution for this case can be done analytically. But with an
“mth” order kinetics, the solution can only be done numerically.
For the energy balance, the same assumptions used to develop the mass balance hold.
Also, it is assumed that there is no change in kinetics and potential energies, and that all heat
fluxes and the shaft work are zero except for the heat fluxes respective to the reaction and to
the cooling.
coolingreactionoutoutinin
r
QQHVHV
dt
HVd
&&
&&
−+−=
ρρ
ρ
)(
(8)
Furthermore, the enthalpy is a function of the composition, temperature and pressure, but
primarily temperature [6]. So, it can be written as the product of the temperature of the system,
Tr, and the average heat capacity at constant pressure of the system, Cp.
rp
TCH =
(9)
It is possible to define also some equations for the heat flux. The most important heat
fluxes here are the heat flux of the reaction,
Q
&
reaction, and the heat flux of cooling,
Q
&
cooling. They are defined as:
rreactionreaction
rVHQ Δ=
&
(10)
)(
jrcooling
TTUAQ −=
&
(11)
where: Tr is the temperature in the reactor; Tj is the temperature in the cooling system
(jacket); A is the area of heat transfer; U is the overall coefficient for heat transfer of the
system.
Substituting equations (9), (10) and (11), equation (8) is rearranged as the energy balance
for the CSTR following a “mth” order kinetics:
rp
jr
p
m
OHreaction
rinr
r
VC
TTUA
C
kCH
TT
dt
dT
ρρτ
)(
)(
22
,
−
−
Δ
+
−
=
(12)
TẠP CHÍ PHÁT TRIỂN KH&CN, TẬP 11, SỐ 08 - 2008
Trang 31
Initial conditions at t = 0: CH2O2 = CH2O2, init, Vr = Vr,init, Tr = Tr,init, Tj = Tj,init.
2.4. Free parameters estimation
In this study, Matlab is the program used to solve numerically mass and energy balances
and for the optimization of the kinetic parameters of reaction. The error function to be
optimized is given by equation (13):
∑
=
••
−
−
=
M
i
i
reaction
i
M
OF
1
2
exp
)(
2
1
(13)
The concentration profile inside the reactor is used to calculate the reaction rate, r, using
the same kinetics used to solve the mass balance. The reaction rate is then used to calculate the
heat flux of reaction,
Q
&
reaction, according to equation (10) giving the theoretical heat
calculated. The heat calculated is fitted to the experimental data,
Q
&
exp. The error must be as
close to zero as possible so that the best values for the free parameters are obtained.
3. EXPERIMENTAL SECTION
3.1. Equipment
To quantify heat effects related to the course of the reactions, a commercially available
reaction calorimeter was used (RC1, Mettler-Toledo). The double-jacketed reactor (AP01)
allowed for the analysis of volumes between 0.5 and 2 L. The stirrer speed could be varied
between 30 and 850 rpm. Both the jacket temperature, Tj, and the temperature of the reactor
contents, Tr, could be measured precisely. This allowed for the calculation of the heat flux
through the reactor wall. In this study, the isothermal mode was applied to perform
experiments, i.e., Tr was kept constant.
3.2. Procedures
The conditions for the six experiments performed are summarized in table (1). The
influences of hydrogen peroxide and catalyst concentration and of the initial temperature of the
reactor on the reaction rate and the heat flow behavior were evaluated.
The hydrogen peroxide solution used was a 30% mass from Merck. The original solution
was weighted and afterwards diluted to give the concentrations in table 1. The pH of the
solution was adjusted with the addition of nitric acid, from Fluka (65 vol.%). The solution of
Iron(III) Nitrate was made with the Iron(III)-nitrate nonahydrate from Merck (more than 98%
pure).An experiment run was started with the solution of hydrogen peroxide in the reactor. The
solution of ferric nitrate was added slowly in a semi-batch mode through the dosing pump and
the addition was controlled by the computer in terms of mass. The dosing period was fixed at
30 minutes (1800 seconds) for all experiments.
Table 1. Parameters for reaction calorimetry experiments
Exp. Conc. H
2
O
2
(mol/L)
C
H2O2, in
Vol.
(L)
pH Catalyst
Dosing
rate
(g/min)
Amount of
Catalyst dosed
T
r
(°C)
Stirre
r
Speed
(rpm)
1 2 1 0.84 3 90g at 0.5M 20 200
2 2 1 0.84 1.5 45g at 0.5M 20 200
3 1 1 0.84 3 90g at 0.5M 20 200
Science & Technology Development, Vol 11, No.08 - 2008
Trang 32
4 2 1 0.84 3 90g at 0.5M 15 200
5 2 1 0.84 1.5 45g at 0.5M 15 200
6 1 1 0.84 3 90g at 0.5M 15 200
4. RESULTS AND DISCUSSION
4.1. Estimation of kinetic parameters – assumption of first order kinetics (m=1)
The extraction of the reaction rate constant, k, out of the heat data from experiments was
done by an algorithm written in Matlab comparing the results from the experiment with the
calorimeter and the calculated heat that should be evolved, with equations previously
presented. The first approach to estimate the kinetic parameters was done with the assumption
that the kinetics of the hydrogen peroxide decomposition was first order regarding the
concentration of hydrogen peroxide.
With a first order reaction, the only free parameter to be estimated in the model is k, since
the order of reaction, m, is set to 1. To the extraction of a value for k, equation (5) [5], was
used. This equation was used because of the explicit influence of pH and catalyst
concentration to the kinetics of the reaction.
The values of the optimized reaction rate constant, k, and the values of the objective
function, OF [equation (13)], for all experiments are presented in table 2. The closer this value
is to zero, the better the optimization. This table also gives the value of kwirges previously
reported by Wirges [5] for comparison.
Table 2. Values of k for the experiments performed assuming first order kinetics
Exp. T [°C] OF k x 10
4
[s-1] k
wirges
[5] x10
4
[s-1]
1 3.75886 39
2 1.86852 43
3
20
0.911788 47
3.624
4 3.11636 15
5 0.45964 7.49
6
15
0.814421 6.65
1.715
Since the reaction rate constant is a function only of temperature, its value should not
present great variation. It is possible to see that the values that present the biggest difference
are the ones for experiments 1 and 4. These were also the experiments that present the worst
optimization results. The values for the amount of catalyst added and for the concentration of
hydrogen peroxide were the highest values used during the experiments. The best result was
obtained in experiment 5.
Taking the other two experiments for each temperature, the difference between the values
obtained was not significant. In fact, the difference between k from experiment 3 to 2 was
9.3%. The k for experiment 5 was 12.6% higher than k from experiment 6. However,
comparing the values of k to the calculated values, kwirges, the differences were significant.
The mean value for k from experiments 2 and 3 was 0.0045. This value was almost 12.5
times higher than the value of kwirges. For experiments 5 and 6, the mean value was 0.000707
and it was 4 times higher than kwirges. Experiments 1 and 4 were not taken into consideration,
because the values obtained for k were very different from the other two correspondent
experiments.
TẠP CHÍ PHÁT TRIỂN KH&CN, TẬP 11, SỐ 08 - 2008
Trang 33
4.2. Estimation of kinetic parameters – assumption of mth order kinetics
The experimental data was analyzed with an “mth” order kinetics since the results obtained
with a first order kinetics could not describe the experimental data.
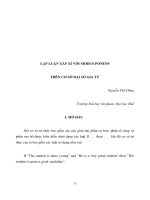
The results for the optimization for all experiments are presented in Figure 1. It can be
seen that the calculated and measured heat flows were in very good agreement for the “mth”
order reaction for all experiments.
The parameters obtained from the optimization are summarized in Table 3. The table also
presents the error for the optimization, OF, equation (13).
Table 3. Values of k and m for the experiments performed assuming "m
th
" order kinetics.
Exp. T [°C] OF m k x 10
4
k
wirges
x 10
4
1 0.3298 0.761 5.61
2 0.1878 0.714 4.46
3
20
0.1796 0.945 8.18
3.624
4 0.1406 0.666 2.84
5 0.0839 0.640 1.18
6
15
0.0817 0.767 2.12
1.715
It can be seen from Figure 1 and Table 3 that the values of k present a clear variance even
with a better optimization result.
The values of k for the experiments 1 to 3 were bigger than the others, since for these
experiments the temperature was higher. The maximal difference between the values has a
factor of 2. The difference between the values of k and kwirges was not as big as the one
found when assuming first order reaction. The maximal difference was seen for experiment 3
with k value around 2 times higher than kwirges.
For experiments 4 to 6, the values of k were lower since the temperature was decreased in
comparison to experiments 1 to 3. The maximal difference between the values of k has a factor
of 3. Also the difference between the values of k and kwirges was not as big as for the first
order kinetics. The biggest difference was found in experiment 4 with k value around 1.5 times
higher than kwirges.
The values obtained for m presented a variation going from 0.64 to 0.945. The highest
value was obtained for experiment 3. This is the value closest to one, what would mean a first
order kinetics. As seen in the previous results, experiment 3 is indeed the one that is closest to
the behavior of a first order kinetics.
All other experiments presented a noticeable deviation from the first order kinetics. The
values for m for these experiments were not very different.
Science & Technology Development, Vol 11, No.08 - 2008
Trang 34
Figure 1. Optimizations for the extraction of k according to m
th
order kinetics – measured data: solid
line; caculation: squares
5. SUMMARY AND CONCLUSIONS
The main objective of this study is the estimation of the kinetics for the decomposition of
hydrogen peroxide catalyzed by ferric iron using heat flux data measured with a reaction
calorimeter. This approach to kinetics study was based on the coupling of the reaction rate
with mass and energy balances.
The heat data obtained from the reaction calorimetry were fitted to a mathematical model
based on mass and energy balances for a batch reactor coupled by the reaction rate equation.
This reaction rate was modeled as: a) a first order reaction, and b) an “mth” order reaction.
0 2000 4000 6000 8000
-60
-50
-40
-30
-20
-10
0
Heat Flow [J/s]
Time [s]
Exp.1
k= 0.0006
m= 0.7608
0 2000 4000 6000 8000
-60
-50
-40
-30
-20
-10
0
Heat Flow [J/s]
Time [s]
Exp.2
k= 0.0004
m= 0.7144
0 2000 4000 6000 8000
-40
-30
-20
-10
0
Heat Flow [J/s]
Time [s]
Exp.3
k= 0.0008
m= 0.9449
0 2000 4000 6000 8000 10000 12000
-40
-30
-20
-10
0
Heat Flow [J/s]
Time [s]
Exp.4
k= 0.0003
m= 0.666
0 5000 10000 15000 20000 25000
-16
-14
-12
-10
-8
-6
-4
-2
0
2
Heat Flow [J/s]
Time [s]
Exp.5
k= 0.0001
m= 0.6403
0 2000 4000 6000 8000 10000 12000 14000
-14
-12
-10
-8
-6
-4
-2
0
2
Heat Flow [J/s]
Time [s]
Exp.6
k= 0.0002
m= 0.767
TẠP CHÍ PHÁT TRIỂN KH&CN, TẬP 11, SỐ 08 - 2008
Trang 35
Matlab was used to solve the model equations and to compare predictions to experimental
data in order to estimate the reaction rate constant, k, and the order of the reaction, m.
The application of reaction calorimetry to obtain kinetic data from reactions was found to
be a very good approach. It can give a good understanding about the kinetics of the reaction
based on simple experiments, without the need of constant sampling and subsequent
concentration analysis.
The optimization results based on the assumption of a first order reaction were not good as
expected. All rate models for the decomposition of hydrogen peroxide found in the literature
were based in a first or pseudo-first order reaction with respect to the concentration of
hydrogen peroxide. In this study, this behavior was not confirmed. In most articles previously
published, the concentrations were not as high as the ones used in this study. Most of the
works in the literature focused on the use of hydrogen peroxide for the remediation of
wastewater and the concentrations were very low (in the order of 10-3 mol/L). In the present
work, the conditions were different, the mechanism of reaction might have changed and the
model based on a first order kinetics could not describe the experimental data properly.
The model based on “mth” order kinetics provided significantly better results and the
experimental data could be well described. All orders estimated for the experiments were
below 1, but there were significant differences between the individual experiments.
With a “mth” order kinetics, the values obtained for k were not constant for the same
temperature. Differences of a factor of 2 for 20°C and of 3 for 15°C between the values
obtained were found. Nevertheless, the average value for k at each temperature was very close
to the calculated value based on Arrhenius equation with the parameters previously reported
by Wirges [5].
The extraction of kinetic parameters from measured heat flux data was successful and
proved that the use of such approach is possible.
NGHIÊN CỨU PHẢN ỨNG HÓA HỌC TỚI HẠN: PHẢN ỨNG PHÂN HỦY
HYDRÔ PERÔXÍT (H
2
O
2
)
Mai Thanh Phong
(1)
, Carolina de Barros Aires
(2)
(1) Trường Đại học Bách khoa, ĐHQG-HCM
(2)O-v-G Magdeburg University, Germany
TÓM TẮT: Phản ứng phân hủy hydro preroxit đã được nghiên cứu bằng thiết bị đo hiệu
ứng nhiệt của phản ứng (calorimeter). Xúc tác được dùng trong nghiên cứu này là dung dịch
Nitrate sắt (3). Vận tốc phản ứng đã được xác định từ dòng hiệu ứng nhiệt của phản ứng đo
được bằng thực nghiệm. Để xác định hằng số
phản ứng, vận tốc phản ứng được mô phỏng
theo hai trường hợp: a) phản ứng bậc 1 và b) phản ứng bậc m. Các nghiên cứu cho thấy rằng,
kết quả thu được khi giả thiết phản ứng bậc một không tốt, trong khi đó mô hình vận tốc phản
ứng dựa trên phản ứng bậc m cho kết quả tốt hơn rất nhiều và nó có thể mô phỏng chính xác
kết quả thự
c nghiệm.
Science & Technology Development, Vol 11, No.08 - 2008
Trang 36
REFERENCES
[1].
Chou, S. Huang, C. Decomposition of hydrogen peroxide in catalytic fluidized-bed
reactor, Applied Catalysis, vol. A: General 185, pgs. 237 – 245, (1999).
[2].
Lin, S. Gurol, M.D. Catalytic Decomposition of Hydrogen Peroxide on Iron Oxide:
Kinetics, Mechanism and Implications, Environmental Science and Technology, vol.
32, 1417 – 1423, (1998).
[3].
De Laat, J. Gallard, H, Catalytic Decomposition of Hydrogen Peroxide by Fe (III) in
Homogeneous Aqueous Solution: Mechanism and Kinetic Modelling, Environmental
Science and Technology, vol. 33, pgs. 2726 – 2732, (1999).
[4].
Schirmann, J.P, Delavarenne, S.Y. Hydrogen Peroxide in Organic Chemistry. France,
S.E.T.E, (1979).
[5].
Wirges, H.P. Chemische Oszillationen im gekühlten kontinuierlichen Rührkessel,
Verfahrenstechnik, vol. 17, pgs. 489 – 497, (1983).
[6].
Luyben, W.L. Process Modeling, Simulation, and Control for Chemical Engineers.
New York, McGraw-Hill, 2nd edition, (1990).