New SAT Math Workbook Episode 2 part 7 doc
Bạn đang xem bản rút gọn của tài liệu. Xem và tải ngay bản đầy đủ của tài liệu tại đây (305.05 KB, 20 trang )
Additional Geometry Topics, Data Analysis, and Probability
Solution:
The correct answer is (A). For each line, formulate its equation by determining slope (m), then yintercept (b). For the pairs (0,2) and (2,0):
y=
( )x + b
0− 2
2− 0
(slope = −1)
0 = −2 + b
2=b
The equation for the line is y = –x + 2. For the pairs (–2,–1) and (2,1):
y=
(
1− ( −1)
2− ( −2 )
) x + b (slope =
1
)
2
1 = 12 (2) + b
0=b
The equation for the line is y =
substitution. For example:
1
2
3
2
1
2
x. To find the point of intersection, solve for x and y by
x = −x + 2
x=2
x=
y=
4
3
2
3
The point of intersection is defined by the coordinate pair ( 43 , 23 ).
Example:
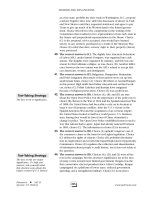
Referring to the xy-plane above, if the scales on both axes are the same, which of the following
could be the equation of line P ?
5
2
(A)
y= 5x– 2
(B)
y=–2x+ 2
(C)
y= 2x– 2
(D)
y= 5x+ 5
(E)
y=–2x– 2
5
5
5
5
2
2
5
5
Solution:
The correct answer is (E). Notice that line P slopes downward from left to right at an angle greater
than 45°. Thus, the line’s slope (m in the equation y = mx + b) < –1. Also notice that line P crosses
the y-axis at a negative y-value (that is, below the x-axis). That is, the line’s y-intercept (b in the
equation y = mx + b) is negative. Only choice (E) provides an equation that meets both conditions.
www.petersons.com
285
286
Chapter 16
Exercise 3
Work out each problem. Circle the letter that appears before your answer.
1.
2.
3.
In the xy-plane, what is the slope of the line
described by the equation 2y = –9 ?
4.
9
(A)
–2
(B)
–9
(C)
0
(D)
9
2
(E)
The slope is undefined.
Referring to the xy-plane below, if the scales on
both axes are the same, which of the following
could be the equation of line P ?
2
In the xy-plane, what is the slope of a line that
contains the points (–1,4) and (3,–6)?
5
2
(A)
−
(C)
–2
(B)
−
(D)
(E)
1
2
1
2
In the xy-plane, what is the equation of the line
with slope 3, if the line contains the point
defined by the xy-coordinate pair (–3,3)?
(A) y = 3x – 3
(B) y = 3x + 12
(C) y = x + 6
(D) y = –3x – 12
(E) y = 6x – 6
www.petersons.com
5.
2
(A)
y= 3x–6
(B)
y= 2x–6
(C)
y=–2x+6
(D)
y= 3x+6
(E)
y=–3x–6
3
3
2
2
What is the equation of the line that is the
perpendicular bisector of the line segment
connecting points (4,–2) and (–3,5) in the xyplane?
3
2
(A)
y = –x +
(B)
y=x+
(C)
y=
(D)
(E)
y = –x + 2
y=x+1
1
2
3
x–1
2
Additional Geometry Topics, Data Analysis, and Probability
4. GRAPHS OF FUNCTIONS AND OTHER
EQUATIONS—FEATURES AND TRANSFORMATIONS
On the new SAT, a question might show a graph of a quadratic function or other equation in the xy-plane, and then
ask you to identify or recognize certain features of the graph—for example, minimum or maximum points on the
graph. You might encounter the graph of a circle, an ellipse, a parabola, or even a trigonometric function (appearing
as a wave). To answer these questions, you do not need to know the equations that define such graphs; simply apply
your knowledge of the xy-coordinate system and, for some questions, function notation (see Chapter 15).
Example:
The figure above shows the graph of a certain equation in the xy-plane. The graph is a circle with
center O and circumference 6π. At how many different values of y does x = –7.5 ?
(A)
0
(B)
1
(C)
2
(D)
4
(E)
Infinitely many
Solution:
The correct answer is (C). First, find the circle’s radius from its circumference: C = 6π = 2πr; r = 3.
Since the circle’s center (0) lies at (–5,–6), the minimum value in the domain of x is –8. In other
words, the left-most point along the circle’s circumference is at (–8,–6), 3 units to the left of O.
Thus, the graph of x = –7.5, which is a vertical line passing through (–7.5, 0), intersects the circle at
exactly two points. That is, when x = –7.5, there are two different corresponding values of y.
Other questions on the new SAT will involve transformations of linear and quadratic functions and the effect
of transformations on the graphs of such functions. The function f(x) is transformed by substituting an expression
containing the variable x for x in the function — for example:
If f(x) = 2x, then f(x + 1) = 2(x + 1), or 2x + 2
Transforming a function alters the graph of the function in the xy-plane. The effect of a transformation might
be any of the following:
* To move, or translate, the graph (either vertically, horizontally, or both) to another position in the plane
* To alter the slope of a line (in the case of a linear function)
* To alter the shape of a curve (in the case of a quadratic function)
www.petersons.com
287
288
Chapter 16
For example, if f(x) = x, then f(x + 1) = x + 1. In the xy-plane, the graph of f(x) = x (or y = x), is a line with slope
1 passing through the origin (0,0). The effect of transforming f(x) to f(x + 1) on the graph of f(x) is the translation
of the line one unit upward. (The y-intercept becomes 1 instead of 0.) Remember: In determining the graph of a
function in the xy-plane, use y to signify f(x) and, conversely, use x to signify f(y).
Example:
If f(x) = x + 3, then the line shown in the xy-plane above is the graph of
(A)
f(x)
(B)
f(x – 6)
(C)
f(x + 6)
(D)
f(x + 3)
(E)
f(x – 3)
Solution:
The correct answer is (E). The figure shows the graph of the function f(x) = x (or y = x). To
determine which of the five answer choices transforms the original function f(x) = x + 3 to the
function f(x) = x, substitute the variable expression in each choice, in turn, for x in the original
function. Choice (E) is the only one that provides an expression that achieves this transformation:
f ( x − 3) = ( x − 3) + 3
f ( x − 3) = x
y=x
To help you determine the effect of a function’s transformation on the function’s graph, you can tabulate some
(x,y) pairs based on the new function, plot the points on the xy-plane, and then connect them.
www.petersons.com
Additional Geometry Topics, Data Analysis, and Probability
Example:
If f(x) = x2, then the graph shown in the xy-plane above best represents which of the following
functions?
(A)
f(–x)
(B)
f(x – 1)
(C)
f(x + 1)
(D)
f(x2 + 1)
(E)
f(x2 – 1)
Solution:
The correct answer is (B). The figure shows the graph of y = x2, but translated to the right.
Substitute the variable expression given in each answer choice, in turn, for x in the function f(x) =
x2. Performing this task for choice (B) yields the equation f(x) = (x – 1)2, or y = (x – 1)2. Identify and
plot some (x,y) pairs. (Since the vertex in the graph lies along the x-axis, let x = 0 in order to
establish the vertex’s coordinates.) Here are some (x,y) pairs for the equation y = (x – 1)2 :
(0,1)(1,0), (2,1), (3,4), (–1,4)
Plotting these points in the xy-plane reveals a graph whose key features match those of the figure
provided in the question.
www.petersons.com
289
290
Chapter 16
Exercise 4
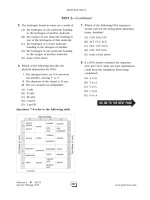
Work out each problem. Question 1 is a grid-in question. For questions 2–5, circle the letter that appears before
your answer.
1.
The figure below shows a portion of the graph
of a certain function in the xy-plane. For the
portion shown, at how many different values of
x is | f(x)| at its maximum value?
3.
If f(x) = 2x – 2, then which of the following is
the graph of f
(A)
(B)
2.
If f(x) = 2, then the line shown in the xy-plane
below is the graph of
(C)
(D)
(A)
(B)
(C)
(D)
(E)
f(x + 1)
f(x – 1)
f(x + 2)
f(x – 2)
All of the above
(E)
www.petersons.com
( )?
x−2
2
Additional Geometry Topics, Data Analysis, and Probability
4.
If f(x) = (x – 1)2 + 1, what is the y-intercept of
the graph of f(x+ 1) in the xy-plane?
(A) –2
(B) –1
(C) 0
(D) 1
(E) 2
5.
If f(y) = –(y2 + 1), then the graph shown in the
xy-plane below best represents which of the
following functions?
(A)
(B)
(C)
(D)
(E)
f(–y)
f(y + 1)
f(y – 1)
f(y – 2)
f(y2 – 2)
www.petersons.com
291
292
Chapter 16
5. DATA ANALYSIS
The new SAT includes questions involving the analysis of data displayed in graphical formats such as tables, pie
graphs, line charts, bar graphs, and scatter plots. To answer a data-analysis question, you’ll need to:
* Understand how the data are displayed
* Know which data are relevant to the question
* Know how to process the relevant data to solve the problem (answer the question correctly)
A data analysis question might require a simple arithmetic calculation (addition or subtraction) and/or a simple
calculation of a percent, average, fraction, or ratio.
In handling SAT data analysis, be careful to read the question very carefully, so that you select the appropriate
graphical data and perform the appropriate calculation — one that yields the answer to the precise question being
asked. In analyzing a line chart, bar graph, or scatter plot (see the examples below), estimating number values in
the display will suffice to answer the question correctly. To answer any data analysis question asking for an
approximation, rounding off your calculations will suffice.
Example (Table):
According to the table above, of the total number of automobiles sold to U.S. and foreign
institutions during the 2002–03 model year, which of the following most closely approximates the
percent that were standard models?
(A)
24%
(B)
36%
(C)
41%
(D)
59%
(E)
68%
Solution:
The correct answer is (D). The total number of units sold to institutions = (3.6 + 8.5 + 1.9) +
(1.7 + 4.9 + 2.2) = 22.8. The number of these units that were standard models = (8.5 + 4.9) = 13.4.
To answer the question, divide 13.4 by 22.8 (round off the quotient): 22.8 ÷ 13.4 ≈ .59, or 59%.
www.petersons.com
Additional Geometry Topics, Data Analysis, and Probability
Example (Pie Graph):
Based on the data shown above, the combined area of Unit B and Unit D is approximately
(A)
51,000 square feet
(B)
57,500 square feet
(C)
70,000 square feet
(D)
74,500 square feet
(E)
108,000 square feet
Solution:
The correct answer is (D). The size of Unit B is 42% of 140,000 square feet, or about 59,000 square
feet. Thus, the combined size of Unit B and Unit D is approximately 74,500 square feet.
Example (Line Chart):
Referring to the graph above, approximately what was the greatest dollar amount by which the
share price of ABC common stock exceeded the share price of XYZ common stock at the same time
during year X?
(A)
$1.80
(B)
$2.60
(C)
$3.00
(D)
$3.60
(E)
It cannot be determined from the information given.
www.petersons.com
293
294
Chapter 16
Solution:
The correct answer is (B). You’re looking for the point at which the dotted line (ABC’s stock price)
is furthest above the solid line (XYZ’s stock price). The dotted line lies above the solid line only
during the second half of the 2nd quarter and the first half of the 3rd quarter; the end of the 2nd
quarter marks the greatest difference between prices during that period. At that time, ABC stock
was priced at approximately $7.60, while XYZ stock was priced at approximately $5.00 per share.
The difference between those two prices is $2.60.
Example (Bar Graph):
Referring to the data shown above, what is the approximate ratio of the average number of hours
per week that the youngest age group spent watching entertainment to the average number of hours
that the other two groups combined spent watching entertainment?
(A)
3:4
(B)
1:1
(C)
6:5
(D)
5:3
(E)
5:2
Solution:
The correct answer is (D). You’re task here is to compare the size of the entertainment portion of
the left-hand bar to the combined sizes of the same portion of the other to bars. Size up the ratio
visually. The portion on the first chart is a bit larger than the other two combined, and so you’re
looking for a ratio that’s greater than 1:1. Approximate the height of each three portions:
13–18 age group: 25 hours
19–24 age group: 5 hours
25–30 age group: 10 hours
The ratio in question is 25:15, or 5:3.
www.petersons.com
Additional Geometry Topics, Data Analysis, and Probability
Example (Scatter Plot):
Companies A, B, C, D, and E all manufacturer and sell a similar product. The graph above
compares manufacturing costs and sales prices per unit among the five companies. If all five
companies have sold the same number of units, which company has earned the greatest profit from
those sales?
(A)
A
(B)
B
(C)
C
(D)
D
(E)
E
Solution:
The correct answer is (E). Since the number of units sold was the same for all five companies, the
greatest profit was earned by the company with the highest price-to-cost ratio. You can compare
ratios by drawing a line segment from point 0 to each of the five plotted points. The segment with
the steepest slope (vertical change divided by horizontal change) indicates the greatest price-to-cost
ratio. Segment OE has the steepest slope, and hence company E earned the greatest profit.
www.petersons.com
295
296
Chapter 16
Exercise 5
Work out each problem. Circle the letter that appears before your answer.
1.
According to the data shown below, by
approximately what amount did Division D’s
income exceed Division C’s income during
year X?
WEBCO’S INCOME DURING YEAR X —
DIVISIONS A, B, C, AND D
(A)
(B)
(C)
(D)
(E)
2.
$125,000
$127,000
$140,000
$156,000
$312,000
Among the years covered in the graph below,
during the year in which aggregate awards of
non-minority and minority funds was greatest,
the dollar difference between non-minority and
minority awards was approximately:
(A)
(B)
(C)
(D)
(E)
$130,000
$160,000
$220,000
$270,000
$400,000
www.petersons.com
3.
Referring to the graph below, during the twomonth period over which the average daily
temperature in City X increased by the greatest
percentage, City Y’s highest daily temperature
was approximately:
(A)
(B)
(C)
(D)
(E)
38 degrees
42 degrees
52 degrees
62 degrees
66 degrees
Additional Geometry Topics, Data Analysis, and Probability
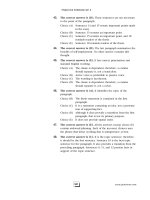
Questions 4 and 5 are based on the following figure,
which compares the race times of ten different cyclists, all of whom competed in the same two races
(race 1 and race 2).
4.
Among the five cyclists identified in the figure
as A, B, C, D, and E, which had the fastest
combined (total) race time for races 1 and 2?
(A) A
(B) B
(C) C
(D) D
(E) E
5.
Considering the ten cyclists as a group, which
of the following most closely approximates the
ratio of the average time for race 1 to the
average time for race 2?
(A) 1:2
(B) 2:3
(C) 1:1
(D) 3:2
(E) 2:1
www.petersons.com
297
298
Chapter 16
6. PROBABILITY
The new SAT includes simple questions involving probability, which refers to the statistical chances, or “odds,”
of an event occurring (or not occurring). By definition, probability ranges from 0 to 1. (Probability is never
negative, and it’s never greater than 1.) You can express probability either as either a fraction or a percent. Here’s
the basic formula:
number of ways the event can occur
Probability = total numbber of possible occurrences
Example:
A standard deck of 52 playing cards contains 12 face cards. What is the probability of selecting a
face card from such a deck?
Solution:
12
3
The correct answer is 52 , or 13 . There are 12 ways that a face card could be selected at random
from the standard 52-card deck.
To calculate the probability of an event NOT occurring, just subtract the probability of the event occurring from
40
10
1. Referring to the preceding example, the probability of NOT selecting a face card would be 52 , or 13 . (Sub12
tract 52 from 1.)
An SAT probability problem might involve the probability of two independent events both occurring. Two
events are “independent” if neither event affects the probability that the other will occur. Here are two general
situations:
* The random selection of one object from each of two groups (for example, the outcome of throwing a pair of
dice)
* The random selection of one object from a group, then replacing it and selecting again (as in a “second round”
or “another turn” of a game)
To determine the probability of two independent events both occurring, multiply individual probabilities.
Example:
If you randomly select one letter from each of two sets: {A,B} and {C,D,E}, what is the probability
of selecting A and C?
Solution:
1
1
The correct answer is 6 . The probability of selecting A from the set {A,B} is 2 , while the
1
probability of selecting C from the set {C,D,E} is 3 . Hence, the probability of selecting A and C is
1×1
1
, or 6 .
2 3
An SAT probability problem might be accompanied by a geometry figure or other figure that provides a visual
display of the possibilities from which you are to calculate a probability.
www.petersons.com
Additional Geometry Topics, Data Analysis, and Probability
Example:
If a point is selected at random from the circular region shown above, what is the probability that
the point will lie in a shaded portion of the circle?
Solution:
1
The correct answer is .25 (or 4 ). The angles opposite each of the three 45° angles identified in the
figure must also measure 45° each. Given a total of 360° in a circle, all of the eight small angles
formed at the circle’s center measure 45°, and hence all eight segments of the circle are congruent.
2
1
The two shaded segments comprise 8 , or 4 (.25) of the circle’s area. The probability of selecting a
1
point at random in a shaded area is also 4 (or .25).
www.petersons.com
299
300
Chapter 16
Exercise 6
Work out each problem. For questions 1–4, circle the letter that appears before your answer. Question 5 is a gridin question.
1.
If you randomly select one candy from a jar
containing two cherry candies, two licorice
candies, and one peppermint candy, what is the
probability of selecting a cherry candy?
(A)
(B)
(C)
(D)
(E)
2.
Patrons at a certain restaurant can select two of
three appetizers—fruit, soup and salad—along
with two of three vegetables—carrots, squash
and peas. What is the probability that any
patron will select fruit, salad, squash, and peas?
(A)
(B)
(C)
(D)
(E)
3.
1
6
1
5
1
3
2
5
3
5
(B)
(C)
(D)
(E)
A piggy-bank contains a certain number of
coins, of which 53 are dimes and 19 are
nickels. The remainder of the coins in the bank
are quarters. If the probability of selecting a
1
quarter from this bank is 4 , how many
quarters does the bank contain?
(A)
(B)
(C)
(D)
(E)
5.
16
21
24
27
30
The figure below shows two concentric circles,
each divided into six congruent segments. The
area of the large circle is exactly 3 times that of
the smaller circle.
1
12
1
9
1
6
1
3
1
2
If one student is chosen randomly out of a
group of seven students, then one student is
again chosen randomly from the same group of
seven, what is the probability that two different
students will be chosen?
(A)
4.
36
49
6
7
19
21
13
14
48
49
www.petersons.com
If a point is selected at random from the large
circular region, what is the probability that the
point will lie in a shaded portion of that circle?
Additional Geometry Topics, Data Analysis, and Probability
RETEST
Answer questions 1–12. Question 9 is a “grid-in” (student-produced response) question; all other questions are
standard multiple-choice. Try to answer questions 1 and 2 using trigonometry.
1.
In the triangle shown below, what is the value
of x ?
(A)
(B)
(C)
2
2 2
3
(D)
5 2
2
(E)
2.
3.
If the radius of O1 is r and the radius of O2 is
twice as long, what is the area of the shaded
region?
(A) 12 πr2
(B) πr2
(C) 23 πr2
(D) 2πr2
(E) 3πr2
4
Two planes depart at the same time from the
same terminal, one traveling due north and the
other due west, each on a straight flight path.
When the shortest distance between the planes
is 40 miles, one plane would need to turn 120°
to either the left or right to point directly at the
other plane. Which of the following most
closely approximates the number of miles the
faster of the two planes has traveled at this
point in time?
(A) 25
(B) 30
(C) 35
(D) 40
(E) 45
In the figure below, O1 and O2 are concentric
circles and AB is tangent to O1 at C.
4.
In the xy-plane below, if the scales on both axes
are the same, which of the following could be
the equation of l1 ?
2
x–3
3
(A)
y=
(B)
(C)
y = –2x + 1
y=x+3
(D)
y = –3x −
(E)
y= − x–3
2
3
2
3
www.petersons.com
301
302
Chapter 16
5.
In the xy-plane, if lines a and b intersect at
point (5,–2) and lines b and c intersect at point
(–3,3), what is the slope of line b ?
(A)
(B)
(C)
(D)
(E)
6.
7.
8.
5
2
5
−
8
2
−
5
1
2
−
It cannot be determined from the
information given.
Which of the following is the equation of a
straight line that has y-intercept 3 and is
perpendicular to the line 4x – 2y = 6 ?
(A) 2y + 3x = –3
(B) y + 3x = 2
(C) 2y – x = 6
(D) y – 2x = 4
(E) 2y + x = 6
(A)
(B)
1
If f(x) = − 2 x, then the line shown in the xyplane below is the graph of
(A)
(B)
(C)
(D)
(E)
If f(x) = 2x2 + 2, then the graph shown in the
xy-plane below best represents which of the
following functions?
f(x)
f(x – 3)
f(x + 3)
f(–4x)
f(x + 6)
www.petersons.com
9.
(1)
1
f (− x )
f 2
(C)
f(–2x)
(D)
x
f −4
(E)
−x
2
( )
f( )
Based on the data shown below, how many
chickens at Hill Farm laid 10 eggs from
June 1st through June 7th?
Additional Geometry Topics, Data Analysis, and Probability
10. According to the data shown below, during
what year was the dollar amount of Country
Y’s exports approximately twice that of
Country X’s imports?
(A)
(B)
(C)
(D)
(E)
1985
1987
1988
1989
1990
11. A bag of marbles contains twice as many red
marbles as blue marbles, and twice as many
blue marbles as green marbles. If these are the
only colors of marbles in the bag, what is the
probability of randomly picking a blue marble
from the bag?
(A)
(B)
(C)
(D)
(E)
1
6
2
9
1
4
2
7
1
3
12. The figure below shows two T-shaped
cardboard pieces, both to be folded into a pair
of cube-shaped dice.
On a fair throw of both dice, what is the
probability that NEITHER die will show either
a solid white or solid black surface facing up?
(A)
(B)
(C)
(D)
(E)
1
6
1
5
1
4
1
3
2
5
www.petersons.com
303
304
Chapter 16
SOLUTIONS TO PRACTICE EXERCISES
Diagnostic Test
1.
(B)
Since the figure shows a 45°-45°-90°
4.
triangle in which the length of one leg is
known, you can easily apply either the sine or
the line. Using the pair (2,3):
cosine function to determine the length of the
y = −x + b
3 = −2 + b
5=b
2
, set the value of this function equal to
2
5 opposite
x hypotenuse , then solve for x:
2 5
10 10 2
= ; 2 x = 10 ; x =
=
=5 2.
2
x
2
2
(D)
The line’s equation is y = –x + 5. To determine
which of the five answer choices provides a
point that also lies on this line, plug in the
values of x and y provided each answer choice,
in turn. Only choice (E) provides a solution to
the equation: –1 = –6 + 5.
Since the figure shows a 30°-60°-90°
the cosine function to determine the length of
The slope of AB =
y2 − y1 3 − (−3) 6 3
=
= =
x 2 − x1 4 − (−4) 8 4 . The slope of the line
the hypotenuse. Applying the function sin30° =
perpendicular to AB is the negative reciprocal
triangle, you can easily apply either the sine or
1
2
4
x
3.
The line’s slope (m) =
y2 − y1 1 − 3 −2
=
=
= −1 . Substitute the (x,y)
x 2 − x1 4 − 2 2
pair for either point to define the equation of
hypotenuse. Applying the function sin45° =
2.
(E)
5.
(B)
3
1 4
opposite
hypotenuse , then solve for x: 2 = x ; x = 8 .
4
of 4 , which is – 3 .
, set the value of this function equal to
6.
(D)
Given any two xy-coordinate points, a
y −y
(C) Since the hexagon is regular (all sides are
congruent), the area of ∆AOP in the following
figure is 3 — one sixth the area of the
hexagon.
1
2
line’s slope m = x − x . Accordingly,
1
2
1 5 − (−3)
=
. Simplify, then cross-multiply to
3
a−2
solve for a:
1
8
=
3 a−2
a − 2 = (3)(8)
a − 2 = 24
a = 26
7.
∆AOP is equilateral; hence you can divide it
into two 1: 3 :2 triangles, as shown in the
figure. Since the common leg, whose length is
3 , is also the circle’s radius, the circle’s
circumference must be 2π 3 .
www.petersons.com
(B) By visual inspection, you can see that the
maximum value of y is 2, and this value occurs
only once in the set of y-values — when x = 0.