Basic Theory of Plates and Elastic Stability - Part 14 pot
Bạn đang xem bản rút gọn của tài liệu. Xem và tải ngay bản đầy đủ của tài liệu tại đây (410.1 KB, 35 trang )
Gould, P.L. and Kratzig, W.B. “Cooling Tower Structures”
Structural Engineering Handbook
Ed. Chen Wai-Fah
Boca Raton: CRC Press LLC, 1999
Cooling Tower Structures
Phillip L. Gould
Department of Civil Engineering,
Washington University,
St. Louis, MO
Wilfried B. Krätzig
Ruhr-University,
Bochum, Germany
14.1 Introduction
14.2 Components of a Natural Draft Cooling Tower
14.3 Damage and Failures
14.4 Geometry
14.5 Loading
14.6 Methods of Analysis
14.7 Design and Detailing of Components
14.8 Construction
References
Further Reading
14.1 Introduction
Hyper bolic cooling towers are large, thin shell reinforced concrete structures which contr ibute to
environmental protection and to power generation efficiency and reliability. As shown in Figure 14.1,
they may dominate the landscape but they possess a certain aesthetic .eloquence due to their doubly
curved form. The operation of a cooling tower is illustrated in Figure 14.2. In a thermal power
station, heated steam drives the turbogenerator which produces electric energy. To create an efficient
heat sink at the end of this process, the steam is condensed and recycled into the boiler. This requires
a large amount of cooling water, whose temperature is raised and then recooled in the tower.
In a so-called “wet” natural draft cooling tower, the heated water is distributed evenly through
channels and pipes above the fill. As the water flows and drops through the fill sheets, it comes into
contact with the rising cooler air. Evaporative cooling occurs and the cooled water is then collected in
the water basin to be recycled into the condenser. The difference in density of the warm air inside and
the colder air outside creates the natural draft in the interior. This upward flow of warm air, which
leads to a continuous stream of fresh air through the air inlets into the tower, is protected against
atmospheric turbulence by the reinforced concrete shell. The cooling tower shell is supported by a
truss or framework of columns br idging the air inlet to the tower foundation.
There are also “dry” cooling towers that operate simply on the basis of convective cooling. In
this case the water distribution, the fill, and the water basin are replaced by a closed piping system
around the air inlet, resembling, in fact, a gigantic automobile radiator. While dry cooling towers
are doubtless superior from the point of view of environmental protection, their thermal efficiency
is only about 30% of comparable wet towers. If the flue gas is cleaned by a washing technology, it is
frequently discharged into the atmosphere by the cooling tower upward flow. This saves reheating of
the cleaned flue gas and the construction of a smoke stack (see Figure 14.2).
Figure 14.3 summarizes the historical development of natural draft cooling towers. Technical
cooling devices first came into use at the end of the 19th century. The well-known hyperbolic shape
c
1999 by CRC Press LLC
FIGURE 14.1: A group of hyperbolic cooling towers.
of cooling towers was introduced by two Dutch engineers, Van Iterson and Kuyper, who in 1914
constructed the first hyperboloidal towers which were 35 m high. Soon, capacities and heights
increased until around 1930, when tower heights of 65 m were achieved. The first such structures to
reach higher than 100 m were the towers of the High Marnham Power Station in Britain.
Today’s tallest cooling towers, located at several EDF nuclear power plants in France, reach heights
of about 170 m. The key dimensions of one of the largest modern towers are shown in Figure 14.4.
In relative proportions, the shell is thinner than an egg, and it is predicted that 200 m high towers
will be constructed in the early 21st century.
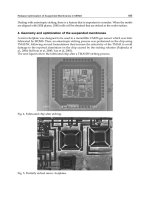
14.2 Components of a Natural Draft Cooling Tower
The most prominent component of a natural draft cooling tower is the huge, towering shell. This
shell is supported by diagonal, meridional, or vertical columns bridging the air inlet. The columns,
made of high-strength reinforced concrete, are either prefabricated or cast in situ into moveable steel
forms (Figure 14.5). After the erection of the ring of columns and the lower edge member, the
climbing formwork is assembled and the stepwise climbing construction of the cooling tower shell
c
1999 by CRC Press LLC
FIGURE 14.2: Thermal power plant with cleaned flue gas injection.
FIGURE 14.3: Historical development of natural draft cooling tower.
begins (Figure 14.6a). Fresh concrete and reinforcement steel are supplied to the working site by
a central crane anchored to the completed parts of the shell, and are placed in lifts up to 2 m high
(Figure 14.6b). After sufficient strength has been gained, the complete forms are raised for the next
lift.
To enhance the durability of the concrete and to provide sufficient cover for the reinforcement,
the cooling tower shell thickness should not be less than 16 to 18 cm. The shell itself should be
sufficiently stiffened by upper and lower edge members. In order to achieve sufficient resistance
against instability, large cooling tower shells may be stiffened by additional internal or external rings.
These stiffeners may also serve as a repair or rehabilitation tool.
c
1999 by CRC Press LLC
FIGURE 14.4: Cooling tower: Gundremmingen, Germany.
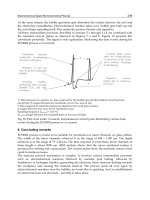
Wet cooling towers have a water basin with a cold water outlet at the base. These are both large
engineered structures, able to handle up to 50 m
3
/s of water circulation, as indicated in Figure 14.7.
The fill construction inside the tower is a conventional frame structure, always prefabricated. It
carries the water distribution, a large piping system, the spray nozzles, and the fill-package. Often
dripping traps are applied on the upper surfaces of the fill to keep water losses through the uplift
stream under 1%. Finally, noise protection elements around the inlet decrease the noise caused by
the continuously dripping water, as illust rated in Figure 14.2.
14.3 Damage and Failures
Today’s natural draft cooling towers are safe and durable structures if properly designed and con-
structed. Nevertheless, it should be recognized that this high quality level has been achieved only
after the lessons learned from a series of collapsed or heavily damaged towers have been incorporated
into the relevant body of engineering knowledge.
While cooling towers have been the largest existing shell structures for many decades, their design
and construction were formerly carried out simply by following the existing “recognized rules of
craftsmanship”, which had never envisaged constructions of this type and scale. This changed radi-
cally, however, in the wake of the Ferrybridge failures in 1965 [7]. On November 1st, 1965, three of
eight 114 m high cooling towers collapsed during a Beaufort 12 gale in an obviously identical manner
(Figure 14.8). Within a few years of this spectacular accident, the response phenomena of cooling
towers had been studied in detail, and safety concepts with improved design rules were developed.
These international research activ ities gained further momentum after the occurrence of failures in
c
1999 by CRC Press LLC
FIGURE 14.5: Fabrication of supporting columns.
Ardeer (Britain) in 1973, Bouchain (France) in 1979, and Fiddler’s Ferry (Britain) in 1984, the latter
case clearly displaying the influence of dynamic and stability effects.
In surveying these failures, one can recognize at least four common circumstances:
1. The maximum design wind speed was often underestimated, so that the safety margin
for the wind load was insufficient.
2. Group effects leading to higher wind speeds and increased vortex shedding influence on
downstream towers were neglected.
3. Large regions of the shell were reinforced only in one central layer (in two orthogonal
directions), or the double layer reinforcement was insufficient.
4. The towers had no upper edge members or the existing members were too weak for
stiffening the structure against dynamic wind actions.
Two towersintheU.S., namely at WillowIsland, West Virginia, and at Port Gibson, Mississippi, were
heavily damaged during their construction stage, the latter by a tornado. The Port Gibson tower was
repaired partly by adding intermediate ring stiffeners [5]. Another tower in Poland collapsed without
any definitive explanation having been published up to now, but probably because of considerable
imperfections.
c
1999 by CRC Press LLC
FIGURE 14.6:a Climbing construction of the shell.
In addition to these cases, cracking of many cooling towers has been observed, often due to ground
motions following underground coal mining, or just because of faulty design and construction.
Obviously, any visible crack in a cooling tower shell is an indication of deterioration of its safety and
reliability. It is thus imperative to conform to a design concept that guarantees sufficiently safe and
reliable structures over a predetermined lifetime.
Although power plant construction over much of the industrialized west has slowed in the last
decade, research and development on the structural aspects of hyperbolic cooling towers has contin-
ued [4, 9] and a new wave of construction for these impressive structures seems to be approaching.
Engineers face this challenge with confidence in their improved analytical tools, in their ability to
employ improved materials, and in their valuable exper ience in construction.
14.4 Geometry
The main elements of a cooling tower shell in the form of a hyperboloid of revolution are shown
in Figure 14.9. This form falls into the class of structures known as thin shells. The cross-section
as shown depicts the ideal profile of a shell generated by rotating the hyperboloid R = f (Z) about
c
1999 by CRC Press LLC
FIGURE 14.6:b Steel reinforcement of shell wall.
the vertical (Z) axis. The coordinate Z is measured from the throat while z is measured from the
base. All dimensions in the R-Z plane are specified on a reference surface, theoretically the middle
surface of the shell but possibly the inner or outer surface. Dimensions through the thickness are
then referred to this surface. There are several variations possible on this idealized geometry such
as a cone-toroid with an upper and lower cone connected by a toroidal segment, two hyperboloids
with different curves meeting at the throat, and an offset of the curve describing the shell wall from
the axis of rotation.
Important elements of the shell include the columns at the base, which provide the necessary
opening for the air; the lintel, either a discrete member or more often a thickened portion of the shell,
which is designed to distribute the concentrated column reactions into the shell wall; the shell wall
or veil, which may be of varying thickness and provides the enclosure; and the cornice, which like the
lintel may be discrete or a thickened portion of the wall designed to stiffen the top against ovaling.
Referring to Figure 14.9, the equation of the generating curve is given by
4R
2
/d
2
T
− Z
2
/b
2
= 1 (14.1)
c
1999 by CRC Press LLC
FIGURE 14.7: Water basin.
where b is a characteristic dimension of the shell that may be evaluated by
b = d
H
Z
H
/
√
d
2
H
− d
2
T
(14.2)
or by
b = d
U
Z
U
/
√
d
2
U
− d
2
T
(14.3)
if the upper and lower curves are different. The dimension b is related to the slope of the asymptote
of the generating hyperbola (see Figure 14.9)by
b = 2cd
T
(14.4)
14.5 Loading
Hyper bolic cooling towers may be subjected to a variety of loading conditions. Most commonly, these
are dead load (D), wind load (W), earthquake load (E), temperature variations (T), construction
loads (C), and settlement (S). For the proportioning of the elements of the cooling tower, the effects
of the various loading conditions should be factored and combined in accordance with the applicable
codes or standards. If no other codes or standards specifically apply, the factors and combinations
giveninASCE7[11] are appropriate.
Dead load consists of the self-weight of the shell wall and the ribs, and the superimposed load from
attachments and equipment.
Wind loading is extremely important in cooling tower design for several reasons. First of all,
the amount of reinforcement, beyond a prescribed minimum level, is often controlled by the net
difference between the tension due to wind loading and the dead load compression, and is therefore
c
1999 by CRC Press LLC
FIGURE 14.8: Collapse of Ferrybridge Power Station shell.
especially sensitive to variations in the tension. Second, the quasistatic velocity pressure on the
shell wall is sensitive to the vertical variation of the wind, as it is for most structures, and also to
the circumferential variation of the wind around the tower, which is peculiar to cylindrical bodies.
While the vertical variation is largely a function of the regional climatic conditions and the ground
surface irregularities, the circumferential variation is strongly dependent on the roughness properties
of the shell wall surface. There are also additional wind effects such as internal suction, dynamic
amplification, and group configuration.
The external wind pressure acting at any point on the shell surface is computed as [2, 9]
q(z, θ) = q(z)H(θ)(1 + g)
(14.5)
in which
q(z) = effectivevelocitypressureataheightz above the ground level (Figure 14.9)
H(θ) = coefficient for circumferential distribution of external wind pressure
1 +g = gust response factor
g = peak factor
As mentioned above, q(z) should be obtained from applicable codes or standards such as Refer-
ence [11].
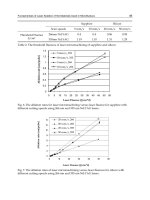
The circumferential distribution of the wind pressure is denoted by H(θ) and is shown in Fig-
ure 14.10. The key regions are the windward meridian, θ = 0
◦
, the maximum side suction, θ 70
◦
,
and the back suction, θ ≥ 90
◦
. These curves were determined by laboratory and field measurements
as a function of the roughness parameter k/a as shown in Figure 14.11, in which k is the height of
c
1999 by CRC Press LLC
FIGURE 14.9: Hyperbolic cooling tower.
the rib and a is the mean distance between the ribs measured at about 1/3 of the height of the tower.
Note that the coefficient along the windward meridian H (0) reflects the so-called stagnation pressure
while the side-suction is, remarkably, significantly affected by the surface roughness k/a.Aswillbe
discussed in a later section, the meridional forces in the shell wall and hence the required reinforcing
steel are very sensitive to H(θ). In turn, the costs of construction are affected. Thus, the design of the
ribs, or of alternative roughness elements, are an important consideration. For quantitative purposes,
the equations of the various curves are given in Table 14.1 and tabulated values at 5
◦
intervals are
available [13].
TABLE 14.1 Functions of Pressure Curves H () and Corresponding Drag Coefficients c
W
Minimum
Curve pressure Area I Area II Area III
c
W
K1.0 −1.0 1 − 2.0
sin
90
70
2.267
−1.0 + 0.5
sin
90
21
( − 70)
2.395
−0.5 0.66
K1.1
−1.1 1 − 2.1
sin
90
71
2.239
−1.1 + 0.6
sin
90
22
( − 71)
2.395
−0.5 0.64
K1.2
−1.2 1 − 2.2
sin
90
72
2.205
−1.2 + 0.7
sin
90
23
( − 72)
2.395
−0.5 0.60
K1.3
−1.3 1 − 2.3
sin
90
73
2.166
−1.3 + 0.8
sin
90
24
( − 73)
2.395
−0.5 0.56
The circumferential distribution of the external wind pressure may be presented in another manner
which accents the importance of the asymmetry. If the distribution H(θ)is represented in a Fourier
cosine series of the form
H(θ) =
n=∞
n=0
A
n
cos nθ (14.6)
c
1999 by CRC Press LLC
FIGURE 14.10: Types of circumferential pressure distribution.
the Fourier coefficients A
n
for a distribution most similar to the curve for K1.3 are as follows [13]:
nA
n
0 −0.3922
1 0.2602
2 0.6024
3 0.5046
4 0.1064
5
−0.0948
6
−0.0186
7 0.0468
Representative modes are shown in Figure 14.12.Then = 0 mode represents uniform expansion
and contraction of the circumference, while n =1 corresponds to beam-like bending about a diamet-
rical axis resulting in translation of the cross-section. The higher modes n>1 are peculiar to shells
in that they produce undulating deformations around the cross-section with no net translation. The
relatively large Fourier coefficients associated with n = 2,3,4,5 indicate that a significant portion of
the loading will cause shell deformations in these modes. In turn, the corresponding local forces are
significantly higher than a beam-like response would produce.
To account for the internal conditions in the tower during operation, it is common practice to add
an axisymmetric internal suction coefficient H = 0.5 to the external pressure coefficients H(θ).In
terms of the Fourier series representation, this would increase A
0
to −0.8922.
The dynamic amplification of the effective velocity pressure is represented by the parameter g in
Equation 14.5. This parameter reflects the resonant part of the response of the st ructure and may be
as much as 0.2 depending on the dynamic character istics of the structure. However, when the basis
c
1999 by CRC Press LLC
FIGURE 14.11: Surface roughness k/a and maximum side-suction.
of q(z) includes some dynamic portion, such as the fastest-mile-of-wind, (1 +g) is commonly taken
as 1.0.
Cooling towers are often constructed in groups and close to other structures, such as chimneys or
boiler houses, which may be higher than the tower itself. When the spacing of towers is closer than
1.5 times the base diameter or 2 times the throat diameter, or when other tall structures are nearby,
the wind pressure on any single tower may be altered in shape and intensity. Such effects should be
studied carefully in boundary-layer wind tunnels in order not to overlook dramatic increases in the
wind loading.
Earthquake loading on hyperbolic cooling towers is produced by ground motions transmitted
from the foundation through the supporting columns and the lintel into the shell. If the base motion
is assumed to be uniform vertically and horizontally, the circumferential effects are axisymmetrical
(n = 0) and antisymmetrical (n = 1), respectively (see Figure 14.12). In the meridional direction,
the magnitude and distribution of the earthquake-induced forces is a function of the mass of the
tower and the dynamic properties of the structure (natural frequencies and damping) as well as
the acceleration produced by the earthquake at the base of the structure. The most appropriate
technique for determining the loads applied by a design earthquake to the shell and components
is the response spectrum method which, in turn, requires a free vibration analysis to evaluate the
natural frequencies [2, 3, 4]. It is common to use elastic spectra with 5% of critical damping. The
supporting columns and foundation are critical for this loading condition and should be modeled
in appropriate detail [3, 4].
Temperature variations on cooling towers arise from two sources: operating conditions and sun-
shine on one side. Ty pical operating conditions are an external temperature of −15
◦
C and internal
temperature of +30
◦
C. This is an axisymmetrical effect, n = 0 on Figure 14.12. For sunshine, a
c
1999 by CRC Press LLC
FIGURE 14.12: Harmonic components of the radial displacement.
temperature gradient of 25
◦
C constant over the height and distributed as a half-wave around one
half of the circumference is appropriate. This loading would require a Fourier expansion in the form
of Equation 14.6 and higher harmonic components, n>1, to be considered.
Construction loads are generally caused by the fixing devices of climbing formwork, by tower crane
anchors, and by attachments for material transport equipment as shown in Figure 14.13. These loads
must be considered on the portion of the shell extant at the phase of construction.
Non-uniform settlement due to varying subsoil stiffness may be a consideration. Such effects
should be modeled considering the interaction of the foundation and the soil.
14.6 Methods of Analysis
Thin shells may resist external loading through forces acting parallel to the shell surface, forces
acting perpendicular to the shell surface, and moments. While the analysis of such shells may be
formulated within the three-dimensional theory of elasticity, there are reduced theories which are
two-dimensional and are expressed in terms of force and moment intensities. These intensities are
traditionally based on a reference surface, generally the middle surface, and are forces and moments
per unit length of the middle surface element upon which they act. They are called stress resultants
and stress couples, respectively, and are associated with the three directions: circumferential, θ
1
;
meridional, θ
2
; and normal, θ
3
. In Figure 14.14, the extensional stress resultants, n
11
and n
22
, the
in-plane shearing stress resultants, n
12
= n
21
, and the transverse shear stress resultants, q
12
= q
21
,
are shown in the left diagram along with the components of the applied loading in the circumferential,
meridional, and normal directions, p
1
,p
2
, and p
3
, respectively. The bending stress couples, m
11
and m
22
, and the twisting stress couples, m
12
= m
21
, are shown in the right diagram along with the
displacements v
1
,v
2
, and v
3
in the respective directions.
Historically, doubly curved thin shells have been designed to resist applied loading primarily
through the extensional and shearing forces in the “plane” of the shell surface, as opposed to the
c
1999 by CRC Press LLC
FIGURE 14.13: Attachments on shell wall.
transverse shears and bending and twisting moments which predominate in flat plates loaded nor-
mally to their surface. This is known as membrane action, as opposed to bending action, and is
consistent with an accompanying theory and calculation methodology which has the advantage of
being statically determinate. This methodology was well-suited for the pre-computer age and en-
abled many large thin shells, including cooling towers, to be rationally designed and economically
constructed [9]. Because the conditions that must be provided at the shell boundaries in order to
insure membrane action are not always achievable, shell bending should be taken into account even
for shells designed by membrane theory. Remarkably, the accompanying bending often is confined
to narrow regions in the vicinity of the boundaries and other discontinuities and may have only a
minor effect on the shell design, such as local thickening and/or additional reinforcement. Many
clever and insightful techniques have been developed over the years to approximate the effects of
local bending in shells desig ned by the membrane theory.
As we have passed into and advanced in the computer age, it is no longer appropriate to use the
membrane theory to analyze such extraordinary thin shells, except perhaps for preliminary design
purposes. The finite element method is widely accepted as the standard contemporary technique
and the attention shifts to the level of sophistication to be used in the finite element model. As is
often the case, the greater the level of sophistication specified, the more data required. Consequently,
c
1999 by CRC Press LLC
FIGURE 14.14: Surface loads, stress resultants, stress couples, and displacements.
a model may evolve through several stages, starting with a relatively simple version that enables
the structure to be sized, to the most sophisticated version that may depict such phenomena as
the sequence of progressive collapse of the as-built shell under various static and dynamic loading
scenarios, the incremental effects of the progressive stages of construction, the influence of the
operating environment, aging and deterioration on the structure, etc. The techniques described
in the following paragraphs form a hierarchical progression from the relatively simple to the very
complex, depending on the objective of the analysis.
In modeling cooling tower shells using the finite element method, there are a number of options.
For the shell wall, ring elements, triangular elements, or quadrilateral elements have been used.
Earlier, flat elements adapted from the two-dimensional elasticity and plate formulations were used
to approximate the doubly curved surface. Such elements present a number of theoretical and
computational problems and are not recommended for the analysis of shells. Currently, shell elements
degenerated from three-dimensional solid elements are very popular. These elements have been
utilized in both the ring and quadrilateral form.
The column region at the base of the shell presents a special modeling challenge. For static analysis,
the lower boundary is often idealized as a uniform support at the lintel level. Then, a portion of the
lower shell and the columns is considered in a subsequent analysis to account for the concentrated
actions of the columns, which may penetrate only a relatively short distance into the shell wall. For
dynamic analysis, it is important to include the column region along with the veil in the model.
An equivalent shell element has proved useful in this regard if ring elements are used to model the
shell [3, 4]. It may also be desirable to include some of the foundation elements, such as a ring beam
at the base and even the supporting piles in a dynamic or settlement model.
The linear static analysis method is based on the classical bending theory of thin shells. While
this theory has been formulated for many years, solutions for doubly curved shells have not been
readily achievable until the development of computer-based numerical methods, most notably the
finite element method. The outputs of such an analysis are the stress resultants and couples, defined
on Figure 14.14, over the entire shell surface and the accompanying displacements. The analysis is
based on the initial geometry, linear elastic material behavior, and a linear kinematic law. Some rep-
resentative results of such analyses for a large cooling tower (Figure 14.15) are shown in Figures 14.16
through 14.24 for some of the important loading conditions discussed in the preceding section. The
finite element model used considers the shell to be fixed at the top of the columns and, thus, does
not account for the effect of the concentrated column reactions. Also, in considering the analyses
under the individual loading conditions, it should be remembered that the effects are to be factored
and combined to produce design values.
c
1999 by CRC Press LLC
FIGURE 14.15: Design project for a 200-m high cooling tower: geometry.
FIGURE 14.16: Circumferential forces n
11G
under deadweight.
c
1999 by CRC Press LLC
The dead load analysis results in Figures 14.16 and 14.17 indicate that the shell is always under
compression in both directions, except for a small circumferential tension near the top. This is a very
desirable feature of this geometrical form.
In Figures 14.18 through 14.20, the results of an analysis for a quasistatic wind load using the K1.0
distribution from Figure 14.10 are shown. Large tensions in both the mer idional and circumferential
directions are present. The regions of tension may extend a considerable distance along the circum-
ference from the windward meridian, and the magnitude of the forces is strongly dependent on the
distribution selected. In contrast to bluff bodies, where the magnitude of the extensional force along
the meridian would be essentially a function of the overturning moment, the cylindrical-type body is
also strongly influenced by the circumferential distribution of the applied pressure, a function of the
surface roughness. The major effect of the shearing forces is at the level of the lintel where they are
transferred into the columns. The internal suction effects (Figures 14.21 and 14.22) are significant
only in the circumferential direction.
For the service temperature case shown in Figures 14.23 and 14.24, the main effects are bending
in the lower region of the shell wall.
The analysis of hyperbolic cooling towers for instability or buckling is a subject that has been
investigated for several decades [1]. Shell buckling is a complex topic to treat analytically in any case
due to the influence of imperfections; for reinforced concrete, it is even more difficult. While the
governing equations may be generalized to treat instability by using nonlinear str ain-displacement
relations and thereby introducing the geometric stiffness matrix, the correlation between the resulting
analytical solutions and the possible failure of a reinforced concrete cooling tower is questionable.
Nevertheless, it has been common to analyze cooling tower shells under an unfactored combination
of dead load plus wind load plus internal suction. The corresponding buckling pattern is shown in
Figure 14.25.
Interaction diagrams calibrated from experimental studies based on bifurcation buckling are also
available [9, 12, 13]. Additionally, there are empirical methods based on wind tunnel tests that
consider a snap-through buckle at the upper edge at each stage of construction [13]. These formulas
are proportional to h/R and are convenient for establishing an appropriate shell thickness. If buckling
safety is evaluated based on such a linear buckling analysis or an experimental investigation, the
buckling safety factor for realistic material parameters should exceed 5.0. Presently, however, the use
of bifurcation buckling analyses should be confined to preliminary proportioning since more r ational
procedures based on nonlinear analysis have been developed to predict the collapse of reinforced
concrete shells, as discussed in the following paragraphs.
Advances in the analyses of reinforced concrete have produced the capability to analyze shells
taking into account the layered composition of the cross-section as shown in Figure 14.26. Using
realistic material properties for steel and for concrete, including tension stiffening in the form shown
in Figures 14.27 through 14.29, load-deflection relationships may be constructed for appropriate
load combinations. These relationships progress from the linear elastic phase to initial cracking of
the concrete through spreading of the cracks until collapse.
Results from a nonlinear study are presented in Figures 14.30 through 14.33. The geometry of
the shell is given in Figure 14.30, the wind load factor λ is plotted against the maximum lateral
displacement at the top of the shell in Figure 14.31, and the deformed shape for the collapse load is
shown in Figure 14.32. Also, the pattern of cracking corresponding to the initial y ielding of the rein-
forcement is indicated in Figure 14.33. For reinforced concrete shells, this type of analysis represents
the state-of-the-ar t and provides a realistic evaluation of the capacity of such shells against extreme
loading [8]. Also durability assessments can be performed by this concept, from which particularly
weak and crack-endangered regions of the shell can be identified and further reinforced [10].
It is possible to obtain an estimate of the wind load factor, λ, from the results of a linear elastic
analysis, even from a calculation based on membrane theory. This estimate is computed as the
cracking load for the shell under a combination of D + λW and is predicated on the notion that the
c
1999 by CRC Press LLC
FIGURE 14.17: Meridional forces n
22G
under deadweight.
FIGURE 14.18: Circumferential forces n
11W
under wind load.
c
1999 by CRC Press LLC
FIGURE 14.19: Meridional forces n
22W
under wind load.
FIGURE 14.20: Shear forces n
12W
under wind load.
c
1999 by CRC Press LLC
FIGURE 14.21: Circumferential forces n
11S
under internal suction.
reinforcement may add only a modest amount of capacity to the tower beyond the cracking load [6].
The amount of reinforcement in the wall is often controlled by a specified minimum percentage
augmented by that required to resist the net tension due to the factored load combinations. The
steel provided is often less than the capacity of the concrete in tension, which is presumed to be lost
when the concrete cracks. Therefore, the cracking load represents most of the ultimate capacity of
the tower.
The maximum meridional tension location under the wind loading is identified, for example, as the
value of n
22
=863 kN/m in Figure 14.19. The dead load at this location is obtained from Figure 14.17
as −701 kN/m. Taking the concrete tensile capacity as 2,400 kN/m
2
and the wall thickness as 16 cm,
the tensile strength is 384 kN/m. Therefore, we have
− 701 + λ863 = 384
(14.7)
giving λ = 1.26 as the lower bound on the ultimate strength of the tower. Note that the tower used
for the linear elastic analysis is much taller than the one shown in Figure 14.30.
The dynamic analysis of cooling towers is usually associated with design for earthquake-induced
forces. The most efficient approach is the response spectrum method, but a time history analysis
may be appropriate if nonlinearities are to be included [2, 7]. For large shells the dynamic response
due to wind is often investigated, at least to determine the positions of the nodal lines and areas of
particularly intensive vibrations. In any case the first step is to carry out a free vibration analysis.
This analysis represents the modes of free vibration associated with each natural frequency, f ,or
its inverse the natural period T, as the product of a circumferential mode proportional to sin nθ or
cos nθ and a longitudinal mode along the z axis [3, 4]. Some representative results are shown on
Figures 14.34 and 14.35, as discussed below.
As an illustration, the cooling tower from Figure 14.4 is again considered. Some key circumferential
and longitudinal modes for a fixed-base boundary condition are shown in Figure 14.35. Also, the
effects of different cornice stiffnesses are demonstrated. This model may be regarded as preliminary
c
1999 by CRC Press LLC
FIGURE 14.22: Meridional forces n
22S
under internal suction.
in that the relatively soft column supports are not properly represented, but it illustrates the salient
characteristics of the modes of vibration. Most interesting are the frequency curves on Figure 14.34
for the first 10 harmonics, also demonstrating the influence of different cornice stiffnesses. Note
that the natural frequencies decrease with increasing n until a minimum is reached whereupon they
increase, a very ty pical behavior for cylindrical-type shells. Also, the stiffening of the cornice tends
to raise the minimum frequency, which is desirable for resistance to dynamic wind. Longitudinally,
the cornice stiffness effect is significant for odd modes only.
Specifically for earthquake effects, only the first mode participates in a linear analysis for uniform
horizontal base motion and the respective values for n =1 should be entered into the design response
spectrum.
Results from a seismic analysis of a cooling tower are presented in Figures 14.36 to 14.39.The
cooling tower of Figure 14.4 is subjected to a horizontal base excitation based on Figure 14.36, leading
to a first circumferential mode (n = 1) participation. A response spect rum analysis provides the
lateral displacements w of the tower axis, the meridional forces n
22
, and the shear forces n
12
as shown
on the indicated figures. In general, cooling tower shells have proven to be reasonably resistant against
seismic excitations, but obviously the most critical region is the connection between the columns
and the lintel as portrayed in Figure 14.40.
14.7 Design and Detailing of Components
The structural elements of the tower should be constructed with a suitable grade of concrete following
the provisions of applicable codes and standards. The design of the mixture should reflect the
conditions for placement of the concrete and the external and internal environment of the tower.
The shell wall should be of a thickness which will permit two layers of reinforcement in two
perpendicular directions to be covered by a minimum of 3 cm of concrete, and should be no less than
16 cm thick [7, 13]. The buckling considerations mentioned in the previous section have proven to
c
1999 by CRC Press LLC
FIGURE 14.23: Circumferential bending moments m
11T
under service temperature.
FIGURE 14.24: Meridional bending moments m
22T
under service temperature.
c
1999 by CRC Press LLC
FIGURE 14.25: Buckling pattern of tower shell with upper ring beam: D +W + S.
FIGURE 14.26: Layered model for reinforced concrete shell.
be a convenient and evidently acceptable criteria for setting the minimum wall thickness, subject to
a nonlinear analysis. The formula
q
c
= 0.052E(h/R)
2.3
(14.8)
where E = modulus of elasticity, has been used to estimate the critical shell buckling pressure
q
c
[1, 13]. Then, h(z) is selected to provide a factor of safety of at least 5.0 with respect to the
maximum velocity pressure along the windward meridian, q(z)(1 + g). Also, the cornice should
have a minimum stiffness of
I
x
/d
H
= 0.0015m
3
(14.9)
where I
x
is the moment of inertia of the uncracked cross-section about the vertical axis [13]. Some
typical forms of the cornice cross-section are shown in Figure 14.41.
c
1999 by CRC Press LLC
FIGURE 14.27: Elasto-plastic material law for steel.
FIGURE 14.28: Biaxial failure envelope of Kupfter/Hilsdorf/R
¨
usch.
The elements of the cooling tower should be reinforced with deformed steel bars so as to provide
for the tensile forces and moments arising from the controlling combination of factored loading
cases. The shell walls may be proportioned as rectangular cross-sections subjected to axial forces and
bending. As mentioned above, a mesh of two orthogonal layers of reinforcement should be provided
in the shell walls, generally in the meridional and circumferential directions [2]. In each direction,
the inner and outer layers should gener ally be the same, except near the edges where the bending may
require an unsymmetrical mesh. It is preferable to locate the circumferential reinforcement outside
of the meridional reinforcement except near the lintel, where the meridional reinforcement should
be on the outside to stabilize the circumferential bars [13]. A typical heavily reinforced segment
of the lintel, also showing the anchorage of the column reinforcement into the shell, is depicted in
Figure 14.42.
A summary of the most important minimum construction values for the shell wall is given in
Figure 14.43 [13]. The bars should not be smaller than 8 mm diameter and, for meridional bars, not
c
1999 by CRC Press LLC