Basic Theory of Plates and Elastic Stability - Part 2 pptx
Bạn đang xem bản rút gọn của tài liệu. Xem và tải ngay bản đầy đủ của tài liệu tại đây (1.01 MB, 189 trang )
Richard Liew, J.Y.; Shanmugam, N.W. and Yu, C.H. “Structural Analysis”
Structural Engineering Handbook
Ed. Chen Wai-Fah
Boca Raton: CRC Press LLC, 1999
Structural Analysis
J.Y. Richard Liew,
N.E. Shanmugam, and
C.H. Yu
Department of Civil Engineering
The National University of
Singapore, Singapore
2.1 Fundamental Principles
2.2 Flexural Members
2.3 Trusses
2.4 Frames
2.5 Plates
2.6 Shell
2.7 Influence Lines
2.8 Energy Methods in Structural Analysis
2.9 Matrix Methods
2.10 The Finite Element Method
2.11 Inelastic Analysis
2.12 Frame Stability
2.13 Structural Dynamic
2.14 Defining Terms
References
Further Reading
2.1 Fundamental Principles
Structural analysis is the determination of forces and deformations of the structure due to applied
loads. Structural desig n involves the arrangement and proportioning of structures and their compo-
nents in such a way that the assembled structure is capable of supporting the designed loads within
the allowable limit states. An analytical model is an idealization of the actual structure. The structural
model should relate the actual behavior to material properties, structural details, and loading and
boundary conditions as accurately as is practicable.
All structures that occur in practice are three-dimensional. For building structures that have
regular layout and are rectangular in shape, it is possible to idealize them into two-dimensional
frames arranged in orthogonal directions. Joints in a structure are those points where two or more
members are connected. A truss is a structural system consisting of members that are designed to
resist only axial forces. Axially loaded members are assumed to be pin-connected at their ends. A
structural system in which joints are capable of transferring end moments is called a frame. Members
in this system are assumed to be capable of resisting bending moment axial force and shear force. A
structure is said to be two dimensional or planar if all the members lie in the same plane. Beams
are those members that are subjected to bending or flexure. They are usually thought of as being
in horizontal positions and loaded with vertical loads. Ties are members that are subjected to axial
tension only, while struts (columns or posts) are members subjected to axial compression only.
c
1999 by CRC Press LLC
2.1.1 Boundary Conditions
A hinge represents a pin connection to a structural assembly and it does not allow translational
movements (Figure 2.1a). It is assumed to be frictionless and to allow rotation of a member with
FIGURE 2.1: Various boundary conditions.
respect to the others. A roller represents a kind of support that permits the attached structural part
to rotate freely with respect to the foundation and to translate freely in the direction parallel to the
foundation surface (Figure 2.1b) No translational movement in any other direction is allowed. A
fixed support (Figure 2.1c) does not allow rotation or translation in any direction. A rotational spring
represents a support that provides some rotational restraint but does not provide any translational
restraint (Figure 2.1d). A translational spring can provide partial restraints along the direction of
deformation (Figure 2.1e).
2.1.2 Loads and Reactions
Loads may be broadly classified as permanent loads that are of constant magnitude and remain in
one position and variable loads that may change in position and magnitude. Permanent loads are
also referred to as dead loads which may include the self weight of the structure and other loads
such as walls, floors, roof, plumbing, and fixtures that are permanently attached to the structure.
Variable loads are commonly referred to as live or imposed loads which may include those caused by
construction operations, wind, rain, earthquakes, snow, blasts, and temperature changes in addition
to those that are movable, such as furniture and warehouse materials.
Ponding load is due to water or snow on a flat roof which accumulates faster than it runs off. Wind
loads act as pressures on windward surfaces and pressures or suctions on leeward surfaces. Impact
loads are caused by suddenly applied loads or by the vibration of moving or movable loads. They
are usually taken as a fraction of the live loads. Earthquake loads are those forces caused by the
acceleration of the ground surface during an earthquake.
A str ucture that is initially at rest and remains at rest when acted upon by applied loads is said to
be in a state of equilibrium. The resultant of the external loads on the body and the supporting forces
or reactions is zero. If a structure or part thereof is to be in equilibrium under the action of a system
c
1999 by CRC Press LLC
of loads, it must satisfy the six static equilibrium equations, such as
F
x
= 0,
F
y
= 0,
F
z
= 0
M
x
= 0,
M
y
= 0,
M
z
= 0 (2.1)
The summation in these equations is for all the components of the forces (F ) and of the moments
(M) about each of the three axes x,y, and z. If a structure is subjected to forces that lie in one plane,
say x-y, the above equations are reduced to:
F
x
= 0,
F
y
= 0,
M
z
= 0 (2.2)
Consider, for example, a beam shown in Figure 2.2a under the action of the loads shown. The
FIGURE 2.2: Beam in equilibrium.
reaction at support B must act perpendicular to the surface on which the rollers are constrained to
roll upon. The support reactions and the applied loads, which are resolved in vertical and horizontal
directions, are shown in Figure 2.2b.
From geometry, it can be calculated that B
y
=
√
3B
x
. Equation 2.2 can be used to determine the
magnitude of the support reactions. Taking moment about B gives
10A
y
− 346.4x5 = 0
from which
A
y
= 173.2 kN.
Equating the sum of vertical forces,
F
y
to zero gives
173.2 + B
y
− 346.4 = 0
and, hence, we get
B
y
= 173.2 kN.
Therefore,
B
x
= B
y
/
√
3 = 100 kN.
c
1999 by CRC Press LLC
Equilibrium in the horizontal direction,
F
x
= 0 gives,
A
x
− 200 − 100 = 0
and, hence,
A
x
= 300 kN.
There are three unknown reaction components at a fixed end, two at a hinge, and one at a roller.
If, for a particular structure, the total number of unknown reaction components equals the number
of equations available, the unknowns may be calculated from the equilibrium equations, and the
structure is then said to be statically determinate ex ternally. Should the number of unknowns be
greater than the number of equations available, the structure is statically indeterminate externally; if
less, it is unstable externally. The ability of a structure to support adequately the loads applied to it
is dependent not only on the number of reaction components but also on the arrangement of those
components. It is possible for a structure to have as many or more reaction components than there
are equations available and yet be unstable. This condition is referred to as geometric instability.
2.1.3 Principle of Superposition
The principle states that if the structural behavior is linearly elastic, the forces acting on a structure
may be separated or divided into any convenient fashion and the structure analyzed for the separate
cases. Then the final results can be obtained by adding up the individual results. This is applicable
to the computation of structural responses such as moment, shear, deflection,etc.
However, there are two situations where the principle of superposition cannot be applied. The
first case is associated with instances where the geometry of the structure is appreciably altered under
load. The second case is in situations where the structure is composed of a material in which the
stress is not linearly related to the strain.
2.1.4 Idealized Models
Any complex structure can be considered to be built up of simpler components called members or
elements. Engineering judgement must be used to define an idealized str ucture such that it represents
the actual structural behavior as accurately as is practically possible.
Structures can be broadly classified into three categories:
1. Skeletal structures consist of line elements such as a bar, beam, or column for which the
length is much larger than the breadth and depth. A variety of skeletal structures can be
obtained by connecting line elements together using hinged, rigid, or semi-rigid joints.
Depending on whether the axes of these members lie in one plane or in different planes,
these structures are termed as plane structures or spatial structures. The line elements in
these structures under load may be subjected to one type of force such as axial force or
a combination of forces such as shear, moment, torsion, and axial force. In the first case
the structures are referred to as the truss-type and in the latter as frame-type.
2. Plated structures consist of elements that have length and breadth of the same order but
are much larger than the thickness. These elements may be plane or curved in plane, in
which case they are called plates or shells, respectively. These elements are generally used
in combination with beams and bars. Reinforced concrete slabs supported on beams,
box-girders, plate-girders, cylindrical shells, or water tanks are typical examples of plate
and shell structures.
3. Three-dimensional solid structures have all three dimensions, namely, length, breadth,
and depth, of the same order. Thick-walled hollow spheres, massive raft foundation, and
dams are typical examples of solid structures.
c
1999 by CRC Press LLC
Recent advancement in finite element methods of structural analysis and the advent of more
powerful computers have enabled the economic analysis of skeletal, plated, and solid structures.
2.2 Flexural Members
One of the most common structural elements is a beam; it bends when subjected to loads acting
transversely to its centroidal axis or sometimes by loads acting both transversely and parallel to this
axis. The discussions given in the following subsections are limited to straight beams in which the
centroidal axis is a straight line with shear center coinciding with the centroid of the cross-section. It
is also assumed that all the loads and reactions lie in a simple plane that also contains the centroidal
axis of the flexural member and the principal axis of every cross-section. If these conditions are
satisfied, the beam w ill simply bend in the plane of loading without twisting.
2.2.1 Axial Force, Shear Force, and Bending Moment
Axial force at any transverse cross-section of a straight beam is the algebraic sum of the components
acting parallel to the axis of the beam of all loads and reactions applied to the portion of the beam
on either side of that cross-section. Shear force at any transverse cross-section of a straight beam is
the algebraic sum of the components acting transverse to the axis of the beam of all the loads and
reactions applied to the portion of the beam on either side of the cross-section. Bending moment at
any transverse cross-section of a straight beam is the algebraic sum of the moments, taken about an
axis passing through the centroid of the cross-section. The axis about which the moments are taken
is, of course, normal to the plane of loading.
2.2.2 Relation Between Load, Shear, and Bending Moment
When a beam is subjected to transverse loads, there exist certain relationships between load, shear,
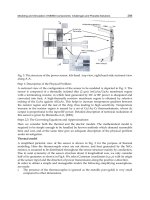
and bending moment. Let us consider, for example, the beam shown in Figure 2.3 subjected to some
arbitr ary loading, p.
FIGURE 2.3: A beam under arbitrary loading.
Let S and M be the shear and bending moment, respectively, for any point ‘m’ at a distance x,
which is measured from A, being positive when measured to the right. Corresponding values of
shear and bending moment at point ‘n’ at a differential distance dx to the right of m are S +dS and
M + dM, respectively. It can be shown, neglecting the second order quantities, that
p =
dS
dx
(2.3)
c
1999 by CRC Press LLC
and
S =
dM
dx
(2.4)
Equation 2.3 shows that the rate of change of shear at any point is equal to the intensity of load
applied to the beam at that point. Therefore, the difference in shear at two cross-sections C and D is
S
D
− S
C
=
x
D
x
C
pdx (2.5)
We can write in the same way for moment as
M
D
− M
C
=
x
D
x
C
Sdx (2.6)
2.2.3 Shear and Bending Moment Diagrams
Inorder to plotthe shearforce andbending momentdiagrams itisnecessary toadopt asign convention
for these responses. A shear force is considered to be positive if it produces a clockwise moment about
a point in the free body on which it acts. A negative shear force produces a counterclockwise moment
about the point. The bending moment is taken as positive if it causes compression in the upper
fibers of the beam and tension in the lower fiber. In other words, sagging moment is positive and
hogging moment is negative. The construction of these diagrams is explained with an example given
in Figure 2.4.
FIGURE 2.4: Bending moment and shear force diagrams.
The section at E of the beam is in equilibrium under the action of applied loads and internal forces
acting at E as shown in Figure 2.5. There must be an internal vertical force and internal bending
moment to maintain equilibrium at Section E. The vertical force or the moment can be obtained as
the algebraic sum of all forces or the algebraic sum of the moment of all forces that lie on either side
of Section E.
c
1999 by CRC Press LLC
FIGURE 2.5: Internal forces.
The shear on a cross-section an infinitesimal distance to the right of point A is +55 k and, therefore,
the shear diagram rises abruptly from 0 to +55 at this point. In the portion AC, since there is no
additional load, the shear remains +55 on any cross-section throughout this interval, and thediagram
is a horizontal as shown in Figure 2.4. An infinitesimal distance to the left of C the shear is +55, but
an infinitesimal distance to the right of this point the 30 k load has caused the shear to be reduced
to +25. Therefore, at point C there is an abrupt change in the shear force from +55 to +25. In the
same manner, the shear force diagram for the portion CD of the beam remains a rectangle. In the
portion DE, the shear on any cross-section a distance x from point D is
S = 55 − 30 − 4x = 25 − 4x
which indicates that the shear diagram in this portion is a straight line decreasing from an ordinate
of +25 atDto+1 at E. The remainder of the shear force diagram can easily be verified in the same
way. It should be noted that, in effect, a concentrated load is assumed to be applied at a point and,
hence, at such a point the ordinate to the shear diagram changes abruptly by an amount equal to the
load.
In the portion AC, the bending moment at a cross-section a distance x from point A is M = 55x.
Therefore, the bending moment diagram starts at 0 at A and increases along a straight line to an
ordinate of +165 k-ft at point C. In the portion CD, the bending moment at any point a distance x
fromCisM = 55(x + 3) − 30x. Hence, the bending moment diagram in this portion is a straight
line increasing from 165 at C to 265 at D. In the portion DE, the bending moment at any point a
distance x fromDisM = 55(x + 7) − 30(X + 4
) − 4x
2
/2. Hence, the bending moment diagram
in this portion is a curve with an ordinate of 265 at D and 343 at E. In an analogous manner, the
remainder of the bending moment diagram can be easily constructed.
Bending moment and shearforce diagrams for beams with simple boundary conditions and subject
to some simple loading are given in Figure 2.6.
2.2.4 Fix-Ended Beams
When the ends of a beam are held so firmly that they are not free to rotate under the action of applied
loads, the beam is known as a built-in or fix-ended beam and it is statically indeterminate. The
bending moment diagram for such a beam can be considered to consist of two parts, namely the free
bending moment diagram obtained by treating the beam as if the ends are simply supported and the
fixing moment diagram resulting from the restraints imposed at the ends of the beam. The solution
of a fixed beam is greatly simplified by considering Mohr’s principles which state that:
1. the area of the fixingbendingmoment diag ram is equal to that of the free bending moment
diagram
2. the centers of gravity of the two diagrams lie in the same vertical line, i.e., are equidistant
from a given end of the beam
The construction of bending moment diagram for a fixed beam is explained with an example
shown in Figure 2.7. PQUTisthefreebending moment diagram, M
s
,andPQRSisthefixing
c
1999 by CRC Press LLC
FIGURE 2.6: Shear force and bending moment diagrams for beams with simple boundary conditions
subjected to selected loading cases.
c
1999 by CRC Press LLC
FIGURE 2.6: (Continued) Shear force and bending moment diagrams for beams with simple bound-
ar y conditions subjected to selected loading cases.
c
1999 by CRC Press LLC
FIGURE 2.6: (Continued) Shear force and bending moment diagrams for beams with simple bound-
ar y conditions subjected to selected loading cases.
c
1999 by CRC Press LLC
FIGURE 2.7: Fixed-ended beam.
moment diagram, M
i
. The net bending moment diagram, M, is shown shaded. If A
s
is the area of
the free bending moment diagram and A
i
the area of the fixing moment diag ram, then from the first
Mohr’s principle we have A
s
= A
i
and
1
2
×
Wab
L
× L =
1
2
(M
A
+ M
B
) × L
M
A
+ M
B
=
Wab
L
(2.7)
From the second principle, equating the moment about A of A
s
and A
i
,wehave,
M
A
+ 2M
B
=
Wab
L
3
2a
2
+ 3ab + b
2
(2.8)
Solving Equations 2.7 and 2.8 for M
A
and M
B
,weget
M
A
=
Wab
2
L
2
M
B
=
Wa
2
b
L
2
Shear force can be determined once the bending moment is known. The shear force at the ends of
the beam, i.e., at A and B are
S
A
=
M
A
− M
B
L
+
Wb
L
S
B
=
M
B
− M
A
L
+
Wa
L
Bending moment and shear force diagrams for some typical loading cases are shown in Figure 2.8.
2.2.5 Continuous Beams
Continuous beams, like fix-ended beams, are statically indeterminate. Bending moments in these
beams are functions of the geometry, moments of inertia and modulus of elasticity of individual
members besides the load and span. They may be determined by Clapeyron’s Theorem of three
moments, moment distribution method, or slope deflection method.
c
1999 by CRC Press LLC
FIGURE 2.8: Shear force and bending moment diag rams for built-up beams subjected to ty pical
loading cases.
c
1999 by CRC Press LLC
FIGURE 2.8: (Continued) Shear force and bending moment diagrams for built-up beams subjected
to ty pical loading cases.
An example of a two-span continuous beam is solved by Clapeyron’s Theorem of three moments.
The theorem is applied to two adjacent spans at a time and the resulting equations in terms of
unknown support moments are solved. The theorem states that
M
A
L
1
+ 2M
B
(L
1
+ L
2
) + M
C
L
2
= 6
A
1
x
1
L
1
+
A
2
x
2
L
2
(2.9)
in which M
A
,M
B
, and M
C
are the hogging moment at the supports A, B, and C, respectively, of two
adjacent spans of length L
1
and L
2
(Figure 2.9); A
1
and A
2
are the area of bending moment diagrams
produced by the vertical loads on the simple spans AB and BC, respectively; x
1
is the centroid of A
1
from A, and x
2
is the distance of the centroid of A
2
from C. If the beam section is constant within a
FIGURE 2.9: Continuous beams.
c
1999 by CRC Press LLC
span but remains different for each of the spans, Equation 2.9 can be written as
M
A
L
1
I
1
+ 2M
B
L
1
I
1
+
L
2
I
2
+ M
C
L
2
I
2
= 6
A
1
x
1
L
1
I
1
+
A
2
x
2
L
2
I
2
(2.10)
in which I
1
and I
2
are the moments of inertia of beam section in span L
1
and L
2
, respectively.
EXAMPLE 2.1:
The example in Figure 2.10 shows the application of this theorem. For spans AC and BC
FIGURE 2.10: Example—continuous beam.
M
A
× 10 + 2M
C
(10 + 10) + M
B
× 10
= 6
1
2
× 500 × 10 × 5
10
+
2
3
× 250 × 10 × 5
10
Since the support at A is simply supported, M
A
= 0. Therefore,
4M
C
+ M
B
= 1250 (2.11)
Considering an imaginary span BD on the right side of B, and applying the theorem for spans CB
and BD
M
C
× 10 + 2M
B
(10) + M
D
× 10 = 6 ×
(2/3)×10×5
10
× 2
M
C
+ 2M
B
= 500 (because M
C
= M
D
) (2.12)
Solving Equations 2.11 and 2.12 we get
M
B
= 107.2 kNm
M
C
= 285.7 kNm
c
1999 by CRC Press LLC
Shear force at A is
S
A
=
M
A
− M
C
L
+ 100 =−28.6 + 100 = 71.4 kN
Shear force at C is
S
C
=
M
C
− M
A
L
+ 100
+
M
C
− M
B
L
+ 100
= (28.6 + 100) + (17.9 + 100) = 246.5 kN
Shear force at B is
S
B
=
M
B
− M
C
L
+ 100
=−17.9 + 100 = 82.1 kN
The bending moment and shear force diagrams are shown in Figure 2.10.
2.2.6 Beam Deflection
Thereare several methodsfordetermining beamdeflections: (1) moment-areamethod, (2) conjugate-
beam method, (3) vi rtual work, and (4) Castigliano’s second theorem, among others.
The elastic curve of a member is the shape the neutral axis takes when the member deflects under
load. The inverse of the radius of curvature at any point of this curve is obtained as
1
R
=
M
EI
(2.13)
in which M is the bending moment at the point and EI is the flexural rigidity of the beam section.
Since the deflection is small,
1
R
is approximately taken as
d
2
y
dx
2
, and Equation 2.13 may be rewritten
as:
M = EI
d
2
y
dx
2
(2.14)
In Equation 2.14, y is the deflection of the beam at distance x measured from the origin of
coordinate. The change in slope in a distance dx can be expressed as Mdx/EI and hence the slope
in a beam is obtained as
θ
B
− θ
A
=
B
A
M
EI
dx
(2.15)
Equation 2.15 may be stated as the change in slope between the tangents to the elastic curve at two
points is equal to the area of the M/EI diagram between the two points.
Once the change in slope between tangents to the elastic curve is determined, the deflection can
be obtained by integrating further the slope equation. In a distance dx the neutral axis changes in
direction by an amount dθ. T he deflection of one point on the beam with respect to the tangent at
another point due to this angle change is equal to dδ = xdθ,wherex is the distance from the point
at which deflection is desired to the particular differential distance.
To determine the total deflection from the tangent at one point A to the tangent at another point
B on the beam, it is necessary to obtain a summation of the products of each dθ angle (from A to B)
times the distance to the point where deflection is desired, or
δ
B
− δ
A
=
B
A
Mx dx
EI
(2.16)
The deflection of a tangent to the elastic curve of a beam with respect to a tangent at another point
is equal to the moment of M/EI diagram between the two points, taken about the point at which
deflection is desired.
c
1999 by CRC Press LLC
Moment Area Method
Moment area method is most conveniently used for determining slopes and deflections for
beams in which the direction of the tangent to the elastic curve at one or more points is known,
such as cantilever beams, where the tangent at the fixed end does not change in slope. The method
is applied easily to beams loaded with concentrated loads because the moment diagrams consist
of straight lines. These diagrams can be broken down into sing le triangles and rectangles. Beams
supporting uniform loads or uniformly varying loads may be handled by integration. Properties of
some of the shapes of
M
EI
diagrams designers usually come across are given in Figure 2.11.
FIGURE 2.11: Typical M/EI diagram.
It should be understood that the slopes and deflections that are obtained using the moment area
theorems are with respect to tangents to the elastic curve at the points being considered. The theorems
do not directly give the slope or deflection at a point in the beam as compared to the horizontal axis
(except in one or two special cases); they give the change in slope of the elastic curve from one
point to another or the deflection of the tangent at one point with respect to the tangent at another
point. There are some special cases in which beams are subjected to several concentrated loads or
the combined action of concentrated and uniformly distributed loads. In such cases it is advisable
to separate the concentrated loads and uniformly distributed loads and the moment area method
can be applied separately to each of these loads. The final responses are obtained by the principle of
superposition.
For example, consider a simply supported beam subjected to uniformly distributed load q as shown
in Figure 2.12. The tangent to the elastic curve at each end of the beam is inclined. The deflection δ
1
of the tangent at the left end from the tangent at the right end is found as ql
4
/24EI. The distance
from the original chord between the supports and the tangent at right end, δ
2
, can be computed as
ql
4
/48EI. The deflection of a tangent at the center from a tangent at right end, δ
3
, is determined in
this step as
ql
4
128EI
. The difference between δ
2
and δ
3
gives the centerline deflection as
5
384
ql
4
EI
.
c
1999 by CRC Press LLC
FIGURE 2.12: Deflection-simply supported beam under UDL.
2.2.7 Curved Flexural Members
The flexural formula is based on the assumption that the beam to which bending moment is applied is
initially straight. Many members, however, are curved before a bending moment is applied to them.
Such members are called curved beams. It is important to determine the effect of initial curvature
of a beam on the stresses and deflections caused by loads applied to the beam in the plane of initial
curvature. In the following discussion, all the conditions applicable to st raight-beam formula are
assumed valid except that the beam is initially curved.
Let the curved beam DOE shown in Figure 2.13 be subjected to the loads Q. T he surface in which
the fibers do not change in length is called the neutral surface. The total deformations of the fibers
between two normal sections such as AB and A
1
B
1
are assumed to vary proportionally with the
distances of the fibers from the neutra l surface. The top fibers are compressed while those at the
bottom are stretched, i.e., the plane section before bending remains plane after bending.
In Figure 2.13 the two lines AB and A
1
B
1
are two normal sections of the beam before the loads
are applied. The change in the length of any fiber between these two normal sections after bending
is represented by the distance along the fiber between the lines A
1
B
1
and A
B
; the neutral surface is
represented by NN
1
, and the stretch of fiber PP
1
is P 1P
1
, etc. For convenience it will be assumed
that the line AB is a line of symmetry and does not change direction.
The total deformations ofthefibers in thecurved beamare proportional to thedistances ofthefibers
from the neutral surface. However, the strains of the fibers are not proportional to these distances
because the fibers are not of equal length. Within the elastic limit the stress on any fiber in the beam
is proportional to the strain of the fiber, and hence the elastic stresses in the fibers of a curved beam
are not proportional to the distances of the fibers from the neutral surface. The resisting moment in
a curved beam, therefore, is not given by the expression σI/c. Hence, the neutral axis in a curved
beam does not pass through the centroid of the section. The distribution of stress over the section
and the relative position of the neutral axis are shown in Figure 2.13b; if the beam were straight, the
stress would be zero at the centroidal axis and would vary proportionally with the distance from the
c
1999 by CRC Press LLC
FIGURE 2.13: Bending of curved beams.
centroidal axis as indicated by the dot-dash line in the figure. The stress on a normal section such as
AB is called the circumferential stress.
Sign Conventions
The bending moment M is positive when it decreases the radius of curvature, and negative
when it increases the radius of curvature; y is positive when measured toward the convex side of the
beam, and negative when measured toward the concave side, that is, toward the center of curvature.
With these sign conventions, σ is positive when it is a tensile stress.
Circumferential Stresses
Figure 2.14 shows a free body diagram of the portion of the body on one side of the section;
the equations of equilibrium are applied to the forces acting on this portion. The equations obtained
are
F
z
= 0 or
σda = 0 (2.17)
M
z
= 0 or M =
yσda (2.18)
Figure 2.15 represents the part ABB
1
A
1
of Figure 2.13a enlarged; the angle between the two
sections AB and A
1
B
1
is dθ. The bending moment causes the plane A
1
B
1
to rotate through an angle
dθ, thereby changing the angle this plane makes with the plane BAC from dθ to (dθ + dθ); the
center of curvature is changed from C to C
, and the distance of the centroidal axis from the center
of curvature is changed from R to ρ. It should be noted that y, R, and ρ at any section are measured
from the centroidal axis and not from the neutral axis.
It can be show n that the bending stress σ is given by the relation
σ =
M
aR
1 +
1
Z
y
R + y
(2.19)
in which
Z =−
1
a
y
R + y
da
σ is the tensile or compressive (circumferential) stress at a point at the distance y from the centroidal
axis of a transverse section at which the bending moment is M; R is the distance from the centroidal
c
1999 by CRC Press LLC
FIGURE 2.14: Free-body diagram of curved beam segment.
FIGURE 2.15: Curvature in a curved beam.
axis of the section to the center of curvature of the central axis of the unstressed beam; a is the area of
the cross-section; Z is a property of the cross-section, the values of which can be obtained from the
expressions for various areas given in Table 2.1. Detailed information can be obtained from [51].
EXAMPLE 2.2:
The bent bar shown in Figure 2.16 issubjectedtoaloadP = 1780 N. Calculate the circumferential
stress at A and B assuming that the elastic strength of the material is not exceeded.
We know from Equation 2.19
σ =
P
a
+
M
aR
1 +
1
Z
y
R + y
c
1999 by CRC Press LLC
TABLE 2.1 Analytical Expressions for Z
c
1999 by CRC Press LLC
TABLE 2.1 Analytical Expressions for Z (continued)
c
1999 by CRC Press LLC
TABLE 2.1 Analytical Expressions for Z (continued)
From Seely, F.B. and Smith, J.O., Advanced Mechanics of Materials, John Wiley & Sons, New York, 1952. With permission.
c
1999 by CRC Press LLC
FIGURE 2.16: Bent bar.
in which
a = area of rectangular section = 40 × 12 = 480 mm
2
R = 40 mm
y
A
=−20
y
B
=+20
P = 1780 N
M =−1780 × 120 =−213600 Nmm
From Table 2.1, for rectangular section
Z =−1 +
R
h
log
e
R + c
R − c
h = 40 mm
c = 20 mm
Hence,
Z =−1 +
40
40
log
e
40 + 20
40 − 20
= 0.0986
Therefore,
σ
A
=
1780
480
+
−213600
480×40
1 +
1
0.0986
−20
40−20
= 105.4 Nmm
2
(tensile)
σ
B
=
1780
480
+
−213600
480×40
1 +
1
0.0986
20
40+20
=−45 Nmm
2
(compressive)
2.3 Trusses
A structure that is composed of a number of bars pin connected at their ends to form a stable
framework is called a truss. If all the bars lie in a plane, the structure is a planar truss. It is generally
assumed that loads and reactions are applied to the t russ only at the joints. The centroidal axis of each
member is straight, coincides with the line connecting the joint centers at each end of the member,
and lies in a plane that also contains the lines of action of all the loads and reactions. Many truss
structures are three dimensional in nature and a complete analysis would require consideration of the
full spatial interconnection of the members. However, in many cases, such as bridge structures and
simple roof systems, the three-dimensional framework can be subdivided into planar components
for analysis as planar trusses without seriously compromising the accuracy of the results. Figure 2.17
shows some typical idealized planar truss structures.
c
1999 by CRC Press LLC
FIGURE 2.17: Typical planar trusses.
There exists a relation between the number of members, m, number of joints, j, and reaction
components, r. The expression is
m = 2j − r
(2.20)
which must be satisfied if it is to be statically determinate internally. T he least number of reaction
components required for external stability is r.Ifm exceeds (2j − r), then the excess members are
called redundant members and the truss is said to be statically indeterminate.
Truss analysis gives the bar forces in a truss; for a statically determinate truss, these bar forces can
be found by employing the laws of statics to assure internal equilibrium of the structure. The process
requires repeated use of free-body diagrams from which individual bar forces are determined. The
method of joints is a technique of truss analysis in which the bar forces are determined by the sequential
isolation of joints—the unknown bar forces at one joint are solved and become known bar forces at
subsequent joints. The other method is known as method of sections in which equilibrium of a part
of the truss is considered.
2.3.1 Method of Joints
An imaginary section may be completely passed around a joint in a truss. The joint has become a
free body in equilibrium under the forces applied to it. The equations
H = 0 and
V = 0 may
be applied to the joint to determine the unknown forces in members meeting there. It is evident that
no more than two unknowns can be determined at a joint with these two equations.
c
1999 by CRC Press LLC