Muller A History of Thermodynamics The Doctrine of Energy and Entropy phần 6 ppt
Bạn đang xem bản rút gọn của tài liệu. Xem và tải ngay bản đầy đủ của tài liệu tại đây (982.5 KB, 34 trang )
Socio-thermodynamics 159
of Friedrich Karl Rudolf Bergius (1884–1949),
41
who had studied catalytic
high-pressure chemistry under Nernst and Haber. He developed the Bergin
process to combine coal and hydrogen at high pressure and high
temperature. Huge hydrogenation plants were built in Germany to supply
the Wehrmacht, the German armed forces. Strangely enough the Allied
Bomber Command overlooked the strategic importance of these vulnerable
plants – 54 of them – until well into 1944. Then they were bombed and
destroyed in May 1944.
42
Fuel became very scarce indeed after that, and soon the vehicles of the
German army were converted for the use of wood-gas, a comparatively
low-tech application of mass action: Wood was burned with an insufficient air
supply in a barrel-shaped furnace – that was loaded into the trunk –, and
the resulting carbon monoxide was fed into the motor. I remember from my
childhood that, half-way up even moderate hills, the drivers had to stop and
stoke before they could proceed. Obviously this would not do for airplanes.
Socio-thermodynamics
On several occasions in previous chapters I have hinted at the usefulness of
thermodynamic concepts in remote areas, i.e. fields that have little or
nothing to do with thermodynamics at first sight. Those hints would be
wanton remarks unless I corroborated them somehow, in order to acquaint
the reader with the spirit of extrapolation away from thermodynamics
proper. To be sure, most such subjects belong more to the future of
thermodynamics rather than to its history. They are struggling to be taken
seriously, and to obtain admission into the field. But anyway, let us
consider the non-trivial proposition which has been called socio-
thermodynamics. It extends the concepts described above for the
construction of phase diagrams in binary solutions to a mixed population of
hawks and doves with a choice of different contest strategies.
We let ourselves be motivated by an often discussed model of game
theory
43
for a mixed population of hawks and doves who compete for the
41
Bergius shared the 1931 Nobel prize with Karl Bosch, Haber’s colleague and assistant in
the Haber-Bosch synthesis of ammonia.
42
According to A. Galland: “Die Ersten und die Letzten, die Jagdflieger im Zweiten
Weltkrieg.” [The first and the last, fighter pilots in World War II] Verlag Schneekluth,
Augsburg (1953).
Adolf Galland was himself a highly decorated fighter pilot before he was given an office
job; he became the last inspector of the Luftwaffe in the war and then the first inspector of
the after-war Luftwaffe in 1956.
43
P.D. Straffin: “Game Theory and Strategy.” New Mathematical Library. The
J. Maynard-Smith, G.R. Price: “The logic of animal conflict.” Nature 246 (1973).
Mathematical Association of America 36 (1993).
160 5 Chemical Potentials
same resource, whose value, or price, is denoted by IJ. Prices are out of
control for the birds, but they must be taken into account by them. Indeed,
in their competition the birds may assume different strategies A or B which
we define as follows.
Strategy A
If two hawks meet over the resource, they fight until one is injured. The winner
gains the value IJ, while the loser, being injured, needs time for healing his wounds.
Let that time be such that the hawk must buy 2 resources, worth 2IJ to feed himself
during convalescence. Two doves do not fight. They merely engage in a symbolic
conflict, posturing and threatening, but not actually fighting. One of them will
eventually win the resource – always with the value IJ – but on average both lose
time such that after every dove-dove encounter they need to catch up by buying
part of a resource, worth 0.2IJ. If a hawk meets a dove, the dove walks away, while
the hawk wins the resource; there is no injury, nor is any time lost.
Assuming that winning and losing the fights or the posturing game is
equally probable, we conclude that the elementary expectation values for
the gain per encounter are given by the arithmetic mean values of the gains
in winning and losing, i.e.
e
A
HH
= 0.5 (IJ – 2 IJ) = - 0.5 IJ
e
A
HD
= IJ
e
A
DH
= 0
e
A
DD
= 0.5 IJ – 0.2 IJ = 0.3 IJ
for the four possible encounters HH, HD, DH, and DD.
Note that both, the fighting of the hawks and the posturing of the doves,
are irrational acts, or luxuries. Indeed both species would do better, if they
cut down in these activities, or abandoned them altogether. Also the
meekness of the doves confronted with a hawk may be regarded as
overcautious. Such observations have let to the formulation of strategy B.
Strategy B
The hawks adjust the severity of the fighting – and thus the gravity of the injury –
to the prevailing price IJ. If the price of the resource is higher than 1, they fight less,
so that the time of convalescence in case of a defeat is shorter and the value to be
bought during convalescence is reduced from 2IJ to 2IJ(1-0.2(IJ – 1)). Likewise the
The issue in these presentations is the proof that a mixed population of two species may be
evolutionarily stable, if the species follow the proper contest strategy. In the present
account of socio-thermodynamics the objective is different: No evolution is allowed but
two different strategies may be chosen which both depend on the price of the contested
resource.
161
doves adjust the duration of the posturing, so that the payment for lost time is
reduced from 0.2IJ to 0.2IJ (1 – 0.3(IJ – 1)). But that is not all: To be sure, in strategy
B the doves will still not fight when they find themselves competing with a hawk,
but they will try to grab the resource and run. Let them be successful 4 out of 10
times. However, if unsuccessful, they risk injury from the enraged hawk and may
need a period of convalescence at the cost 2IJ (1 + 0.5(IJ – 1)).
Thus the elementary expectation values for gains under strategy B may
be written as
e
B
HH
= 0.5(IJ – 2 IJ(1 – 0.2(IJ – 1))) = (0.2 IJ – 0.7) IJ
e
B
HD
= 0.6 IJ
e
B
DH
= 0.4 IJ – 0.6·2 IJ (1 + 0.5(IJ – 1)) = –(0.6 IJ + 0.2) IJ
e
B
DD
e
i
H
= z
H
e
i
HH
+ (1 – z
H
) e
i
HD
and e
i
D
= z
H
e
i
DH
+ (1 – z
H
) e
i
DD
in terms of the elementary expectation values. And the gain expectations e
i
for strategy i per bird and per encounter reads
44
Such a constraint could be avoided, if we allowed non-linear penalty reductions which, for
simplicity, we do not.
= 0.5 IJ – 0.2 IJ (1 – 0.3(IJ – 1)) = (0.06 IJ + 0.24) IJ .
Socio-thermodynamics
The assignment of numbers is always a problem in game theory. Here the
numbers have been chosen so as to fit a conceivable idea of the behaviour
of the species. Let us consider this:
The grab-and-run policy is clearly not a wise one for the doves, because they get
punished for it. So, why do they adopt that policy? We may explain that by
assuming, that doves are no wiser than people, who start a war with the expectation
of a quick gain and then meet disaster. This has happened often enough in history.
Note that for IJ
>1 the intra-species penalties for either fighting or posturing become
smaller, because we have assumed that these activities are reduced when their
execution becomes more expensive. However, the interspecies penalty – the injury
of the doves – increases, because the hawks will exert more violence against the
impertinent doves when the stolen resource is more valuable.
IJ = 1 is a reference price in which both strategies coincide, except for the grab-and-
run feature of strategy B. Penalties for either fighting or posturing should never turn
into rewards for whatever permissible value of IJ. This condition imposes a
constraint on the permissible values of IJ: 0< IJ<4.33.
44
Now, let z
H
and z
D
= 1 – z
H
be the fractions of hawks and doves, and let all
hawks and doves either employ strategy A or B. Therefore the gain
expectations e
i
H
and e
i
D
(i = A,B) of a hawk and a dove per encounter with
another bird may be written as
162 5 Chemical Potentials
e
i
= z
H
e
i
H
+ (1 – z
H
) e
i
D
or explicitly
e
i
= z
H
2
(e
i
HH
+ e
i
DD
– e
i
HD
– e
i
DH
) + z
H
(e
i
HD
+ e
i
DH
– 2 e
i
DD
) + e
i
DD
.
Specifically we have
e
A
= –1,2 IJ z
H
2
+ 0.4 IJ z
H
+ 0.3
e
B
= 0.86 IJ (IJ – 1) z
H
2
– (0.72IJ + 0.08)IJ z
H
+ (0.06 IJ + 0.24)IJ.
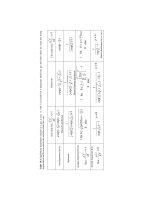
The graphs of these functions are parabolae which – for some values of
IJ – are plotted in Fig. 5.9.a–e.
Fig. 5.9. Expectation values as functions of z
H
for some values of the price IJ.
The interpretation of those graphs is contingent on the reasonable
assumption that the population chooses the strategy that provides the
maximal gain expectation. Obviously for IJ = 0.6 and IJ = 1 that strategy is
strategy A. At that price level the hawks and doves will therefore all choose
strategy A irrespective of the hawk fraction z
H
in the population.
For higher price levels the situation is more subtle, because the graph
max[e
A
, e
B
] is not concave. This provides the possibility of concavification,
cf. Fig. 5.9.c–e. There are intervals of z
H
where the concave envelope of
max[e
A
, e
B
] lies higher than that graph itself. The population then has the
possibility to increase the expected gain by un-mixing; it segregates into
Concavification. Strategy diagram
163
homogeneous colonies with hawk fractions corresponding to the end-points
of the concavifying straight lines, which are dashed in the figures. In
Figs. 5.9c,d the adopted strategies are A and B and the species are mixed in
the colony with strategy A, whereas the colony with strategy B is pure-dove
or pure-hawk, depending on whether the extant overall hawk fraction lies
below the left, or right tangent respectively. For IJ > 3.505 the concave
envelope connects the end-points of the parabolae e
B
so that hawks and
doves are fully segregated in two colonies, both employing strategy B.
Mutatis mutandis all this is strongly reminiscent of the considerations of
phase diagrams of solutions or alloys with a miscibility gap, see above at
Fig. 5.6. To be sure, there we minimized Gibbs free energies whereas here
we maximize gain. Accordingly in solutions we convexify the graph
max[Gƍ,GƎ] whereas her we concavify the graph max[e
A
, e
B
], but those are
superficial differences. And just as we constructed phase diagrams before,
we may now construct a strategy diagram by projecting the concavifying
lines unto the appropriate horizontal line in a (price, hawk fraction)-dia-
gram, cf. Fig. 5.9f. We recognize four regions in that diagram.
x I: Full integration of species employing strategy A.
x II: Colony of pure doves with strategy B and integrated colony of
hawks and doves with strategy A. Partial segregation.
x III: Colony of pure hawks with strategy B and integrated colony with
strategy A. Partial segregation.
x IV: Colonies of pure doves and pure hawks. Full segregation.
The curves separating the regions II and III from region I can easily be
calculated:
IJ = 20 z
H
2
+ 1 and IJ = 6 z
H
2
– 12 z
H
+ 7
respectively. Those two curves intersect in the eutectic point E, so called in
analogy to thermodynamics.
Although the analogy between our sociological model and thermo-
dynamics of solutions is fairly striking, there are differences. In particular,
the present strategy diagram lacks the lateral regions, denoted by a and b in
Fig. 5.6. This is due to the fact that we have not accounted for an entropy of
mixing in the present case. For socio-thermodynamics in full – including
the entropy of mixing – I refer to my recent article “Socio-thermodynamics
– integration and segregation in a population.”
45
In that paper the analogy is
fully developed, including first and second laws of socio-thermodynamics,
and with the proper interpretations of working and heating etc.
46
45
46
The simplified presentation given above follows a paper by J. Kalisch, I. Müller:
“Strategic and evolutionary equilibria in a population of hawks and doves.” Rendiconti del
Circolo Matematico in Palermo, Serie II, Supplemento 78 (2006), pp. 163–171.
I. Müller: Continuum Mechanics and Thermodynamics 14 (2002) pp. 389 404.
Socio-thermodynamics
164 5 Chemical Potentials
The upshot of the present investigation is that, if integration of species –
or, perhaps, ethnic groups – is desired and segregation is to be avoided,
political leaders should provide for low prices, if they can. In good times
integration is no problem, but in bad times segregation is likely to occur.
We all know that. But here is a mathematical representation of the fact
with – conceivably – the possibility for a quantification of parameters.
The analogy of segregation in a population and the miscibility gap in
solutions and alloys has been noticed before by Jürgen Mimkes, a metal-
lurgist.
47
His approach is more phenomenological than mine, without a
model from game theory. Mimkes has studied the integration and segrega-
tion of protestants and catholics in Northern Ireland, and he came to
interesting conclusions about mixed marriages.
It is interesting to note that socio-thermodynamics is only accessible to
chemical engineers and metallurgists. These are the only people who know
phase diagrams and their usefulness. It cannot be expected, in our society,
that sociologists will appreciate the potential of these ideas. They have
never seen a phase diagram in their lives.
That paper also includes evolutionary processes, which make the hawk fraction change so
that the population may eventually reach the evolutionarily stable strategy appropriate to
the price level IJ.
47
Analysis 43 (1995).
J. Mimkes: “Binary alloys as a model for a multicultural society.” Journal of Thermal
6 Third Law of Thermodynamics
In cold bodies the atoms find potential energy barriers difficult to surmount,
because the thermal motion is weak. That is the reason for liquefaction and
solidification when the intermolecular van der Waals forces overwhelm the
free-flying gas atoms. If the temperature tends to zero, no barriers –
however small – can be overcome so that a body must assume the state of
lowest energy. No other state can be realized and therefore the entropy must
be zero. That is what the third law of thermodynamics says.
On the other hand cold bodies have slow atoms and slow atoms have
large de Broglie wave lengths so that the quantum mechanical wave
character may create macroscopic effects. This is the reason for gas-
degeneracy which is, however, often disguised by the van der Waals forces.
In particular, in cold mixtures even the smallest malus for the formation
of unequal next neighbours prevents the existence of such unequal pairs and
should lead to un-mixing. This is in fact observed in a cold mixture of
liquid He
3
and He
4
. In the process of un-mixing the mixture sheds its
entropy of mixing. Obviously it must do so, if the entropy is to vanish.
Let us consider low-temperature phenomena in this chapter and let us
record the history of low-temperature thermodynamics and, in particular, of
the science of cryogenics, whose objective it is to reach low temperatures.
The field is currently an active field of research and lower and lower
temperatures are being reached.
Capitulation of Entropy
It may happen – actually it happens more often than not – that a chemical
reaction is constrained. This means that, at a given pressure p, the reactants
persist at temperatures where, according to the law of mass action, they
should long have been converted into resultants; the Gibbs free energy g is
lower for the resultants than for the reactants, and yet the resultants do nor
form. We may say that the mixture of reactants is under-cooled,orover-
heated depending on the case. As we have understood on the occasion of
the ammonia synthesis, the phenomenon is due to energetic barriers which
must be overcome – or bypassed – before the reaction can occur. The
bypass may be achieved by an appropriate catalyst.
166 6 Third Law of Thermodynamics
An analogous behaviour occurs in phase transitions,
1
mostly in solids: It
may happen that there exist different crystalline lattice structures in the
same substance, one stable and one meta-stable, i.e. as good as stable or,
anyway, persisting nearly indefinitely. Hermann Walter Nernst (1864–
1941) studied such cases, particularly for low and lowest temperatures.
Take tin for example. Tin, or pewter, as white tin is a perfectly good
metal at room temperature – with a tetragonal lattice structure – popular for
tin plates, pewter cups, organ pipes, or toy soldiers.
2
Kept at 13.2°C and
1atm, white tin crumbles into the unattractive cubic grey tin in a few hours.
However, if it is not given the time, white tin is meta-stable below 13.2°C
and may persist virtually forever.
3
It is for a pressure of 1atm that the phase equilibrium occurs at 13.2°C.
At other pressures that temperature is different and we denote it by T
wļg
(p);
its value is known for all p. At that temperature ǻg = g
w
– g
g
vanishes, and
below we have g
w
> g
g
, so that grey tin is the stable phase. ǻg may be
considered as the frustrated driving force for the transition and it is
sometimes called the affinity of the transition. It depends on T and p and has
two parts
ǻg(T,p) = ǻh(T,p) – T·ǻs(T,p),
an energetic and an entropic one.
ǻh(T,p) is the latent heat of the transition and ǻs(T,p) is the entropy
change.
4
For any given p the latent heat ǻh(T,p) can be measured as a
function of T by encouraging the transition catalytically, e.g. by doping
white tin with a small amount of grey tin. And ǻs(T,p) may be calculated by
integration of c
p
(T,p)/T of both variants, white and grey, between T = 0, – or
as low as possible – and the extant T. Thus we have
°
¿
°
¾
½
°
¯
°
®
W
³
W
W
W
³
W
W
' ' d
T
p
g
p
c
p
g
sd
T
p
w
p
c
p
w
sTpThpTg
0
),(
),0(
0
),(
),0(),(),(
1
From the point of view of thermodynamics phase transitions are much like chemical
reactions, although the phenomena differ in appearance. One might go so far as to say that
phase transitions are chemical reactions of a particularly simple type.
2
In ancient times tin was much in demand because, alloyed to copper, it provided bronze,
the relatively hard material used for weapons, tools, and beads and baubles in the bronze
age (sic).
3
Not so, however, when it coexists with previously formed traces of grey tin. If that is the
case, tin appliances are affected by the tin disease at low temperature. A church may lose
its organ pipes in a short time, and that loss did in fact occur during a cold winter night in
St. Petersburg in the 19th century.
4
Note that the heat and entropy of transition depend on T and p, if the transition occurs in
the under-cooled range. If it occurs at the equilibrium point, both quantities depend only
on one variable, since T = T
wļg
(p) holds at that point.
Inaccessibility of Absolute Zero 167
would even be true, if the specific heats c
p
(T,p) were constant for T ĺ 0. In
already ample evidence that all specific heats tend to zero polynomially,
with Tĺ0, e.g. as (a·T
3
) for non-conductors, or as (a·T
3
+b·T) for
conductors. Given this observation, the integrals in ǻs(T,p) themselves tend
to zero, and the curly bracket reduces to s
w
(0,p) – s
g
(0,p). This difference
may be related to the heat of transition ǻh(T
wļg
(p)) at the equilibrium point,
because in phase equilibrium we have ǻg(T
wļg
(p)) = 0, or
or
)(
))((
))(())((
pT
pTh
pTspTs
gw
gw
gwggww
l
l
ll
'
.
),(),(
)(
))((
),0(),0(
)(
0
W
W
WW'
d
pcpc
pT
pTh
psps
pT
g
p
w
p
gw
gw
gw
gw
³
l
l
l
From some measurements Nernst convinced himself that this express-
ion – which after all is equal to ǻs(T,p) for T ĺ 0 – is zero, irrespective of
the pressure p, and for all transitions.
5
So he came to pronounce his law or
theorem which we may express by saying that the entropies of different
phases of a crystalline body become equal for T ĺ 0, irrespective of the
lattice structure. Moreover, they are independent of the pressure p.
This became known as the third law of thermodynamics.
We recall Berthelot, who had assumed the affinity to be given by the heat
of transition. And we recall Helmholtz, who had insisted that the
contribution of the entropy of the transition must not be neglected.
Helmholtz was right, of course, but the third law provides a low-
temperature niche for Berthelot: Not only does T·ǻs(T,p) go to zero, ǻs(T,p)
itself goes to zero. The entropy capitulates to low temperature and gives up
its efficacy to influence reactions and transitions.
Inaccessibility of Absolute Zero
In 1912 Nernst pointed out that absolute zero could not be reached because
of the third law.
6
Indeed, since s(T,p) tends to the same value for T ĺ 0
irrespective of pressure, the graphs for different p’s must look qualitatively
5
W. Nernst: “Über die Berechnung chemischer Gleichgewichte aus thermodynamischen
Messungen” [On calculations of chemical equilibria from thermodynamic measurements]
Königliche Gesellschaft der Wissenschaften Göttingen 1, (1906).
6
W. Nernst: “Thermodynamik und spezifische Wärme” [Thermodynamics and specific
heat]. Berichte der königlichen preußischen Akademie der Wissenschaften (1912).
Inspection shows that for T ĺ 0 the affinity tends to the latent heat. This
reality, in Nernst’s time – between the 19th and the 20th century – there was
168 6 Third Law of Thermodynamics
like those of Fig. 6.1.a. Therefore the usual manner for decreasing
temperature, – namely isothermal compression followed by reversible
adiabatic expansion – indeed decreases the temperature, but never to zero,
since the graphs become ever closer for T ĺ 0.
Fig. 6.1. (a) Isothermal compression (Ļ) and adiabatic expansion (ĸ) (b) Equilibrium
Having presented that argument, Nernst summarizes the three laws of
thermodynamics thus:
7
This accumulation of negatives appealed to Nernst and it has appealed to
physicists ever since.
Diamond and Graphite
One of the more unlikely cases of coexisting phases occurs in solid carbon
and they are known as graphite and diamond. Both are crystalline in
different ways: Graphite consists of plane layers of benzene rings tightly
bound – inside the layer – in a hexagonal tessellation. And each layer is
7
W. Nernst: “Die theoretischen und experimentellen Grundlagen des neuen Wärmesatzes.”
[Theoretical and experimental basis for the new heat theorem] Verlag W. Knapp, Halle
(1917), p. 77.
pressure for the transition graphiteļdiamond
It is impossible to build an engine that produces heat or work from
nothing.
It is impossible to build an engine that produces work from nothing
e
lse than
the
heat of the environment.
It is impossible to take all heat from a body.
Diamond and Graphite 169
loosely bound to the neighbouring ones. If one rubs graphite against a sheet
of paper (say), the uppermost layers are scraped off and leave a mark on the
paper. That is why graphite can be used for writing. Hence the name:
graphos = to write in Greek. The lead inside our pencils consists of graphite
mixed with clay. It has the gloss of lead.
And then there is diamond, the hardest material of all; it cannot be
scratched or ground except by use of other diamonds and it is unaffected by
most chemicals. The Greek word was “adamas” = untameable and that is
where, after some distortion, the name diamond comes from. In diamonds
the carbon atoms sit in the centre of tetrahedra and are quite tightly bound,
although not as tightly as the in-plane atoms in the graphite layers. At
normal pressure and temperature graphite is stable and diamond is meta-
stable.
All this, of course, was unknown until modern times and, naturally, since
diamond was rare and beautiful, and therefore valuable, it was of much
interest to chemists and alchemists alike. To investigate its properties,
however, it needed a rich patron. Cosimo III, Grand Duke of Tuscany – true
to the Medici tradition of patronizing the arts and sciences – provided a
good-size sample for scientific investigation. For security he entrusted it to
a group of three scientists who could not – try as they might – affect it in
any way. Eventually they brought a burning glass to bear, in order to heat
the stone. It developed a halo and then – it was gone! Naturally the report
was met with some scepticism,
8
but nobody was much tempted to repeat the
experiment until Lavoisier did so 80 years later. Lavoisier, living up to his
reputation, controlled his experimental conditions by using a closed jar. He
found that, after the diamond had been burned, the air inside the jar
contained an appropriate amount of carbon di-oxide and so he could
conclude that diamond is pure carbon.
After the inevitable sceptics had been convinced, there arose a strong
desire to reverse the process and make diamond from graphite. Since
ǻg(T,p) = g
dia
(T,p)-g
graph
(T,p) is the affinity of the process and since
v
w
w
6
R
I
)( holds, we have
)0,(),(
0
'' 6IR6I
R
³
Diamond is a lot denser than graphite –3.5
g
/cm
3
as compared to 2
g
/cm
3
– and
therefore we have ǻv < 0 so that ǻg(T,p) decreases with increasing p. For
phase equilibrium ǻg(T,p) must vanish and thus we obtain an equation for
the requisite p as a function of T
8
According to I. Asimov: “The unlikely twins” in: “The tragedy of the moon” Dell
Publishing Co. New York (1972).
'
v(
6
,
S
)
FS
.
170 6 Third Law of Thermodynamics
0
R
³
By the third law ǻg(T,0) is known – without any unknown constants –
from measurements of the latent heat of the transition for p = 0 and from
measurements of the specific heats c
p
(T,0) of both phases starting at T = 0,
or as low as possible. Also v(T,p) is known for all T as a function of
pressure. Of course, it takes a protracted experimental campaign to measure
all these values, but the end might justify the means: For every fixed
temperature we obtain the pressure that should convert graphite into
diamond. Fig. 6.1.b shows the graph.
9
Inspection of the graph shows that, at room temperature, it should take
approximately 15 kbar to obtain diamond, if indeed the transition occurred
in equilibrium. However, in both directions the transition is hampered by
energetic barriers: In the interesting direction the planar benzene
configuration must first be destroyed before diamond can be formed, and in
the other direction the tetragonal diamond structure must be weakened
before diamond turns to graphite. For both it needs high temperature and
therefore the equilibrium graph of Fig. 6.1.b is really relevant only in the
upper part. When diamonds were eventually synthesized in 1955, by
scientists of the General Electric Company in the USA, it occurred at 2800
K and at a pressure of about 100 kbar.
10
There had been several false alarms before that time. But the reported
results turned out to be either fakes or hoaxes. It is believed that the chemist
1893 – he presented a diamond which he believed he had created in his
laboratory. Certainly he could never repeat the feat.
Hermann Walter Nernst (1864–1941)
It is difficult to say much in praise of Nernst which was not already said
better by Nernst himself, cf. Fig. 6.2. He was a bon-vivant, as much as that
is possible for a hard-working professor, operator and administrator. He
hunted in the stylised European manner, was a connoisseur of wine and
women, an early gentleman automobilist and, quite generally, a person
endowed with a healthy self-regard. That by itself is one way to get ahead
in the world and Nernst was good at that.
9
J. Wilks: “Der dritte Hauptsatz der Thermodynamik” [The third law of thermodynamics]
Vieweg, Braunschweig (1963)
10
Or 700 tons per square inch in the cute American units.
'
v(
6
,
S
)
FS
'I
(
6
,0) .
Henri Moisseau had been hoodwinked by one of his assistants when – in
Hermann Walter Nernst (1864–1941) 171
Nernst reassures us concerning the
emergence of further thermodynamic
laws:
The 1st law had three discoverers:
Mayer, Joule and Helmholtz.
The 2nd law had two discoverers:
Carnot and Clausius.
The 3rd law has only one discoverer,
namely himself: Nernst.
The 4th law … (?)
Fig. 6.2. Hermann Walter Nernst
He had obtained the patent for an essentially useless electric lamp – the
Nernst pin – which nevertheless, to Edison’s amazement,
11
,
12
he sold to
industry for a million marks, a very sizable amount of money indeed at the
time. Nernst suggested to Röntgen that he should patent X-rays so as to
make money, an idea that had never occurred to Röntgen; nor was he
tempted.
Nernst’s law, or theorem stood on uncertain grounds at first. It is now
recognized that, at the beginning,
13
it was a daring proposition with little or
no evidence to back it up.
14
To be sure, the theorem was not presented
cautiously, but rather with some fanfare. A somewhat irrelevant differential
equation was solved and one solution was preferred arbitrarily over all
others, because a priori that seemed to Nernst to be the easiest solution.
15
However, at the end, just like with his pin, Nernst was lucky. Others
collected the evidence, which he had failed to present. By and large,
Nernst’s proposition was confirmed through painstaking work lasting many
years. To be sure, amorphous solids had to be excluded somewhere along
the way, but that was a secondary qualification, perhaps.
Despite Nernst’s proud statement, cf. Fig. 6.2, about being the sole dis-
coverer of the third law, there were really two discoverers. Indeed, Planck
strengthened the law on the grounds of statistical thermodynamics by
demanding that the entropy of all crystalline bodies tend to zero for Tĺ0.
11
Thomas Alva Edison (1847–1931), the greatest inventor of all times, owned 1300 patents
at the end of his career, among them one for the electric light bulb. He held a poor opinion
of the practical skills of professors like Nernst.
12
I. Asimov: “Biographies …” loc.cit.
13
W. Nernst: “Über die Berechnung ” loc.cit. (1906).
14
See: A. Hermann (ed.): “Deutsche Nobelpreisträger” [German winners of the Nobel prize]
Heinz Moos Verlag, München (1969) p. 131–132.
15
Ibidem, p. 132.
172 6 Third Law of Thermodynamics
This is the modern version of the law and it is amply confirmed in experi-
ments by comparing the entropies calculated from measurements of specific
heats with the known value of entropy in the ideal gas phase of a substance,
see below.
Planck’s form of the third law goes far beyond Nernst’s, because it is not
restricted to chemical reactions, or phase transitions. It allows us to
calculate the absolute value of the entropy of any single body. The
handbooks used by physicists and chemists provide these values as parts of
their tables of constitutive properties.
Note that this is more than the chemists need, because in their formulae it
is only the entropy of reaction that is needed, that is to say a combination of
the entropy constants of the reactants and resultants, see Chap. 5.
Liquefying Gases
It is not easy to lower temperatures and the creation of lower and lower
temperatures is in itself a fascinating chapter in the history of
thermodynamics which we shall now proceed to consider. The chapter is
not closed, because low-temperature physics is at present an active field of
research. Currently the world record for the lowest temperature in the
universe
16
stands at 1.5 µK, which was reached at the University of
Bayreuth in the early 1990’s. Naturally the cold spot was maintained only
for some hours. Such a value was, of course, far below the scope of the
pioneers in the 19th century who set themselves the task of liquefying the
gases available to them and then, perhaps, reach the solid phase.
The easiest manner to cool a gas is by bringing it in contact with a cold
body and let a heat exchange take place. But that requires the cold body to
begin with, and such a body may not be available. No gas – apart from
water vapour – could be liquefied in this manner in the temperate zones of
Europe where most of the research was done.
Since liquids occupy only a small portion of the volume of gases at the
same pressure, it stands to reason that a high pressure may be conducive to
liquefaction, just as a low temperature is. Both together should be even
16
The universe, through its background radiation, imparts a temperature of 3K to bodies that
are not otherwise heated or cooled.
This is just like with energy: Chemists need only the heat of reaction, but Einstein’s
formula E = mc
2
furnishes the absolute value of energy for all reacting constituents
in terms of their mass. This, however, is not useful knowledge for the chemist.
Indeed, the mass defect of chemical compounds is too small to be measured by
weighing (say). Yet, in summary it may be said that the first decade of the 20th
century furnished both: the theoretical possibility for the determination of the
absolute values of energy and entropy.
Liquefying Gases 173
better. That idea occurred to Michael Faraday – a pioneer of both electro-
magnetism and cryogenics, the physics of low-temperature-generation – in
1823. He combined high pressure and low temperature in an ingenious
manner by using a glass tube formed like a boomerang, cf. Fig. 6.3. Some
manganese di-oxide with hydrochloric acid was placed at one end. The tube
was then sealed and gentle heating liberated the gas chlorine which mixed
with the air of the tube and, of course, raised the pressure. The other end
was put into ice water and it turned out that chlorine condensed at that end
and formed a puddle at 0°C and high pressure.
Fig. 6.3. Michael Faraday (1791–1867) Liquefaction of chlorine
When the pressure is slowly released, some of the liquid chlorine
evaporates and, if this is done adiabatically, the heat of evaporation comes
in part from the liquid, which therefore cools. In this manner Faraday was
able to determine the boiling point of chlorine at 1atm as being –34.5°C. A
further decrease of pressure will cool the liquid chlorine beyond that point,
provided of course, that any is left.
Other scientists joined the campaign for low temperatures, notably
Charles Saint Ange Thilorier (1771–1833), a chemist, who liquefied carbon
dioxide in a strong metallic boomerang under high pressures and then
lowered the pressure – hence, by evaporation, the temperature – far enough
to make it solid. When enough solid was accumulated to experiment with, it
turned out that carbon dioxide at 1atm goes immediately from the solid
phase into vapour and vice-versa – at –78.5°C – in a process called
sublimation, or de-sublimation respectively. That makes solid carbon di-
oxide popular as dry ice. It cools an article without soaking it upon melting;
after all, it does not melt, it sublimates.
174 6 Third Law of Thermodynamics
Thilorier invented another trick as well. He mixed the strongly volatile
ether
17
with solid carbon di-oxide. The ether evaporated and thus produced
temperatures as low as –110°C, or 163 K. Having enough of this cold
mixture available, Faraday and Thilorier could now liquefy other gases by
simple heat exchange, although for some of them they needed high pressure
to help in the process.
And yet, there are eight gases which cannot be liquefied at 163 K even
under high pressure. They are oxygen, argon, fluorine, carbon monoxide,
nitrogen, neon, hydrogen and helium of which Faraday knew five; he did
not know the noble gases. So he called those five gases permanent. And
that is where the further development was stuck for a while. Until Thomas
Andrews (1813–1885) found out about the critical point or, in particular,
the critical temperature.
Andrews worked with carbon dioxide CO
2
, a gas that can be liquefied at
room temperature under pressure. He took a sample of liquid CO
2
under
high pressure – 60–70atm (say) – and watched the liquid evaporate at some
fixed temperature upon heating. Then he raised the pressure and started
again, and again. He observed that the phase separation became less
pronounced for higher pressure and vanished altogether at p = 73atm and
T = 31°C. That point was called the critical point by Andrews. For higher
pressures the liquid did not evaporate upon heating nor did the vapour
liquefy upon cooling; the vapour just became ever denser without any
evidence of a separation between liquid and vapour.
Andrews conjectured that all substances have critical points and that
these points had escaped the attention of thermodynamicists only, because
they were far out of the usual and easily accessible ranges of pressure and
temperature. Therefore he concluded that the permanent gases can also be
liquefied, if only we start raising the pressure on a sample that is colder, or
even considerably colder than 163 K, which at that time was the record
minimum.
Eventually this proved to be the case. But there was the problem of
reaching lower temperatures. This problem was solved by Louis Paul
Cailletet (1832–1913) in 1877. He compressed oxygen to a pressure of
66atm (say) in a compressor and then cooled the compressed gas back to
room temperature T
H
= 298K. Afterwards he subjected the gas to an
adiabatic expansion to p
L
= 1atm through a turbine, regaining some of the
compressor work. For the expansion the adiabatic equation of state may be
used in the form
1
)(
z
T
T
p
p
L
H
L
H
, and for z =
5
/
2
– appropriate for a two-
atomic ideal gas – it follows that the oxygen leaves the turbine with T
L
§ 90
K,
very close to the condensation point and far below the previous record
minimum of 163 K. Actually Cailletet observed a fog of liquid droplets
17
Diethyl ether, not the luminiferous variety of Chap. 2, of course; that would have been
something!
p
H
=
Liquefying Gases 175
behind the turbine. Thus he had successfully liquefied oxygen although, of
course, the droplets quickly evaporated. The same could be done for
fluorine, carbon monoxide and nitrogen and – after the noble gases had
been isolated – for argon and neon.
18
Dewar was a man of many interests and talents: He erred, however, when
he saw a connection between the blue of the sky and the blue colour of
liquid oxygen. He invented cordite, a smokeless gun powder, and that
brought him into a bitter fight about an alleged patent infringement with
Alfred Bernhard Nobel (1833–1896). So, understandably, there was no
Nobel prize for Dewar, although the road to absolute zero was otherwise
paved with those prizes. However, Dewar was knighted and became Sir
James. After his work only helium remained a gas. It deserves its own
section, see below
.
Despite effective isolation, until 1895 the cold liquids remained a
laboratory curiosity. But then Carl Ritter von Linde (1842–1934) invented a
continuous process of successive adiabatic throttling which produced
liquids of oxygen and nitrogen in quantity, to be filled into high-pressure
bottles and put to industrial use.
19
Throttling occurs when a vapour or a
liquid are pushed or sucked through a narrow opening so that the pressure
decreases and so does the temperature in most substances. The cooling
effect is known as the Joule-Thomson effect – or Joule-Kelvin effect. We
have learned about this before, cf. Chap. 2. In an ideal gas the effect is nil,
or very tiny indeed – to the extent that the gas is not really ideal. This
means that before throttling can be applied efficiently, the gas has to
undergo Cailletet’s adiabatic expansion, which converts it into a vapour
18
The reader has surely noticed the author’s special liking for the science essays of Isaac
Asimov. Actually the present treatment of gas liquefaction also makes use of two such
essays, namely I. Asimov: “Liquefying gases” and “Toward absolute zero” both in
“Exploring the earth and the cosmos.” Penguin Books, London (1990). These essays,
however, see Asimov wrong, because he confuses Cailletet’s adiabatic expansion and the
adiabatic Joule-Thomson effect. The former is an essentially reversible process at constant
entropy, while the latter is an inherently irreversible process with an unchanged enthalpy
between beginning and end.
19
Oxygen, nitrogen and hydrogen come in blue, green and red bottles, respectively, under a
pressure of 150 bar.
Effective isolation eventually produced liquids of the permanent gases in
quantities sizable enough to study their properties, e.g. the boiling points.
Even hydrogen was eventually liquefied in 1898 by James Dewar
(1842–1923) and its boiling point turned out to be 20.3 K; solidification
happens at 14K. For isolation Dewar invented the Dewar flask, a kind of
thermos bottle, in which cold liquids could be stored for a long time,
because the flasks had a vacuum-filled double wall, whose surface was
silvered, so that even radiation losses were kept at a minimum.
176 6 Third Law of Thermodynamics
close to liquefaction. Linde used several steps of throttling and
regeneration, i.e. he pre-cooled the incoming flow of vapour by making it
exchange heat with the already throttled one. The Linde process is still used
now. And Linde’s firm – founded in 1879 – thrives on selling liquefied
gases, although it is mostly putting out the ubiquitous compression
refrigerators, another invention of Linde’s.
Fig. 6.4 . Carl Ritter von Linde (1842–1934). Schematic view of his air liquefying apparatus
Van der Waals was the person who made sense out of the concept of the
critical point and who corroborated Andrew’s conjecture that all gases
should have such a point. He considered that the ideal gas law
6R
M
P
v
1
is
an idealization which ignores inter-atomic forces. Van der Waals reasoned
that the interaction force – now called van der Waals force – is mildly
attractive at large distances and strongly repulsive when the atoms are close.
Thus the potential ij(r) of the force between two atoms in the distance r has
the form shown qualitatively in Fig. 6.5.
20
On the grounds of this
assumption van der Waals was able to derive a modified form of the ideal
gas law, namely, cf. Insert 6.1
2
vv
C
D
6
R
M
P
21
20
Van der Waals could not know the nature of the attractive force. It is an electric dipole-
dipole interaction, and the dipoles are due to a mutually induced differential shift of the
electron shells and the nuclei of adjacent atoms.
21
J.D. van der Waals: “Over de continuiteit van den gas- en vloeistoftoestand.” [On the
continuity of the gaseous and the liquid state]. Dissertation, Leiden (1873).
.
Johannes Diderik van der Waals (1837 923)
Johannes Diderik Van Der Waals (1837–1923) 177
Fig. 6.5. Schematic form of the interatomic interaction potential as a function of the distance
of two atoms. Also: van der Waals coefficients
Fig. 6.6. Isotherms of a van der Waals gas. Also: Maxwell construction
This has become known as the van der Waals equation for a real gas.
Obviously the modification lies in the positive coefficients a and b. The
coefficient b represents the volume of an atom which clearly must detract
from the total available volume. And the coefficient a represents the range
and size of the attractive interaction which reduces the pressure exerted on
the wall.
In a certain range of temperatures the van der Waals equation describes
isotherms in a (p,v)-diagram that are non-monotone, as shown qualitatively
in Fig. 6.6. Thus there is the possibility to have two – actually three –
specific volumes for one pressure and one temperature. Ignoring the middle
one, van der Waals interpreted the two remaining volumes as those of the
liquid and the vapour, and came up with the surprising conclusion that his
theory, intended for real gases – as opposed to ideal gases –, could perhaps
describe a liquid-vapour transition. This is what the title of his work
suggests. Accordingly the temperature, whose isotherm develops a
horizontal point of inflection, has to be interpreted as the critical isotherm
and the inflection point itself as the critical point. By the van der Waals
equation that point has the coordinates
178 6 Third Law of Thermodynamics
.
27
8
27
1
,3
2
D
C
6
M
D
C
RD
%%%
P
v
Although van der Waals’s work was presented as a doctoral thesis, –
rather than in a scientific journal – it became quickly known. Boltzmann
recognized it as a masterpiece, and he was so enthusiastic about the
derivation that he called van der Waals the Newton of real gases.
22
And
Maxwell discovered a graphical method for the determination of the
saturated vapour pressure p(T) for the van der Waals gas, see. Fig. 6.6. He
wrote the phase-equilibrium condition of Insert 3.7 for the free energy
F =
U-TS in the form
FƎ – Fƍ = – p(T)(VƎ – Vƍ) or with
T
F
p
V
ÈØ
ÉÙ
ÊÚ
³
cc
c
c
cc
V
V
VVTpdVTVp ))((),( ,
where the integration must be taken along the isotherm. Thus p(T) is the
isobar that makes the two shaded areas in Fig. 6.6 equal in size, This
graphical method to determine p(T), and vƍ(T), vƎ(T) has become known as
the construction of the Maxwell line.
An interesting corollary of the van der Waals equation emerges when one
introduces dimensionless variables
%%%
6
6
R
R
WQS
v
v
,
,
because in that case the equation becomes universal, i.e independent of
parameters relating to the particular fluid
2
3
13
8
W
S
.
Van der Waals called this relation the law of corresponding states: States
with equal non-dimensional variables correspond (sic) to each other
irrespective of the material properties. This implies that the liquid-vapour
properties of all substances are alike:
x convex, monotonically increasing vapour pressure curves,
x similar wet steam regions and, of course
x
The underlying reason for such conformity is the fairly plain (ij,r)-relation,
cf. Fig. 6.5, which is common – qualitatively – to
all gases.
22
In: Encyclopadie der mathematischen Wissenschaften, Bd. V.1. p. 550.
critical points.
Johannes Diderik Van Der Waals (1837–1923) 179
From a practical point of view, and with regard to liquefying gases, the
most important conclusion from the van der Waals equation concerns the
Joule-Thomson effect in a throttling experiment. It turned out that throttling
The energy flux before and behind an adiabatic throttle must be equal;
therefore the first law requires that the specific enthalpy h is unchanged,
provided that the kinetic energy of the flow can be neglected. That
condition could be used for the calculation of the temperature change ǻT for
a given pressure drop ǻp, cf. Insert 6.2. One obtains the criteria
coolin
g
11
0 for no chan
g
e
heatin
g
TT
p
!
ÈØ
ÉÙ
ÊÚ
v
v
.
Rather obviously the equality holds for ideal gases, so that ideal gases do
not change their temperature upon adiabatic throttling. And for a van der
Waals gas the criteria imply that the initial state must lie below the graphs
which define the inversion curve in the (Ȟ,IJ)- , the (ʌ,IJ)-, or the (ʌ,Ȟ)-
diagram, viz.
SWWS
W
Q
189
,2712324,
23
1
2
3
1
.
Obviously we have used here the dimensionless variables of the law of
corresponding states. If a state lies on the inversion curves, it does not
change temperature upon throttling; if it lies above the curves, the gas heats
up.
Figure 6.7 shows the inversion curves in the (ʌ,IJ)-diagram and in the
(ʌ,Ȟ)-diagram along with – for better orientation – the critical isochor and
the critical isotherm, respectively. Inspection of the (ʌ,IJ)-diagram – and of
the mini-table in Fig. 6.7 with critical data for oxygen and hydrogen –
shows that hydrogen of 1atm heats up, if throttled above T = 140 K.
Therefore the Linde process for the liquefaction of hydrogen must start at a
lower temperature. For oxygen, on the other hand, the process may start at
room temperature. To be sure, it is not very efficient there; the cooling
effect at room temperature was barely big enough to have been noticed by
Joule and Kelvin.
The van der Waals equation with its two parameters a and b is
quantitatively not good for any actual gas no matter how a and b are
chosen. It does, however, have great heuristic value, because it is based on
molecular considerations, cf. Insert 6.1, and it represents a fairly simple
analytic thermal equation of state. It is therefore revisited over and over
again. Fairly recently I have come across an instructive article entitled
did not necessarily lead to cooling. One thing was well-known, however:
180 6 Third Law of Thermodynamics
“Thirteen ways of looking at the van der Waals equation”.
23
And I believe
that in a recent book
24
I have presented a fourteenth way.
Fig. 6.7. Inversion curves and critical isochor and isotherm Also: Mini-table of critical data
Students of thermodynamics are often mystified by the non-monotone
isotherms exhibited in Fig. 6.6 and, in particular, by the branch with a
positive slope, which suggests instability. These features are reflections of
the non-convex character of the function ij(r), but we shall not go into that,
although at present – while I write this – there is great interest in similar
phenomena occurring in phase transitions in solids, like shape memory
alloys. An instructive mechanical model for non-monotone stress-strain
curves has been proposed and investigated by the author.
25
23
M.M. Abbott: Chemical Engineering Progress, February (1989).
24
I. Müller, W. Weiss: “Entropy and energy, ” loc.cit. (2001).
25
I. Müller, P. Villaggio: “A model for an elastic-plastic body” Archive for Rational
Mechanics and Analysis. 65 (1977).
Van der Waals equation
All N atoms of a monatomic gas in a volume V with the surface V and outer
normal n move according to Newton’s law of motion
DD
Kxµ
(Į = 1,2,…).
If that equation is multiplied by x
Į
, and then averaged over a long time IJ, and
summed over all Į, one obtains
¦¦
D
DD
D
D
NN
xKxµ
11
2
(angular brackets denote averages).
Johannes Diderik Van Der Waals (1837–1923) 181
The left hand side is equal to –3NkT, since each atom has an average value
1
/
2
kT
of kinetic energy. The right hand side was called virial by Clausius. The virial has
two parts W
S
and W
i
due to forces on atoms from the surface and from other atoms
respectively. Therefore we write
-3 NkT = W
S
+ W
i
.
Assuming that only atoms in the immediate neighbourhood of the surface element
dA of V feel the effect of the surface, and that the sum of forces from the surface
on those atoms is equal to –pndA on average, we obtain W
S
= -3 pV. Hence follows
pV = N k T +
1
/
3
W
i.
.
Without the inner virial W
i
we thus have regained the ideal gas law.
The force on atom Į from atom ȕ may be written
xx
KKxx
xx
β
α
αβ α β
β
α
. It
follows for W
i
11
xx
xx
NN
WK x
i
xx
ÇÇ
αβ
α
β
α
αβ
α
β
1
2
11
for an
y
2
1
.
xx
xx
NN
WKxx
i
N
N
Kxx
ÇÇ
Ç
αβ
αβ
αβ
αβ
β
αβ
α
The last step requires that on average each atom is surrounded by others in the
same manner. We set Ňx
ȕ
-x
Į
Ň= r and convert the sum in an integral by defining
the particle density n(r) .
.
0
d
3
)()(2
isotropyby or,d)()(
2
³
f
S
³
rrrnrKN
V
VrnrrK
N
i
W
The force K(r) and the potential ij(r) of Fig. 6.5 are related by K(r) = -
rd
dM
and the
particle density n(r) may approximately be given by
)
exp(
kTV
N
M
, so that an atom
on average is surrounded by a cloud of other atoms which is densest, where ij(r)
has its minimum. Insertion provides
³
f
M
S
0
2
d
))exp(1(32
2
rrkTW
kTV
N
i
.
We set ij = for r < d and
1
kT
M
for r > d as indicated in Fig. 6.5 and obtain
3
4
1
2
23
d
3()4
2
i
d
Nd
NN
WNkT r rr
VV
ËÛ
ÌÜ
ÌÜ
ÍÝ
Ô
π
ϕπ
or, with a and b from Fig. 6.5,
182 6 Third Law of Thermodynamics
Helium
Helium deserves its own section, although it was liquefied in the same
manner as hydrogen, by adiabatic expansion and throttling. It just took
more time, because the boiling point was lower: 4.2K. It was Heike
Kammerlingh-Onnes (1853–1926) who succeeded in 1908 and who
eventually reached 0.8K by adiabatic evaporation of the liquid.
Kammerlingh-Onnes received the Nobel prize for his efforts in 1912.
He did not succeed, however, to freeze helium, and later it turned out that
it cannot be done, no matter how far the temperature is lowered, at least not
under ordinary pressures. It took pressures of 20 atm, or so, to make helium
solid.
The reason for the persistence of the liquid phase is supposed to be
quantum mechanical. According to quantum mechanics a particle with
momentum p and energy
P
2
2
p
may be considered as a de Broglie wave with
2
3
i
ba
WNkTV
ËÛ
ÌÜ
ÍÝ
v
v
.
Elimination of W
i
between this and the equation for pV provides the van der Waals
equation, provided we assume that b << v holds which is reasonable.
Insert 6.1
Throttling
Adiabatic throttling is an isenthalpic process of lowering the pressure by ǻp < 0.
The temperature changes accordingly so that ǻh =0 can be satisfied. Therefore we
have
.
)(
)(
p
T
h
T
p
h
p
T
w
w
w
w
'
'
The denominator is the specific heat c
p
, and the numerator may be rewritten – by
use of the Gibbs equation – in the form
R
6
6
R
J
6
)()(
w
w
w
w
v
v
. Hence follows
11
p
p
TT
pc T T
∆
∆
ÈØ
ÈØ
ÉÙ
ÉÙ
ÊÚ
ÊÚ
vv
v
and we conclude that cooling occurs, if the thermal expansion coefficient
R
6
)(
1
w
w
v
v
D
is greater than
1
/
T
. For ideal gases we have Į =
1
/
T
.
Insert 6.2
Helium 183
a wave length
p
h
O
and a frequency
P
Q
2
1
2
p
h
.
26
Such a particle has an
equal probability to be anywhere in space, so that it cannot be localized. A
particle, however, which we know to be boxed in, in a range of linear
dimension ǻx, is represented in quantum mechanics by a packet of de
Broglie waves, i.e. a superposition of such waves with momenta in the
range ǻp. Between ǻx and ǻp there is the relation ǻx ǻp = h, which is called
Heisenberg’s uncertainty relation. Thus either x or p may be fixed, but not
both.
The above is a subject of single-particle quantum mechanics, governed
by the Schrödinger equation. The uncertainty relation is extrapolated to
thermodynamics by the assumption that ǻp may be interpreted as the
momentum of a particle of a liquid (say) during its thermal motion. Thus we
may write
.,:or with2
2
1
kT
h
xkTpkTEEp
P
'P'P'
ǻx is therefore a typical de Broglie wave length of a particle of a body of
temperature T, such that ǻx
3
represents the smallest volume element in
which such a particle can be localized. For an atom of liquid helium at
T =
1K the uncertainty ǻx of position comes out as ǻx = 2·10
-9
m. This is
considerably more than if the particle were confined to an elementary cell in
a solid lattice structure. Therefore the solid lattice cannot form, and that is
why helium remains liquid, or so they say.
Once liquid helium was available, it could be used to cool other
substances down to the neighbourhood of absolute zero. And it turned out
that some metals, like mercury and lead develop a very strange behaviour
indeed. They lose their electrical resistance at some characteristic
temperature. We say that they become super-conductors, materials with
zero resistivity in which a current, once induced, moves round and round
forever.
Actually helium itself, below 2.19K – the so-called Ȝ-point – exhibits a
somewhat similar unique phenomenon of its own: It behaves like a mixture
of a normal fluid with a small viscosity and a super-fluid, which has no
viscosity at all. That liquid mixture is called He II as opposed to He I, liquid
helium above the Ȝ-point. The lower the temperature is, the higher is the
proportion of the super-fluid.
substance dumbfounded eminent scientists like Lev Davidovich Landau
(1908–1968) and Evgenii Michailovich Lifshitz (1915–1985), Landau’s
colleague, collaborator and frequent co-author. It is, perhaps, worthwhile to
describe two of the more illustrative snares in which those scientists found
26
h = 6.626·10
-34
Js is the Planck constant.
Strange phenomena occur in He II, or they should occur and do not. The