Graph practice phần 5 ppsx
Bạn đang xem bản rút gọn của tài liệu. Xem và tải ngay bản đầy đủ của tài liệu tại đây (59.8 KB, 12 trang )
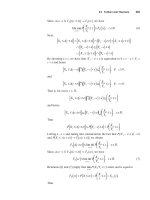
5. If the manager of the catering company decides to recruit 20 more female
employees and spread them evenly across the jobs, what will be the ratio between the
female bartenders to the male and female hosts?
A. 12:17.
B. 13:16.
C. 18:11.
D. 8:21.
E. 13:11.
The best answer is B.
If the manager adds 20 female employees to the company and spread them evenly
across the jobs, there’ll be 5 more in each job.
The ratio between the bartenders to the hosts will be (8+5 = 13) to (11 + 5 = 16) and
therefore answer B is the best.
Percentage of honor students in the Berkley University
0
2
4
6
8
10
12
14
16
18
20
19961997199819992000
Year of sampling
Percent of honor students
First year students
Second year students
Third year students
Distribution of all the honor students in the year 2000
Chimestry
35%
Economy
20%
Aerospace
10%
Agriculture
15%
Biology
20%
1. If all the students are on a three years course, how many more students finished
with honors in 1997 than in1995?
A. 1%.
B. 2%.
C. 3%.
D. 4%.
E. 5%.
The best answer is C.
Go to the line which represents the percent of third year students, you can easily see
that in 1996 5% finished with honors while in 1997 8% finished with honors and thus
the difference is only 3%.
2. The class of which of the following years improved most significantly their percent
of honor students from first to last year? (Students who finished their third and last
year in 1999 for example are considered class of 1999).
A. 2000.
B. 1999.
C. 1998.
D. Answers A and B.
E. There isn’t enough data.
The best answer is A.
Go over each of the classes and see the improvement.
The class of 2000 finished with 19% honor students while they started in 1998 with
2%, which makes an 17% increase. The class of 1999 improved by 15% and the class
of 1998 improved by 10% only. And therefore class of 2000 made the biggest
increase and A is the answer.
3. In the second year where there was a decrease in the percent of honor students,
what was the ratio between the percent of third year to second year honor students?
A. 7:19.
B. 19:3.
C. 21:6.
D. 19:7.
E. 3:19.
The best answer is D.
The first year, which had a decrease in the number of honor students, is the year 2000.
In that year the ratio between third to second year honor students is 19 to 7 percent.
4. If every second year honor student in 2000 was also an honor student in 2001 and if
10% of the non-honor students among that group were also honor students in 2001,
what percent of the third year students in 2001 honor students?
A. 4.5%.
B. 10.2%.
C. 16.4%.
D. 18%.
E. 20.5%.
The best answer is C.
7% of the second year honor students in 2000 were also honor students in 2001 and
10% of the rest (10% of 94% is 9.4%) are also honor students.
Add up the percentages: 7% + 9.4% is 16.4% percent honor students.
5. Assume that in 1997 there were 3,000 first year students in the University of
Berkley. How many more third year honor students were in 1999 than second year
honor students in 1998?
A. 320.
B. 380.
C. 400.
D. 420.
E. 550.
The best answer is D.
The same 3000 first year students in 1997 reached their third year in 1999 and
therefore we can use the percentages in the graph.
In 1999 there were 18%, which is 540 honor students.
In 1998 there were 4%, which are 120 honor students.
The difference is 420 students.
6. What is the ratio between the second year honor students in 1997 to the second year
non-honor students in 1997?
A. 2:23.
B. 2:24.
C. 2:25.
D. 2:26.
E. 1:8.
The best answer is A.
In 1997, second year, there were 8% honor students and therefore 92% of the students
were non-honor students. The ratio is 8 to 92 or 2 to 23.
7. If in the class of 2000, each student was an honor student only once during his three
years of studying, what percent of the students were honor students once during the
trial of their degree?
A. 24%.
B. 25%.
C. 27%.
D. 35%.
E. 49%.
The best answer is C.
If each student wasn’t an honor student more than once in the class of 2000 then by
adding up the percentages you’ll receive the percent of the students who were honor
students once during the trial of their degree.
The answer is (19% + 6% + 2% = 27%).
8. If every student from 1996 to 2000 received the honor roll appellation only once
during his entire trial of studying, which of the following classes contains the largest
percent of students who were honor students at least once?
A. 2000.
B. 1999.
C. 1998.
D. Answers A and B.
E. There isn’t enough data.
The best answer is A.
Check the numbers for each of the classes.
In the class of 2000- (19% + 6% + 2% = 27%) were honor students once.
In the class of 1999- (18% + 4% + 3% = 25%) were honor students once.
In the class of 1998- (11% + 4% + 1% = 16%) were honor students once.
The class with the largest percent is the class of 2000, thus answer A is the best.
9. Among the honor students in the year 2000, what percent are third year students
and learn Aerospace?
A. 1.9%.
B. 6%.
C. 10%.
D. 19%.
E. There isn’t enough data.
The best answer is E.
We know that 19% of all third year students are honor students and we know that
10% of all the honor students study Aerospace (second and first year too) but we can
make a correlation between the two groups, we need more sufficient data.
We don’t know how many students are in their third year, that’s the missing link and
therefore answer E is correct.
10. Assume that 12,000 students study in the Berkley University in the year 2000 and
50% are in their second year. How many honor students are in their second year and
study Agriculture?
A. 900.
B. 126.
C. 98.
D. 63.
E. There isn’t enough data.
The best answer is E.
If 12,000 students are in their second year of study in the year 2000, we know that
50% out of them are in their second year, which is (0.5 x 12,000 = 6,000).
Out of the 6,000, 7% are honor students, which are 420 students.
By the bar graph, we know that 15% of all the students study Agriculture but we don’t
know how many of them are in their second year and therefore we lack sufficient
information. The answer is E.
Compact Disks sold in Holland in the year 2000 by
music catagories
[in million copies]
0
2
4
6
8
10
12
January
February
March
April
May
June
July
August
September
October
November
December
Copies sold
World music
Rock
Electronic
Classic
1. For how many months in 2000 were the sales of world music CD’s less than any
other trends of music?
A. 0.
B. 1.
C. 2.
D. 3.
E. 4.
The best answer is C.
Each line in the graph represents a type of music trend, find the line that represents
world music and go over it from January to December and look for months that the
line is the lowest among the other 3. You can see that in the months of April and June
the line is the lowest one and therefore the answer is 2.
2. Approximately how many more world music CD’s were sold in August than
Classic ones?
A. 1.5 million.
B. 2 million.
C. 3.2 million.
D. 4 million.
E. 4.5 million.
The best answer is B.
The question requires data from the months of August, go to that month and find,
according to the line style, how many CD’s were sold in each of the music trends
necessary. 7 million were sold in the world music category and 5 million were sold in
the classic category, approximately 2 million difference.
3. In which of the following months were the total CD’s sales approximately double
that of classic CD’s?
A. February.
B. March.
C. April.
D. November.
E. December.
The best answer is A.
This question could take you a long time if you don’t work wisely.
Don’t go over all the months, just the ones that are listed in the answers.
Answers, like December, you can easily disqualify since the classic music trend is
relatively low. You can see that in the month of February the total CD sales were
approximately 10 million, 5 out of them came from the classic category and therefore
the classic music trend represents 50% of the total and A is the answer.
4. What was the approximate increase in the sales of Rock CD’s from February to
September as percent of the increase in the sales of world music CD’s over the same
period of time?
A. 20%.
B. 25%.
C. 40%.
D. 50%.
E. 75%.
The best answer is A.
In February, 3 million Rock and 1 million world music CD’s were sold.
In September, 4 million Rock and 6 million world music CD’s were sold.
In percent terms, the question is simply is how much is (4-3)/(6-1) = 1/5 = 20%.
And therefore answer A is the best.
5. If 195 million copies of Rock CD’s were made in the year 2000, approximately
what percent were sold?
A. 10%.
B. 20%.
C. 30%.
D. 40%.
E. 50%.
The best answer is D.
You need to find how many Rock CD’s were sold during the entire year.
Find the line that represents the Rock category and sum up the sales in each of the
months from January to December. Approximately 78 million copies were sold,
which exactly 40% of 195 million. (78 x 2.5 = 195), and therefore answer D is the
best.
Sales and Net income of two competing companies
Sales
0
5
10
15
20
25
30
Spring Summer Fall Winter
Sales
Company X
Company Z
Net income from sales
0
100,000
200,000
300,000
400,000
500,000
600,000
700,000
800,000
Spring Summer Fall Winter
Income
Company X
Company Z
1. Approximately what were the average sales of company X during the entire year
(In millions)?
A. 7.5.
B. 11.
C. 13.
D. 15.
E. 16.5.
The best answer is C.
Go to the sales graph and sum up the sales of company X across the seasons and
divide by four. The math is (53/4 = approximately 13) and therefore the answer is
C.
2. The sales of company Z in the winter were approximately how many times as
great as the sales in the spring?
A. 2.5.
B. 3.
C. 4.
D. 5.
E. 5.5.
The best answer is E.
Go to the sales graph and find the pattern which represents company Z.
In the spring approximately 2.5 million dollars were sold while in the winter
approximately 14 million were sold. 14 divided by 2.5 is 5.6 and therefore answer E is
the closest one.
3. From summer to winter, the decrease in the net income of company X was
approximately how much more in dollars than the increase of the net income of
company Z during the same period of time?
A. 25,000.
B. 30,000.
C. 50,000.
D. 65,000.
E. 85,000.
The best answer is C.
Go to the net income graph. In the summer, 720 thousand dollars were made by
company X while only 110 thousand were made by company Z. In the winter, X
made 350 thousand while Z, made 430.
The differences in the decrease of X and the increase of Z is approximately
(720 – 350 – (430 – 110) = 50) thousand dollars.
4. Which of the following ratios was the greatest during the spring?
A. Company’s X sales to company’s X net income.
B. Company’s X sales to company’s Y net income.
C. Company’s Y sales to company’s Y net income.
D. Company’s Y sales to company’s X net income.
E. The sums of both companies’ sales to both companies net income.
The best answer is B
The best and most reassuring way is to check each of the ratios approximately.
A. 12,000,000 to 480,000, which is approximately 25.
B. 12,000,000 to 140,000, which is approximately 85.
C. 2,500,000 to 140,000, which is approximately 18.
D. 2,500,000 to 480,000, which is approximately 5.
E. 14,500,000 to 620,000, which is approximately 23.
The best answer is obviously B.
5. For what company in which season was the net income at least 5% of sales?
A. Company X in the summer.
B. Company X in the winter.
C. Company Z in the winter.
D. Company Z in the fall.
E. Company Z in the spring.
The best answer is E.
In this question you’ll need to cross the data from both of the charts.
Go over each of the possible answers and find the percent of the net income to sales.
A. 720 thousand out of 25 million, which is less than 3%.
B. 350 thousand out of 9 million, which is less than 4%.
C. 430 thousand out of 14 million, which is less than 4%.
D. 290 thousand out of 10 million, which is less than 3%.
E. 140 thousand out of 2.5 million, which is a little over 5% and therefore this is
the correct answer.
Imported cars, range of prices by catagory
0
200
400
600
800
1000
1200
Europeans cars
Sport cars
American cars
Executive cars
Japanease cars
Compact cars
Prices in hundreds of dollars
The following chart represents the range of prices according to category of imported
cars to the state of Idaho in the year 1988. The prices are in hundreds of dollars.
1. What two types of cars cannot be bought in the same price?
A. Sports cars and American cars.
B. Japanese cars and Compact cars.
C. Japanese cars and American cars.
D. Sports cars and Japanese cars.
E. European cars and sports cars.
The best answer is E.
The chart represents ranges of prices. Try to find two categories that do not have an
overlapping- the only categories among the answers given that don’t have an
overlapping are the ones in answer E. European cars range from 250 to 450 while
sports cars start only in 500.
2. Which of the following categories have the largest amount of overlapping in their
price?
A. Executive cars and American cars.
B. Japanese cars and Europeans cars.
C. Japanese cars and American cars.
D. Sports cars and Japanese cars.
E. European cars and sports cars.
The best answer is C.
Go over each of the answers and find the overlapping between the two.
A- There is a 250 hundred dollars of overlapping.
B- There is a 200 hundred dollars of overlapping.
C- There is a 400 hundred dollars of overlapping.
D- There is a 50 hundred dollars of overlapping.
E- There is no overlapping.
We can see that C is the best answer since the Japanese category is included in the
range of the American category according to the graph.
3. Which of the following statements must be false?
A. The average price of a sports car is 600 hundred dollars.
B. The average price of an American car is greater than the average price of an
executive car.
C. The average price of a compact car is 300 hundred dollars.
D. The average price of a European car is greater than the average price of a
sports car.
E. The average price of a European car is lower than the average price of a
compact car.
The best answer is D.
The key to this question is to understand that the average can be anywhere along the
range and not necessary in the middle.
All the answers are possible except D because there is no overlapping between the
two categories and therefore the higher range must have the higher average, which is
contrasting to the statement. And therefore D must be the only statement that must be
false.
4. Which of the following statements must be true?
A. The maximum price of an executive car is higher than the minimum price of a
sports car.
B. The overlapping between the Japanese cars and the compact cars is larger than
the overlapping between American cars and sports cars.
C. The average price of a sports car must be higher than that of an American car.
D. A and B must be true.
E. A, B and C must be true.
The best answer is D.
Let’s go over answers A, B and C.
A- The maximum price of an executive car is 950 while the minimum price of a
sports car is 500 and therefore this statement is true.
B- The first overlapping is approximately 250 while the second overlapping is
approximately 100 and therefore this statement is also true.
C- The average price can be anywhere in the range and therefore this statement is not
necessarily true and D is the answer.
5. A young couple in the state of Idaho bought two cars, an Executive car for the
husband and a sports car for the wife. Which of the following amounts is not a
possible price for both cars?
A. $65,000.
B. $90,000.
C. $110,000.
D. $125,000.
E. $195,000.