status, continuous training need for traditional health staff at provincial hospital and evaluation of intervention
Bạn đang xem bản rút gọn của tài liệu. Xem và tải ngay bản đầy đủ của tài liệu tại đây (226.26 KB, 26 trang )
1
MINISTRY OF EDUCATION AND TRAINING MINISTRY OF HEALTH
NATIONAL INSTITUTE OF HYGIENE AND EPIDEMIOLOG
_________________________
TRINH YEN BINH
CURRENT SITUATION OF HUMAN RESOURCES,
CONTINUOUS TRAINING NEED FOR TRADITIONAL
HEALTH STAFF AND EFFECT OF INTERVENTION
MEASURES
Speciality: Social Hygiene and Health Management
Code: 62 72 01 64
SUMMARY OF PhD THESIS
HA NOI - 2012
2
Thesis implemented:
- Department of National Traditional Medicine and Pharmacy
- Friendship Hospital;
- National Institute of Hygien and Epidemiology
Supervisors:
1. Associate Professor Ngo Van Toan, MD, PhD
2. Professor Phung Dac Cam, MD, PhD
Opponant 1: Associate Professor Tran Quoc Kham, MD, PhD
Opponant 2: Associate Professor Hoang Minh Chung, MD, PhD
Opponant 3: Dr Do Hoa Binh, MD, PhD
Thesis will be defended to the Assesment Committe in National Institute of
Hygien and Epidemiology
Time: Date:
Thesis found at:
- Library, National Institute of Hygien and Epidemiology
- National Library
3
PUBLISHED ARTICLES RELATED TO THESIS:
1. Trinh Yen Binh, Ngo Van Toan, Phung Dac Cam, Tran Thi Hong
Phuong (2011), “Traditional medicine and pharmacy human resources in
Vietnam”, Journal of Preventive Medicine, Vol. XXI, No. 7, 103 – 108.
2. Trinh Yen Binh, Ngo Van Toan, Phung Dac Cam (2011), “Continuos
training need of traditional medicine and pharmacy staff”, Journal of
Preventive Medicine, Vol. XXI, No. 7, 110 – 116.
3. Trinh Yen Binh, Tran Thi Hong Phuong, Nguyen Thi Phuong Lan
(2012), “Human resources of the traditional medicine and pharmacy at
provinces”, Practical Medicine No 8, Ministry of Health, 66 – 68.
4
ABBRIVIATION
TMP Traditional Medicine and Pharmacy
HS Health Staff
TMPS Traditional Medicine and Pharmacy Speciality
SB State Budget
5
BACKGROUND
1. Rational
The traditional medicine and pharmacy existed for a long time. The traditional
medicine and pharmacy developped a long with the national culture. For thousand of
years, the traditional medicine and pharmacy had excellences of prevention and
treatment. Vietnam is one of ASEAN countries and recognized in traditional
prevention and treatment.
Recently, The Central Party and Government issussed policies and strategies to
enhance the traditional medicine and pharmacy in prevention and treatment in order
to improve population’s health. However, up to now the quality of health services in
terms of traditional medicine and pharmacy is limited. Traditional medicine human
resources are limited in terms of quantity and quality, especially staff with high
quality. To develop the traditional medicne resources is not appropriate to respond
requirment of health care of people. This research filed is not enough carrying out.
Objectives of this thesis include:
1- To describe the distribution of traditional health staff in provincial traditional
hospitals among different geographical areas in 2010 .
2- To identify the countinuos training need for traditional medicine and
pharmacy staff in provincial traditional hospitals among different geographical areas
in 2010.
3- To evaluate effects of the training course in improving knowledge and skill in
terms of productio, recognition and distinguish traditional medicines for traditional
health staff in provincial hospitals
2. New findings of the thesis
2.1. This is a new thesis studies the distribution and quality of traditional health staff
in provincial traditional medicine hospitals in Vietnam and at the same time thesis
provides the continuous training need in traditional medicine for traditional health
and pharmacy staff.
2.2. Effects of the intervention to improve knowledge and skills in producing,
recognizing and distinguishing traditional medicines at provincial traditional
medicine hospitals. Thesis also provides effects of training traditional health and
pharmacy staff of the provincial traditional medicine hospitals. With a short time of
training (3 days), the knowledge of staff improved a lot in producing, recognizing and
distinguishing traditional medicines to improve quality of care.
6
2.3. The findings will be used for implementation of decision 07/2008/TT – BYT
dated 28/5/2008 (guidance of the countinuous training for health staff).
3. Science and practical meaning
3.1. Science meaning:
By using statistical software SPSS 10, the continous training need in traditional
medicine for health staff at provincial hospitals is big and necessary. The distribution
of traditional health and pharmacy staff is not equal and relevant for all areas. In
many provinces, there is no staff at professor/associate professor and PhD level.
3.2. Practical meaning and policy implication:
Findings of the thesis will help policy makers and planners to develop and
improve the quality and quantity of traditional medicine. It also help them to orient
and develop contents of continuous traditional training.
4. Thesis structure:
Thesis includes 124 pages, except annexes and divided into: Introduction 3
pages, Part 1: Literature review 33 pages, Part 2: Subject and Methodology 19 pages,
Part 3: Results 34 pages, Part 4: Discussion 27 trang, Conclusion 2 pages,
Recommendation: 1 page. Thesis includes 45 tables, 7 charts, 2 figues. Annex
includes 101 references (79 Vietnam, 22 English), tools, hospital list, list of staff
participating in the study.
CHAPTER 1
LITERATURE REVIEW
1.1. TRADITIONAL MEDICINE SYSTEM
• State management offices of traditional medicine
- Central: Dept.of Traditional Medicine, MOH
- Provincial: Dept. of Health centre
- District: Health C - Sở Y tế;
• Traditional hospitals: 59
- Central: 3
- Provincial: 53
- 3 hospitals from militery and police sector
7
1.2. HUMAN RESOURCES OF TRADITIONAL MEDICINE HOSPITAL
Total number of state traditional medicine staff increased in the last 5 years from
241498 in 2003 to 299100 in 2008. There are 56208 traditional medicine physicians
(including PhD and master levels), 49213 assistant physicians, 10524 pharmacists
and university level, 12533 pharmacists and secondary level, 67081 nurses, 22943
midwives, 882 traditional healers and 15682 technicians.
1.3. TRAINING AND RESEARCH IN TRADITIONAL MEDICINE
The training of human resources for traditional medicine mainly carriy out by
the Traditional Medicine Unversity and 2 Dept. of Traditional medicine of Hanoi
Mecical University and Ho Chi Minh City University. In some secondary medical
schools, the traditional Medicine Dept. did not fulfil their duty in training of
traditional medicine assistant physicians.
Some traditional medicine staff have been trained in some other university such
as Military Medical University, Hospital 103, Military Traditional Medicine hospital
and National Traditional Medicine Hospital, National Accupanture Hospital.
However, there are not enough traditional medicine staff as compared to requirment.
1.4. COUNTINUOUS TRAINING
The continuous training in traditional medicine is conducted mainly based on
the contribution of the trainees. There is no fund from government paying for the
continuous traditional medicin training.
CHAPTER 2
SUBJECTS AND METHOD
The thesis used two kind of study designs: cross-sectional study and
intervention study.
2.1. CROSS-SECTIONAL STUDY
2.1.1. Subjects
● Directors of the provincial traditional medicine hospital
● Head of Dept. of traditional medicine, provincial traditional medicine hospital
● Physicians at provincial traditional medicine hospitals.
● Pharmacists, provincial traditional medicine hospital.
8
2.1.2. Subject selection
Staff worked at the hospitals at least 6 months.
2.1.3. Subject select out
Staff worked at the hospitals but being absent at the time of study.
Subjects did not collaborate.
2.1.4. Cross-sectional study
2.1.4.1. Design: Combination of two kind of designs: qualitative and quantitative
using second data and available data.
2.1.4.2. Saple size
- Traditional medicine physicians: each hospital: 10 persons: 10 x 54 hosptals=
540
- Traditional medicine assistant physicians and nurses each hospital: 10 persons:
10 x 54 hospitals= 540.
- Directors of hospital: each hospital 3 người: 3 x 54 hospitals = 162.
- Head of dept. 432 persons
- Pharmacists: 5 x 54 hospitals = 270 persons
- Total : 1944 persons
2.1.4.3. Tools
- Administrative questionnaire forms: for directors of hospital.
- Interview questionnaire: face to face interview and sending questionnaires.
+ Face to face interview for physicians, asst. Physicians, pharmacists. They
come from 24 provincial traditional hospitals: Bến Tre; Hưng Yên; Phú Thọ; Thái
Bình; Hồ Chí Minh; Bình Thuận; Hà Tĩnh; Hà Nội; Bình Định; Cần Thơ; Đà Nẵng;
Hòa Bình; Hải Phòng; Lâm Đồng; Lạng Sơn; Tuyên Quang; Yên Bái; Bắc Ninh; Hà
Nam; Đồng Tháp; Thanh Hóa; Đồng Nai; Bình Dương; Sơn La representating for 8
geographical areas: Region I: Red River Delta; Region II: Northwest; Region III:
Central Coast; Region IV: Highland; Region V: Southeast; Region VI: Mekong River
Delta.
+ Administrative questionnaire interview implemented in remaining 30
provincial traditional hospitals.
2.1.5. Time: 06/2009 – 12/2010.
2.2. INTERVENTION STUDY
2.2.1. Subject
• Chairmen of Medicine committte of hospitals;
• Head of Pharmacy Dept.
• Staff who produce traditional medicine
9
2.2.2. Subject selection
Staff worked at the hospitals at least 6 months.
2.2.3. Subject selection out
Staff worked at the hospitals but being absent at the time of study.
Subjects did not collaborate.
10
2.2.4. Methodology
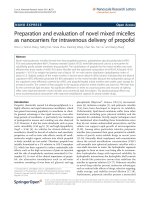
2.2.4.1. Design:
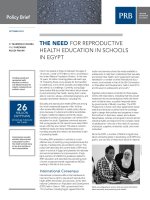
Figure 2.1. Intervention study chart
2.2.4.2. Sample size and sampling
[]
2
21
2
22111
2/1
2
21
)(
)1()1()1(2
PP
PPPPZPPZ
nn
−
−+−+−
==
−
−
β
α
Where:
n
1
: Sample size before intervention
n
2
: Sample size after intervention
Z
(1-∝/2)
: Confidence 95% (=1,96)
Z
(1-β)
: Power (=80%)
p
1
: % of staff who have knowledge and skill in traditional medicine before
intervention (p = 30%).
P
2:
% of staff who have knowledge and skill in traditional medicine before
intervention (p = 70%).
P: (p
1
+p
2
)/2
n
1
= n
2
= 30 staff. With Design effecf = 2. Thus, 60 staff interveiwed.
2.2.4.3. Intervention principle
- Content of training focused on improving knowledge and skill in traditional
medicine
- Easy to carry out in hospital.
2.2.4.4. Content of intervention
* Content of training:
- Recognation of 10 traditional medicines easy to get confuse.
- Producing 10 common traditional medicines
Pharmacist
Pre Test
Data 1
Training
Pharmacist
Post Test
Data 2
Comp
are
11
* Training method
- Theory:
+ Lecturing
+ Lecruring producing 10 traditional medicines: Hương phụ; Hoàng kỳ; Bạch
truật; Hạnh nhân; Hắc phụ tử; Bạch phụ tử; Bán hạ; Hà thủ ô đỏ; Thục địa; Ba kích
- Practice:
+ Recognition of 10 traditional medicines
+ Producing traditional medicines
* Organisation:
+ Lecturers: from Dept. of Traditional Medicine, Hanoi Medical University and
Hanoi Pharmacology University.
+ Criteria: Professors or associate professors in traditional medicine with 20
years in teaching
* Curriculum:
- One course in Tuyên Quang.
- Time: 10 days, from 06/01/2011.
Including 3 days in theory and 7 days in practices.
- Number of participants: 60.
2.2.4.5. Intervention effect evaluation
+ Pretest:
- Contents of training;
- Importance of training
- Time;
- Relevant level to daily working.
+ Assess the capacity of staff.
- Distinguish some traditional medicines: Questionnaire included 20 questions,
each question for 1 point. Four levels:
• Excellence: >=17 points;
• Good: 14- 16 points
• Average: 10 -14 points
• Poor: < 10 points
- Producing some traditional medicine: Questionnaire included 45 questions,
each question for 1 point, the assesment are divided into 4 levels:
•
Excellence: >=38 points;
• Good: 32-38 points
• Average: 22-31 points
12
• Poor: < 22 points
+ Effect evaluation after one year was carried out by using effect index: (EI):
EI (%) =
1
12
p
pp −
x 100
p1: Knowledge of health staff in traditional medicine before intervention
p2: Knowledge of health staff in traditional medicine after intervention
2.3. DATA ANALYSIS
● Available data from hospitals was entered and analyzed in software Excel
2003.
● Data form questionnaires was entered and analyzed in software SPSS 10.0.
● Results were presented in tables, frequencies, percentages, chart. Statistical
Test were used to compare events before and after intervention. P value was used to
define significant if < 0.05.
2.4. TIME AND PLACE
+ Time: 03 years, including:
- Phase 1: descriptive study: 06/2009 – 12/2010
- Phase 2: intervention study: 01/2011 – 06/2012
+ Place:
- Descriptive Study was carried out in 54 provincial traditional hospitals.
- Intervention studywas carried out in 20 provincial traditional hospitals.
2.5. ETHICS
● All subjects were asked and agreed to take voluntary part into the study.
Those who were not take voluntary part into the study were not fine.
● Private background information were kept secret. All information were used
for study only but not also for any purpose.
CHAPTER 3
RESULTS
3.1. DISTRIBUTION OF TRADITIONAL STAFF AT PROVINCIAL
TRADITIONAL MEDICINE HOSPITALS
3.1.1. Traditional health staff at province level
13
Table 3.1. Distribution of traditional health staff by training
Degree Number %
Physician 1086 17.2
University level Pharmacist 104 1.6
Secondary pharmacist 595 9.4
University nurse 32 0.5
Secondary nurse 1376 21.8
Asst. Physician 1284 20.4
Traditional healer 23 0.4
Others 1807 28.7
Total 6307 100.0
Among 6307 staff, doctor occupied 17.2%; University pharmacist was Dược sỹ
đại học chiếm 1.6% and Asst. Physicians was 20.4%
.
Table 3.2. Distribution of traditional health by scientific position
Position Number %
Prof/assoc.profesor 2 0.1
PhD
6 0.2
Doctor/Pharmacist grade II 25 0.7
Master
56 1.6
DS/BSCK1 203 5.6
Doctor/Pharmacist grade I 294 8.2
Others 3013 83.6
Total
3599 100.0
Percentage of skilled staff such as professor, PhD, specialists II was low
(1.0%).
Percentage of staff with post graduate such as master, specialist I was 7.2%,
graduate staff was 8.2% and other such as college, secondary and primary traditional
medicine school was 83.6%.
Table 3.3. Distribution of traditional medicine staff by specillity
Position Number %
Traditional 3599 57.0
General 1441 22.9
14
Others 1267 20.1
Total 6307 100
Percentage of staff with traditional medicine was 57%, general doctor was
22.9% and others was 20.1%.
3.1.2. Distribution of traditional staff by hospital level
Table 3.4. Distribution of traditional staff by hospital level
Percentage of traditional doctor at hospital level II was 18.4%, level III was
15.9%. There was statistic significant (p < 0.01).
Percentage of university pharmacist at hospital level II and III was 1.6% and
1.7%. There was no statistic significant (p > 0.05).
Table 3.5. Distribution staff by hospital level
Traditional health
staff
Hospital level
P
II III
Number
%
Number
%
Prof/assoc.profesor 2 0.1
PhD/doctor grade II
4 0.2 1 0.1
< 0.05
Pharmacist grade II 17 0.9 7 0.4
< 0.05
Master
42 2.2 13 0.8
< 0.05
Pharmacist/Pharmacist 111 5.9 89 5.2
< 0.05
Traditional health
staff
Hospital level p
II III
Number % Number %
Doctor 604 18.4 482 15.9 < 0.01
University
pharmacist
53 1.6 51 1.7 > 0.05
College pharmacist 288 8.8 307 10.1 <0.05
University nurse 17 0.5 15 0.5 > 0.05
College nurse 861 26.3 483 15.9 < 0.01
Asst. Physician 514 15.7 770 25.4 < 0.05
Others 940 28.7 922 30.4 > 0.05
Total 3277 100.0 3030 100.0
15
grade I
Doctor/doctor grade I 193 10.3 192 11.2
> 0.05
Secondary pharmacist
161 8.6 174 10.1
> 0.05
Others
1351 71.8 1242 72.2
> 0.05
Total
1881 100.0 1718
100.0
There is only 0.1% of all staff being professor/associate professor. They all
work in the hospital level II.
Percentage of post graduated staff work in the hosplital level II is more
frequently than that in hospital lev III ( p < 0.05).
57.6
55.8
20.5
25.7
21.9
18.5
0
10
20
30
40
50
60
70
Hospital level II Hospital level III
%
Traditional
General
Others
Figuue 3.1. Distribution of staff by training speciality and hospital level
Percentage of trained traditional medicine staff in hospital level II is less than
that in hospital level III (p > 0.05).
Percentage of trained general medicine staff in hospital level II is more than that
in hospital level III (p > 0.05).
16
3.1.3. Distribution of traditional medicine staff by geographical areas
Table 3.6. Distribution of staff by geographical areas
Staff
Region P
I (%)
n= 1251
II (%)
n= 1254
III (%)
n= 1051
IV (%)
n= 796
V (%)
n= 965
VI (%)
n= 990
Physician 19.2 13.1 18.9 14.3 17.3 14.3
< 0.05
University
pharmacist
1.8 1.5 1.3 1.6 1.7 1.3
< 0.05
Secondary
pharmacist
9.5 10.3 10.6 14.1 8.6 9.6
< 0.05
University nurse 1.3 0.4 0.2 0.9 0.9 0.5
> 0.01
Secondary nurse 20.6 22.3 19.3 20.0 18.5 16.4
< 0.05
Asst. physician 16.6 26.5 22.3 17.1 24.1 22.1
< 0.05
Others 31.0 25.9 27.4 32.0 28.9 35.8
< 0.05
Total 100 100 100 100 100 100
Percentage of doctor in the region I was hisghest (19.2%) and lowest in the
region II (13.1%) (p < 0.05).
Percentage of university pharmacist in region I was highest (1.8%), lowest in
the region III and VI (p < 0.05).
Percentage of university nurse was so different between regions, highest in the
region I (1.3%); lowest in he region III (0.2%), (p < 0.01).
17
Table 3.7.Distribution of specialized traditional medicine staff by geographical region
Traditional health
staff
Region P
I (%)
n = 752
II (%)
n= 724
III (%)
n= 640
IV (%)
n= 375
V (%)
n= 562
VI (%)
n= 546
Prof/assoc.profesor 0.3 0 0 0 0 0
-
PhD 2.1 0 0 0 0 0
-
Doctor and
pharmacist grade II
2.8 1.7 0.4 1.5 2.2 3.3
< 0.05
Master 2.8 0.6 1.9 2.1 2.4 1.1
< 0.05
DS/ BSCK1 8.0 6.4 1.3 5.3 8.2 7.8
< 0.05
Doctor and
pharmacist grade I
11.8 9.1 6.2 7.3 9.3 9.8
< 0.05
Others 72.2 82.2 90.2 83.8 77.9 78.0
< 0.05
Total 100 100 100 100 100 100
Percentage of specialized traditional medicine professor/associate professor is
highest (0.3%) and PhD (2.1%).
Percentage of specialized traditional medicine master in region I is highest
(2.8%), region V (2.4%) and lowest in region II (0.6%) (p < 0.05).
Percentage of university specialized traditional medicine in the region I is
highest (11.8%), lowest in the region III (6.2%) (p< 0.05).
Table 3.8. Distribution staff by specialized by region
Specilalized Region P
I (%)
n= 1251
II (%)
n= 1254
III (%)
n= 1051
IV (%)
n= 796
V (%)
n= 965
VI (%)
n= 990
Traditional
medicine
60.1 53.8 60.9 47.1 58.2 55.2
< 0.05
General 28.9 20.6 23.3 24.3 22.8 15.3
< 0.05
Others 11.0 25.6 15.8 28.6 19.0 29.2
< 0.01
Total 100 100 100 100 100 100
Percentage of traditional medicine staff in region III is highest (60.9%), region I
is (60.1%), and lowest in region IV (47.1%) ( p < 0.05).
Percentage of general medicine staff in region I is highest (28.9%), lowest in
region VI (15.3%) (p < 0.05).
18
3.3. CONTINUOUS TRAINING NEED IN TRADITIONAL MEDICINE BY
REGION
3.3.1. Continuous training need in traditional medicine
64%(788)
36% (440)
Yes
No
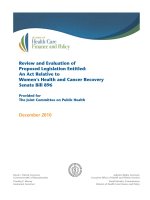
Figure 3.2. Percentage of staff reported without continuous training
There is only 36% of staff who received the continuous traning
Table 3.9. Training need for staff in future
Contents Number %
Staff received continuous training 440 35.8
Staff did not receive continuous
training
788 64.2
Staff received continuous training in
the last 5 years
194 43.2
Staff did not receive continuous
training in the last 5 years
255 56.8
In the last 5 years, there were 56.8% staff who were not receive any continuous
training course. Other staff who received continuous training course but they also
need to be updated knowledge and skills.
19
Table3.10. Contents of training for specialized traditional medicine staff
Contents Number %
Improve knowledge and skill in diagnosis of
traditional medicine 253 27.4
Improve knowledge and skill in treatment of
traditional medicine 393 42.5
Improve knowledge and skill in diagnosis in
general medicine 128 13.8
Improve knowledge of traditional medicine 440 47.6
n = 925
There was 27.4% of staff who need to be updated in diagnosis of traditional
medicine; 42.5% of staff who need to be updated in treatment of traditional medicine;
13.8% of staff who need to be updated in diagnosis of general medicine.
Table 3.11. Contents of training for pharmacist
Contents Number %
Distinguish some traditional medicines 242 78.8
Producing some traditional medicines 206 67.1
Producing some other traditional medicine 12 3.9
n = 307
There is 78.8% pharmacist who have training need in distinguish some
traditional medicines, 67.1% of them has training need in producing some traditional
medicines and 3.9% has training need in producing some other traditional medicines
20
3.3.2. Continuous traing need in traditional medicine by geographical
region
Table 3.12. Percentage of staff receiving continuous training in traditional medicine
by region
Contents
Region P
I (%)
n= 301
II (%)
n= 325
III (%)
n= 215
IV (%)
n= 70
V (%)
n= 158
VI (%)
n= 163
Traditional
medicine
42.3 34.3 39.3 40.0 29.9 26.4
< 0.05
57.7 65.7 60.7 60.0 70.1 73.6
< 0.05
100 100 100 100 100 100
Traditional
medicine in the
last 5 years
36.0 24.5 29.6 34.3 24.0 22.9
< 0.05
64.0 75.5 70.4 65.7 66.0 77.1
< 0.05
100 100 100 100 100 100
Percentage of staff who did not receive any knowledge in traditioan medicine in
the region VI was highest (73.6%), lowest in region I (57.7%) (p < 0.05).
Percentage of staff who did not receive any knowledge in traditioan medicine in
the last 5 years in the region VI was highest (77.1%), region II (75.5%), lowest in
region I (64.0%) (p < 0.05).
Table 3.13. Training need in traditional medicine by region
Contents
Region P
I (%)
n = 139
II (%)
n = 75
III (%)
n = 90
IV (%)
n = 24
V (%)
n = 59
VI (%)
n = 56
Improve
knowledge and
skill in diagnosis
of traditional
medicine
43.3 40.8 32.9 20.8 41.2 25.0
< 0.05
Improve
knowledge and
skill in treatment
of traditional
medicine
72.2 53.5 57.0 66.7 58.8 55.8
< 0.05
Improve
knowledge of
63.0 70.7 51.9 41.7 37.3 36.5
< 0.05
21
traditional
medicine
Improve
knowledge of
treatment without
using medicines
1.6 2.7 1.3 0 4.8 0
< 0.05
Percentage of staff who need training in improving knowledge and skill to
disgnosis was less than 50%, in which highest in region I (43.3%), lowest in region
IV (20.8%), (p < 0.05).
Percentage of staff who need training in improving knowledge and skill to treat
and care was more than 50%, in which highest in region I (72.2%), lowest in region II
(53.5%), (p < 0.05).
Percentage of staff who need training in improving knowledge in traditional
medicines is highest in region II (70.7%), lowest in region VI (36.5%), (p < 0.05).
Percentage of staff who need training in improving knowledge and skill to treat
and care without using medicines is highest in region V (4.8%), lowest in region IV
and VI (0%), (p < 0.05).
Table 3.14. Training need in traditional medicine for pharmacist by region
Contents
Region P
I (%)
n = 55
II (%)
n = 112
III (%)
n = 47
IV (%)
n = 11
V (%)
n = 37
VI (%)
n = 50
Skill of provision
of medicine
45.6 35.7 44.5 39.2 34.8 47.3
< 0.05
Distinguish some
traditional
medicines
79.7 73.6 75.5 75.3 76.6 76.2
> 0.05
Skill in producing
some traditional
medicines
82.1 77.3 76.4 70.3 71.2 78.9
> 0.05
Knowledge in
producing some
traditional
medicines
30.9 23.7 25.7 28.2 31.1 34.2
> 0.05
22
Percentage of pharmacist needs to be updated knowledge and skill of provision
of medicines was less than 50%, in which highest in region VI (47.3%), lowest in
region V (34.8%), ( p < 0.05).
Percentage of pharmacist needs to be updated knowledge and skill of distinguish
some traditional medicines is high, highest in region I (79.7%), region V (76.6%),
lowest in region II (73.6%), (p> 0.05).
Percentage of pharmacist needs to be updated knowledge and skill of producing
some traditional medicines is high (>50%), highest in region I (82.1%), region VI
(78.9%), lowest in region IV (70.3%), (p> 0.05).
3.4. EFFECTS OF TRAINING TO IMPROVE CAPACITY FOR
PHARMACIST
Table 3.15. Effects of training to distinguish some traditional medicines
Effects
Before intervention After 1 year of intervention
Effect index
(%)
P
Number % Number %
Excellent 5 8.3 37 61.7 643.4
< 0.05
Good 8 13.3 11 18.3 27.3
> 0.05
Average 25 41.7 12 20.0 (- 108.5)
> 0.05
Bad 22 36.7 0 0.0 -
-
Total 60 100 60 100
After one year of intervention, the effect of distinguish some traditional
medicines increased significantly with high effect index (643.4%), good (27.3%).
23
Table 3.16. Effects of training to increasing capacity to producing some traditional
medicines
Effects
Before intervention
After 1 year of
intervention
Effect
index (%)
P
Number Number Số lượng Tỷ lệ %
Excellent 3 5.0 32 53.3 966.0
< 0.05
Good 9 15.0 19 31.7 52.6
> 0.05
Average 24 40.0 9 15.0 (-166.7)
> 0.05
Bad 24 40.0 0 0 -
-
Total 60 100 60 100
After one year of intervention, the effect of producing some traditional
medicines increased significantly with high effect index (966%), good (52.6%).
CHAPTER 4
DISCUSSION
4.1. DISTRIBUTION OF HEALTH STAFF IN PROVINCIAL TRADITIONAL
MEDICINE HOSPITALS BY REGIONS
4.1.1. Distribution of traditional medicine staff by hospital level
Currently, there is only 0.03% professor and associate professor and 8.02% staff
with post graduated levels working in the provincial traditional medicine hospitals. It
is shown that there is a lack of of them ta provincial tarditional medicne hospitals.
According to decision 03/2004/TT – BYT dated 03/03/2004 of the Minister of Health
in the classification of the hospital, percentage of post graduated staff needs to be
increased to strengthen quality of the hospitals. Percentage of the post graduated staff
at central hospital is higher than that in provincial traditional medicine. There is only
9 professors and associate professors at all traditional medicine hospitals working at
central hospitals. In the whole traditional hospitals there are only 27 PhD, in which
there are 6 PhD working at provincial traditional medicine hospitals. It shows that
there is a big different qualified staff between central traditional medicine hospitals
and provincial traditional medicine hospitals in Vietnam.
24
4.1.2. Distribution of traditional medicine staff by geographical regions
There is an equal of traditional medicine staff between geographical regions
both quality and quantity. About quantity of staff, the staff are physician in the region
I mainly (19.2%), percentage of university nurses is hghest (1.3%); in
Haiphongnumber of physicians are 31/145 (21.4%). In the region II, percentage of
physician is lowest (13.1%), secondary nurse is (22.3%) and assistant physician
(26.5%). In the region III, the distribution of traditional medicine staff is same as
region I. In the region V, traditional medicne staff is distributed rather equal,
percentage of university nurse is low (0.9%).
About the quality of staff, in all provincial traditional medicine hospitals there is
no professor/associate professor and PhD. In the region I, percentage of
professor/associate professor is 0.3% and 1.3% PhD and in region VI percentage of
PhD is 0.1%. In all region percentage of doctor grade I is high, in the region III,
percentage of doctor grade I is lowest (0.7%) and there is a small number of masters
and doctor grade II. Percentage of doctor in all region occupyies a big proportion and
same as each other, lowest in the region IV (5.3 %), highest in the region V (8.7%).
In all regions, there are staff at university, secondary and primary levels. About
quality of traditional medicine staff, in the region I there are staff such as professor
and associate professor (0.3%) and PhD (2.1%). In the region II, VI the percentage of
master is low. Percentage of doctor grade I in the region I is 8.2%, lowest in the
region III (1.3%).
4.2. CONTINUOUS TRAINING NEED FOR STAFF IN PROVINCIAL
TRADITIONAL HOSPITALS.
4.2.1. Continuous tarining need for traditional medicine staff in provincial
hospitals
4.2.1.1. Continuous training
In the last 5 years, there is a big part of traditional medicine staff trained
continuously. However, there is a big number of staff without re-training to improve
thier professional (64.2%). In other side, trained staff need to be updated new
infromation and technologies. This prove the continuous training need for staff at
provincial hospitals.
4.2.1.2. Contents of the continuous training needs
+ For traditional medicine physicians: contents of the training are knowledge
and skills in diagnosis (31.8%); treatment (42.4%).
25
+ For pharmacist: training need in knowledge in traditional medicines is too big
in all regions. Knowledge in producing some traditional medicnes requested by
hospitals, in the region I is 82.1 %, region IV is 70.3%. The training need in provision
of traditional medicines and distinguish some traditional medicnes.
4.3. EFFECTS OF TRAINING
- After one year of intervention the knowledge in recognition some traditional
medicines is increased significantly. After one year, 61.7% of the traditional
medicine staff recognised correctly some traditional medicines as compared to 8.3%
before intervention (effect index=643.4%).
- After one year of intervention the knowledge in distinguish some traditional
medicines is also increased significantly.
- After one year of intervention the skill of prodicing some traditional medicines
is also increased significantly (5.06% before training and 53.3% after training) with
effect index is 966.0%. After one year of intervention no staff with bad skill of
producing traditional medicnes.
CONCLUSION
1. Distribution of traditional medicine staff by geographical region
- The distribution of staff by geographical regions is not appropriate and equal,
in the region I, percentage of physician is highest (19.2%); lowest in the region II.
Percentage of pharmacist is low in all region.
- In all regions at provincial traditional medicne hospital, there is no profesor
and associate professor in specialised traditional medicine and PhD. There is i small
number of them work in the region I (0.3%). Percentage of university physician is
high and rather equal and appropriate. In all region, there is a big proportion of staff
with university, secondary and primary llevels.
2. Continuous training need for traditional medicine staff
- The training need in updating knowledge for physicians is high, contents of the
training need are traditional medicines, improving skill of diagnosis and treatment.
- The training need in updating knowledge for pharmacists is high, contents of
the training need are distinghuish and producing some traditional medicines.
3. Effects of intervention of training