WAVE OVERTOPPING AT SEA DIKES WITH CROWNN WALLS IN THE NORTHERN COASTAL DELTA OF VIETNAM
Bạn đang xem bản rút gọn của tài liệu. Xem và tải ngay bản đầy đủ của tài liệu tại đây (1.08 MB, 27 trang )
MINISTRY OF EDUCATION AND
TRAINING
MINISTRY OF AGRICULTURE
AND RURAL DEVELOPMENT
WATER RESOURCES UNIVERSITY
NGUYEN VAN THIN
WAVE OVERTOPPING AT SEA DIKES
WITH CROWNN-WALLS IN THE NORTHERN
COASTAL DELTA OF VIETNAM
Specialization: Hydraulic Engineering
Code No : 62-58-40-01
SUMMARY OF DOCTORAL DISSERTATION
HA NOI, 2014
This scientific work has been accomplished at Water Resources University
Advisor 1: Assoc. Prof. Nguyen Ba Quy
Advisor 2: Prof. Ngo Tri Vieng
Reviewer No. 1 Prof. Dinh Van Uu
Reviewer No. 2 Prof. Tran Dinh Hoi
Reviewer No. 3 Prof. Tran Dinh Hoa
This Doctoral Thesis will be defended at the meeting of the University Doctoral
Committee in room No………… on …….
This dissertation is available at:
- The National Library
- The Library of Water Resources University
1
INTRODUCTION
1. Rationale
Viet Nam is a nation that is seriously affected by climate change and sea level
raise. There are many centres of economy and culture along the coastline. In the
north, sea dikes are relatively low with narrow crests, steep seaward and
landward slopes; most dikes are directly exposed to wave attack. Historical
records show that wave overtopping often causes damage to dike crests and
landward slopes. One of the effective measures to reduce overtopping is the use
of (low) crown-walls, because heightening dikes or constructing outer berms are
costly and not feasible, especially dikes with narrow margins. Till now, studies
into the influence of low crown-walls and interaction between wave-wall and
overtopping are limited. A better understanding of the influence of crown-walls
and promenade on overtopping is necessary to improve the present dike design
guidelines in Viet Nam. These facts lend the foundation for this thesis that is to
investigate “Wave Overtopping at sea dikes with crown-walls in the northern
coastal delta of Vietnam”.
2. Research objectives
The thesis aims to investigate the influence of low crown-walls on overtopping
discharge and the behaviour of overtopping flow at sea dikes. By doing so, the
reliability of overtopping estimation is increased to improve the dike design
guidelines currently applied in Viet Nam.
3. Scope of the study
Investigation of wave overtopping at sea dikes with low crown-walls in the north
of Viet Nam.
2
4. Research contents
Review on overtopping on sea dikes with low crown-walls; Physical model to
investigate the effects of low crown-walls on wave overtopping at sea dikes;
Numerical and physical examination of the wave-wall interaction and
overtopping flow on sea dikes with low crown-walls; Case study-Overtopping at
Giao Thuy dike, Nam Dinh province
5. Approach and study methods
5.1. Approach
To obtain the objectives, the author carried out a literature study on wave
overtopping at sea dikes with low crown-walls to select an approach that is
inherent and also creative, suitable for Viet Nam.
5.2. Study approaches
Literature review; Physical and numerical modelling; Application.
6. Implications
Building low crown-walls on seadikes to heighten the crest level, reduce wave
overtopping is considered technically and economically viable in Viet Nam.
There exists limited research into overtopping at sea dikes with low crown-walls,
especially the interaction between wave and wall. Therefore, better
understanding of the wall influence on wave overtopping discharge and the
overtopping flow characteristics will help improve the reliability of design for
this type of sea-dikes in Vietnam.
3
7. New contributions
- Insights into the influence of low crown-walls on wave overtopping and
the merit of wall promenade through a detailed examination of the wave-
wall interaction;
- Empirical equations to determine the overall influence factor of low
crown-walls for regular waves (Figure 2-12);
- Relationship between splash height and wave parameters and wall
geometry (Figure 2.13);
- Proposal on the use of a new sea-dike cross-section with crown-walls and
promenade, appropriate for the northern coastal detla of Viet Nam (Figure
4.8).
8. Thesis contents
In addition to the Introduction, Conclusions and Recommendations, the thesis
consists of 04 chapters
Chapter 1: Literature study on overtopping on sea dikes with low crown-walls;
Chapter 2: Physical model to investigate the effects of low crown-walls on wave
overtopping at sea dikes;
Chapter 3: Wave-wall interaction and overtopping flow on sea dikes with low
crown-walls;
Chapter 4: Case study-Overtopping at Giao Thuy dike, Nam Dinh province.
CHAPTER 1 REVIEW ON OVERTOPPING ON SEA DIKES WITH
LOW CROWN-WALLS
1.1 Introduction to research into overtopping at sea dikes
Due to significant changes of climate and environment, the frequency and
intensity of natural hazards gradually increase especially storms, tide and sea
level rise. As a result, overtopping at sea dikes remains as a risk to countries with
4
sea. There exists limited research on overtopping at sea dikes with low crown-
walls and no one is comprehensive yet. Therefore, studies on overtopping at sea
dikes are essential in Viet Nam and elsewhere
1.2 Causes, failure mechanisms of sea dikes and measures
1.2.1 Causes of damage to sea dikes
There are many failure mechanisms of sea dikes but historical records show that
wave overtopping mainly causes damage to the dike crest and landward slope
and dike breaching as a consequence.
1.2.2 Damage mechanism due to wave overtopping
There are many mechanisms leading to dike failure, from local damage to overall
collapse; the reasons, influence factors, consequences are very various. Analysis
indicates that dike failures due to wave overtopping are the most common.
1.2.3 Measures to reduce overtopping at sea dikes in the north
Nowadays, there are several ways to reduce overtopping at sea dikes, ‘hard’ and
‘soft’ solutions such as submerged breakwaters, concrete blocks, seaward berms,
high crests and mangrove … However, the conditions of construction space and
economy are limited low crest-walls are popular and effective in reducing
overtopping at sea dikes in Viet Nam.
1.3 Sea dikes with low crown-walls in the northern coastal delta
Sea dikes with low crown-walls (W/Hs ≤ 0.5) located near the seaward edge are
very popular in Viet Nam. This is considered as a simple and effective method
to increase the crest level, reduce overtopping in the present situation. Crown-
walls are applied where there is no more land to enlarge the dike cross-sections
or budget is constrained; or it is not allowed to heighten the crest level in order
to reserve residence and tourism areas.
5
1.4 Research into overtopping at sea dikes with low crown-walls
1.4.1 TAW 2002
In TAW (2002), the influence of crown-walls on overtopping discharge is not
clear because it is an unknown variable; crown-walls increases the equivalent
slope that the discharge becomes greater. However, the discharge is then
corrected by a factor
v
. This overall influence factor only takes into account the
seaward inclination but not the interaction between wave-wall, overtopping flow
and the wall dimensions.
1.4.2 Viet Nam
Till now, there is limited research into overtopping at sea dikes with low crown-
walls in Viet Nam. Recent works do not cover all aspects of overtopping at
Vietnamese dikes. Tuan et al. (2009) proposed a new method to assess the effect
of crow-walls on overtopping. However, the influence of promenade was not
discussed (S = 0). Tuan (2013) investigated the influence of crown-walls and
promenade on overtopping. Though, he did not consider the interaction between
wave-wall and the behaviour of overtopping flow when the wall exists.
Furthermore, reduction effect was not determined for regular waves.
1.5 Conclusions of chapter 1
Overtopping is a danger to sea dikes. Damage due to overtopping is the most
important. Crown-walls are effective to heighten the crest level and reduce
overtopping. Studies on overtopping from TAW (2002) to Tuan (2013) are not
complete. In line with Tuan (2013), the author performed tests with physical
model to investigate the influence of crown-walls on regular waves, especially
the interaction between wave-wall and the flow behaviour at walls. The thesis
used numerical models from NLSW to RANS-VOF to consider the wall effects
with regard to the interaction between wave-wall and the flow behaviour at walls.
6
The obtained results will provide insight into the characteristics of overtopping
at dikes with low crown-walls, partly improve the dike design in Viet Nam.
CHAPTER 2 PHYSICAL MODEL TO IVESTIGATE THE EFFECTS
OF LOW CROWN– WALLS ON WAVE OVERTOPPING AT SEA
DIKES.
2.1 Study objective
Consideration of the influence of low crown-walls on overtopping discharge, the
interaction between wave-wall and the behaviour of overtopping flow at sea
dikes with walls.
2.2 Model similitude
For the similarity between model and prototype, three criteria are required
geometry, kinematic and dynamic. For the similitude of wave, model has to be
geometric similarity; the scale has to follow the Froude criterion. In short wave
tests with geometrically undistorted models, the Froude criterion is automatically
satisfied.
2.3 Experiments with regular waves
2.3.1 Wave flume
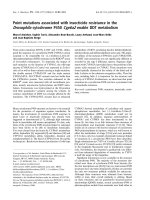
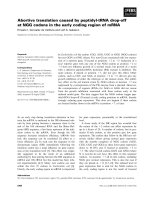
The Holland wave flume is 45 m long, (effective length of 42 m), 1.2 m high,
and 1.0 m wide. The wave maker, which is equipped with an advanced automated
system of Active Reflection Compensation, is capable of generating regular and
irregular waves (JONSWAP) up to 0.3m in height and 3.0 s in peak period
(Figure 2.1).
7
2.3.2 Dike model and parameters
The dike model dimensions and testing parameters are selected according to a
model length scale of 1/10. The dike slopes were smooth and impermeable, 70
cm height with a seaward slope of 1/3. The low crown-walls were 4, 6 and 9 cm.
The walls were made detachable to allow varying wall height (W) and promenade
width (S) with regard to test scenarios. The wall could be moved back and force
to change the promenade from 0 to 10 and 20 cm. The foreshore was 24.5 m long
and 1/100 steep (Figure 2.5).
2.3.3 Test programme
A water depth of d = 0.60m was chosen for testing. A group of 3 wave gauges
was positioned at the dike toe and another gauge was 24.5 m away from the toe.
A camcorder with high resolution was mounted normal to the flume to capture
50 frames/second in order to observe the interaction between wave-wall and
overtopping flow. Each test consisted of 10 regular waves and stopped before
these got disturbed by reflected ones (Table 2.1).
Figure 2.1 Overview of the wave flume.
Hình 2.1 Toàn cảnh máng sóng sử dụng thí nghiệm
Figure 2.5 Test set-up for regular waves.
8
2.3.4 Test procedures and measurement parameters
Preparation time was from June to August 2012 and test duration lasted from
August till September 2012. Measurement parameters includes: wave height H,
wave period T, mean overtopping discharge q, splash height H
b
, flow thickness
on wall crest H
t
, crest freeboad R
c
2.4 Data analysis
2.4.1 Influence of crown-walls on wave overtopping discharge
The overall influence factor by crown-walls is the product of component factors
due to wall height and wall promenade, respectively.
(2-11)
Determine the overall influence factor
v
(measured) and
v
(computed),
perform regression analysis to establish the relationship between these
parameters, derive two coefficients c
1
=1.26, c
2
= 1.44 (Figure 2.12)
(2-12)
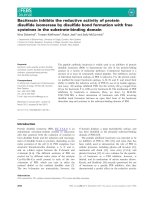
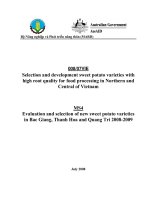
2.4.2 Wall influence on splash height
The splash height was estimated by image analysis with Matlab. The author
established the relationship between
and
, which reads y = 1.544e
-30.9x
with R
2
= 0.624. Based on this curve, one may roughly predict splash height with
regard to wave and wall characteristics (Figure 2.13).
Table 2.1 Test programmes with regular waves
Number
of tests
Wave parameter
R
c
(m)
W (cm)
S (cm)
H (m)
T (s)
40
0.16- 0.24
1.5 – 2.5
0.10
0; 4; 6; 9
0; 10; 20
9
Figure2.10 Overall influence factore of low walls
v
(measured - computed)
Figure 2.13 Relationship between
and
Hình 2.13 Biểu đồ quan hệ
với
y = 1.544e
-30.9x
R² = 0.624
.000
.500
1.000
1.500
2.000
2.500
.000 .005 .010 .015 .020 .025 .030 .035 .040
H
b
/H
S.H/g.W.T
2
10
2.5 Conclusions of chapter 2
The thesis successfully established empirical formulas estimating the overall
influence factor by crown-walls on mean overtopping discharge for regular
waves (2-12) and functions of splash height with regard to wave and wall (Figure
2-13).
CHAPTER 3 INTERACTION BETWEEN WAVE – WALL AND
OVERTOPPING FLOW ON SEA DIKES WITH LOW CROWN-WALLS
3.1 Problem definition
At different levels of detail, the thesis modelled overtopping flow at sea dikes
with low crown-walls using several programmes including NLSW (Non-Linear
Shallow Water) and RANS-VOF (Reynolds Averaged Navier Stokes – Volume
Of Fluid).
NLSW modelling is simple and fast in calculation, e.g. 1000 waves can be
simulated in 5 to 10 minutes. This program can estimate relatively well mean
overtopping discharge at dikes with mild slope and have no crown-wall. It has
several shortcomings when applied to structures with complicated shape, e.g.
dikes with crown-walls. The thesis used NLSW (Tuan and Oumeraci, 2010) to
simulate and compute with regular waves. The obtained results were compared
to experiments in wave flume.
RANS–VOF modelling (COBRAS-UC, numerical wave flume) is able to
simulate the interaction between wave – wall and flow at structures of any shape
(vertical walls, hollow walls …), from wave generation at boundary to wave
propagation as in physical flumes. However, the calculation efficiency is low. It
takes many hours to simulate some seconds in real time when run on a normal
computer so that it is difficult to apply to regular waves.
Therefore, NLSW of Tuan and Oumeraci (2010) was used to validate the
estimated values of discharge. The computations were compared to
measurements with irregular waves. Both numerical and physical flumes were
11
deployed to assess the interaction between wave – wall, i.e. overtopping flow
characteristics.
3.2 NLSW modelling (Tuan and Oumeraci, 2010)
3.2.1 Basic formulations
The model by Tuan and Oumeraci (2010) is based on the flux-conservative form
of the NLSW equations solved with a high order total variation diminishing
(TVD), Roe-type scheme:
( , )
( , )
U F x U
S x U
tx
(3-1)
where conserved vectors
U
,
( , )F x U
and source term vector
( , )S x U
are
defined as follows:
()
h
Ux
uh
(3-2)
22
( , )
/2
uh
F x U
u h gh
(3-3)
0
( , )
()
bx f r
S x U
gh S S S
(3-4)
in which g is the gravitational acceleration, h is the flow depth, u is the horizontal
flow velocity, S
bx
and S
f
are bed slope and friction slope, respectively. Note that
S
r
is the surface roller slope term, added by Tuan and Oumeraci (2010) to account
for the influence of wave breaking through the drastic motion of surface rollers
in the surfzone on the mean flow.
3.2.2 Wave overtopping of irregular waves
NLSW cannot model a vertical wall because the shallow water limit is violated,
a pragmatic manipulation of the wall geometry is necessary. The author used two
12
pragmatic approaches: equivalent wall and equivalent freeboard (Figure 3.1 and
3.2).
Mean water levels were used in combination with wave signal recorded by
gauges, which were positioned in front of the model dike toe (the closer these
gauges to the toe, the higher accuracy the results of NLSW).
Figure 3.1 Conversion of crown-walls into slope (TAW-2002)
Figure 3.2 Conversion of crown-walls into equivalent freeboard method
On the landward side, the outflow boundary used a water level constant and very
low with regard to crest level (in order to prevent any influence on overtopping).
The simulation time was the same as the physical model experiments (1000.Tp
~ 10 minutes PC). In general, the computed results agree reasonably well with
the experimental data, R
2
= 0.88 and 0.87 for the first and second approaches,
respectively. The mean prediction error is 39.8% with a standard deviation of
56.2%. However, discrepancies still exist for some particular cases of very low
overtopping rates at high walls and walls without promenades. This is because
13
the strong interaction between wave-wall could not completely be resolved in
NLSW by using pragmatic wall schematizations.
Figure 3.3 Wave overtopping computation with wall schematization
according to (TAW 2002): measured versus computed
Figure 3.4 Wave overtopping computation with equivalent freeboard
approach: measured versus computed
14
3.3 RANS-VOF modelling (COBRAS-UC, numerical simulation)
3.3.1 Numerical wave flume
Numerical wave flumes are capable of modelling the wave-structure interaction
that is very comparable to physical flumes. They are applicable for almost any
complex geometric and structural configurations. They have been validated
against experimental data giving reliable result.
3.3.2 Basic formulations
In the model, the mean turbulent flow is based on 2DV RANS equations
0
i
i
u
x
(3-12)
11
i i i
j i i j
j i j j
u u p u
u g u u
t x x x x
(3-13)
and the turbulence closure is the (k-
) transport equations, which relate the
fluctuating components of the flow to the turbulence kinetic energy k and the
dissipation rate of turbulence
i
t
j i j
j j k j j
u
k k k
u u u
t x x x x
(3-14)
2
12
i
t
j i j
j j j j
u
u C u u C
t x x x k x k
(3-15)
where
i
u
is mean velocity in the i- the direction (i, j =1, 2 for a two dimensional
flow),
p
is mean pressure,
is fluid density, g
i
is gravitational acceleration in
the i-th direction,
ij
uu
is Reynolds stresses modelled according to the
nonlinear eddy viscosity. The empirical coefficients are
k
= 1.0,
=1.3, C
1
=
1.44, C
1
= 1.92;
=
/
and
t
= C
d
k
2
/
(C
d
= 0.99) are kinematic and eddy
viscosity, respectively.COBRAS-UC resolves the flow on a non-uniform
rectangular grid. The arbitrary free surface is tracked using the Volume of Fluid
(VOF) method.
15
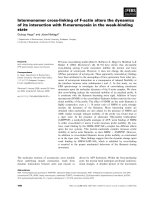
3.3.3 Overtopping discharges of irregular waves
Each train consists of at least 1000 waves (1000.T
p
= 2200s) which can be
simulated in 75hours on a 3.1GHz processor - 4GB RAM PC. Because of this
low efficiency, only 14 scenarios were considered. These are combinations of a
wave condition at the generator (H
m0
= 0.10 m, T
p
= 2.2 s and water depth of 0.55
m) and several seaward slopes and crown-walls (height of W= 6 and 9cm; with
and withour promenade).
Figure 3.7 Wave overtopping of irregular waves: COBRAS-UC vs. NLSW
model
The study compares values of mean overtopping discharge obtained from
measurements with physical models and computation with COBRAS-UC,
NLSW (two ways of varying equivalent walls). Apparently, COBRAS-UC
works more properly than NLSW with mean errors of 60.1% (a standard
deviation of 63.2%) and 129.4% ( 100.6%) for PA1 and PA2, respectively.
The results from COBRAS-UC and measurements match relatively well with
a mean error 39.7% (a standard deviation of 24.5%). However, COBRAS-
16
UC may produce an error up to 63% in the cases of small discharge (Figure
3.7).
3.3.4 Wave overtopping of regular waves (discharges and wave-wall
interaction)
3.3.4.1 Mean overtopping discharge
With 40 experiments performed on 10 dike models, regular wave trains were
generated to evaluate the mean overtopping discharge in for each test. The CPU
time for each test was around 6 hours on a standard PC (or about 1 hour CPU
time equals to 10 seconds of flow time). Discharges predicted by COBRAS-UC
were compared to the experimental data. Generally speaking, COBRAS-UC
appears to reliably estimate overtopping rates at low crown-walls of various
configurations (R
2
= 0.95). The mean error is 23.4% with a standard deviation
of 30.2 %. Considerable discrepancy can be found for a few cases of high walls
(W=9cm, open triangles). In comparison with irregular waves, the overall
agreement is relatively good (Figure 3.8).
Figure 3.8 Wave overtopping of regular waves: measured vs computed by
COBRAS-UC
17
3.3.4.2 Interaction between wave – wall and flow
At first, the wave – wall interaction, which results in wave overtopping at sea
dike, is assessed using captured video images. A wave overtopping event can be
characterised through four successive phases: contact splash, fall-over, major
green overtopping and withdrawal. These phases are briefly described as follows.
The process of wave overtopping starts as the wave tongue collides with the wall
and results in a violent jet (splash) into the air (Figure 3.13).
In the second phase, the splash collapses as it reaches a certain height and falls
over the wall. At the end of this phase, a green flow over the wall is formed
(Figure 3.14).
If wave continues to thrust wave overtopping in the third phase simply follows
the earlier buffer flow in the form of green overtopping to obtain a maximum
depth above the wall crest (Figure 3.15).
Green wave overtopping continues until wave retreats on the seaward slope in
the last phase (Figure 3.16).
Snapshots of the flow computed by the model at all computed instances were
also reviewed to determine the corresponding maximum splash height for
comparison with the physical experiments. Numerically, COBRAS-UC is able
to capture a fragmented splash but not that with small individual drops (tiny
sprays) like in the physical models. Physically, the approximation of the free
surface tracking method (VOF), exclusion of the surface tension as well as
disregard of air entrainment an aeration processes are possible causal factors.
Practically, coarse grid resolution relative to the (extremely small) size of
individual drops employed in the numerical model may also play a role. These
issues require much more sophisticated studies as well as computer capacity to
be resolved. At present, this effect on wave overtopping with respect to the dike
design is neglected. The four-phase process of the wave-wall interaction for Case
REW6S20_4 is now examined in detail with COBRAS-UC. The model
considerably under-predicts the water surface profile in the splashing area around
the wall during the first two stages (Figures 3.13 and 3.14). In the mean time, the
surface profile in the last two stages, where mainly simply green overtopping
take places, is very well predicted by the model (Figures 3.15 and 3.16).
18
Figure 3.13 Wave splash at wall t= 27.1s
( Measured)
Figure 3.14 Overtopping flow on wall
crest t=27.3s ( Measured)
Figure 3.15Overtopping flow
t = 27.5s ( Measured)
Figure 3.16 Run-down t=27.8s
( Measured)
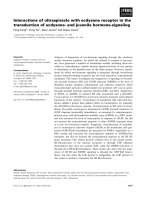
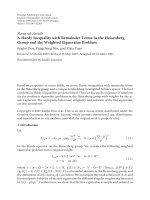
At a lower level of detail, Figures 3.17 and 3.18 respectively show the model
prediction of the maximum splash height (occur in phase , Figure 3.13) and the
maximum green flow depth above the wall (occur in phase 3, Figure 3.15)
compared with the experimental data. Under the same wave condition and wave
height, the maximum splash height decreases as the promenade width decreases
(Figure 3.17). Also, within the wall geometry and wave parameters considered
herein, a higher wall (relative to the wave height) would cause a higher splash
height.
19
Figure 3.17 Maximum splash height as a function of wall height W and
promenade S: model (filled dots) versus experiment (open dots)
Figure 3.18 Maximum green depth (above wall crest): model versus
experiment
20
a) Splash height t = t*- 0.2
b) Splash height t = t*- 0.1
c) Splash height t = t*- 0.1
Figure 3.19 Snapshots of wave splashing showing the wall influence with
and without promenade
Figure 3.19 shows comparative snapshots of the wave-wall interaction at various
instances before and at maximum splashing, under the same wave condition
(herein Hs= 0.24m,Tp = 2.5 s), for two test cases of the same wall height with
and without promenade (REW9S0_4 and REW9S10_4). The particle velocity of
21
the wave tongue noticeably slows down from around 2.0 m/s at the instance of
wave hitting the wall (t = t* 0.2s, Figure 3.19a) to 1.0 - 1.5 m/s for S = 0 cm
(Figure 3.19c, left) and to 0.5 - 1.0 m/s for S = 10 cm (Figure 3.19c, right) when
the splash is maximum (t = t*).
Moreover, the difference in the flow characteristics between the two cases of with
and without promenade is remarkable. When there is no promenade (S = 0), wave
run-up flowing along the slope is easily directed upwards by walls, thus resulting
in high splash into the air. The effectiveness in reducing the flow momentum or
reducing wave overtopping is thus not very high. When the promenade exists
(S>0), the run-up tongue is diverted to flow along the dike crest (i.e. more or less
in the horizontal direction) before hitting the wall. In this way, the run-up energy
is more effectively dissipated during impact with walls. The resulting splash
height and wave overtopping are therefore considerably smaller than in the
former case (S=0).
To conclude, walls with promenades (S > 0) are clearly more advantageous than
those without promenades (S =0) in terms of wave overtopping and splash height.
In the situation of high wave splashes in combination with storm surges, it is
difficult to evaluate the increase in overtopping discharges as well as the damage
to dike crests and landward slopes when splashing water drops.
3.4 Conclusion of chapter 3
The thesis applied both a NLSW model and a COBRAS-UC one to estimate
overtopping at sea dikes with low crown-walls. Experiments with regular and
irregular waves were carried out to validate these models. Overtopping
discharges predicted with NLWS model are reliable. Nevertheless, considerable
errors can be found for high walls (W/Hs > 0.5) and without promenades (S=0).
COBRAS-UC is very capable of reliably predicting wave overtopping discharges
as well as the free surface profile of green wave overtopping. The model under-
predicts the maximum splash height. Walls with promenades appear to be more
effective in dissipating wave energy and better improve wave splashing
conditions than walls without promenades.
22
CHAPTER 4 CASE STUDY – OVERTOPPING AT GIAO THUY DIKE,
NAM DINH PROVINCE
4.1 Introduction to Giao Thuy dike
Giao Thuy dike is 32 km long protecting 205799 people and 23207ha of
agricultural land. The crest level is at +5.0 m above mean sea level, the crow-
wall height is W= 0.5m, there is no promenade on the seaward side S = 0; outer
slope inclination is1/4, crest width is B = 5m, the design water level is 2.29m.
4.2 Overtopping calculation
Using results obtained in chapters 2 and 3, the author established tables
predicting overtopping parameters including: mean discharge and splash
height (Tables 4.1, 4.2 and 4.3). A model was developed to estimate
overtopping and can be used for studying and designing sea dikes. The model
can be upgraded easily to perform more properly.
4.3 Overtopping calculation and design of dike cross-section
4.3.1 Results of overtopping calculated for dike at Giao Thuy, Nam Đinh
province
With design parameters of Giao Thuy dike in Nam Định province (W = 0.5 m, S
= 0), mean overtopping discharge is 12.7 (l/s/m). However, this rate will reduce
to 0.1 (l/s/m) if the low crown-walls is positioned 0.5 m (S = 0.5 m) to landward
direction.
4.3.2 Proposal of dike cross-section
There are 8 different cross-sections in the proposed Sea Dike Design Guidelines
TCVN-2013. None of them describes a crown-walls with a promenade. Inspired
by the research results, the author proposes another cross-section of sea dike with
low crown-walls and promenade (Figure 4.8). However, the cross-section should
be applied after comprehensively analysing many relevant factors including
overtopping, traffic, rescues, in particular areas of interest.
23
4.4 Conclusion of chapter 4
A model was developed to estimate overtopping and can be used for studying
and designing sea dikes. The model can be upgraded easily to perform more
properly. Inspired by the research results, the author proposes another cross-
section of sea dike with low crow-wall and promenade (Figure 4.8)
CONCLUSIONS AND RECOMMENDATIONS
1. The obtained results
The thesis reviewed available works on overtopping in the world and Viet Nam
to show that dike failures are quite often caused by wave overtopping. Crown-
walls are a solution that is effective and popular to heighten the crest level and
reduce overtopping rate. Existing studies on this issue are far of complete. Based
on physical experiments, the author established empirical formulations to
determine the overall influence factor of low crown-walls for regular waves (2-
12) and the splash height as a function of wave parameters and wall geometric
configuration (Figure 2.11). Both physical and numerical models were carried
out to examined in detail the influence of the crown-walls from in light of the
wave-wall interaction and overtopping flow. The thesis reveals the merit of wall
promenades in improving splashing condition and consequently recommends the
Figure 4.8 Cross-section of a sea dike with low crown-walls and promenade