financial report 1999 holderbank the financial results posted in 1999 demonstrate that the group has further consolidated its position and created real added value
Bạn đang xem bản rút gọn của tài liệu. Xem và tải ngay bản đầy đủ của tài liệu tại đây (392.03 KB, 74 trang )
1999
HOLDERBANK
FINANCIAL REPORT
“Holderbank”. The financial results posted in 1999 demonstrate that the
Group has further consolidated its position and created real added value.
Management’s Discussion and
Analysis of Financial Condition and
Results of Operations (MD&A)
Consolidated Financial Statements
Holding Company Results
5-Year-Review
Stock Market Data
Stock Market Evolution
Statement of Income
Balance Sheet
Statement of Changes in Equity
Cash Flow Statement
Accounting Policies
Notes to the Financial Statements
Auditors’ Report
Products and Services
Company Data
Statement of Income
Balance Sheet
Notes to the Financial Statements
Appropriation of Net Earnings
Auditors’ Report
2
10
11
12
13
14
17
39
41
42
60
61
63
66
67
68
69
70
The financial report is also
published in German. The
English version is binding.
Please see the separate
annual report for the
business review by Group
region.
“Holderbank”
Financière Glaris Ltd.
CH-8750 Glaris
Phone: +41 55 640 34 94
Investor Relations:
Bernhard A. Fuchs
Phone: +41 55 222 86 60
Fax: +41 55 222 86 69
Corporate Communications:
Roland Walker
Phone: +41 55 222 87 10
Fax: +41 55 222 87 19
1
Management’s Discussion and Analysis of
Financial Condition and Results of Operations 1999
The following discussion and analysis of the Group’s fi-
nancial condition and results of operations should be read
in conjunction with the Group’s financial statements and
notes to the financial statements, which are presented on
pages 10 to 38 of this annual report.
Overview
“Holderbank’s” financial results in 1999 were favorable at
all levels despite rapidly changing market conditions. In
early 1999, the outlook remained subdued due to crises in
some Latin American and Asian countries. Facing this situ-
ation, the Group’s strategy of geographical diversification
proved to be sound. In fact, it was the strength of the Group
that led to further opportunities which arose as a conse-
quence of the crises in some emerging markets.
Group net sales increased by CHF 926 million or 8.2% to
CHF 12,194 million (1998: 11,268). The internal growth in
net sales, excluding the impact of changes in foreign cur-
rencies and the consolidation structure, amounted to
CHF 435 million or 3.9%. These results reflect the Group’s
positive development in rapidly changing global condi-
tions in the construction sector and led to continued
growth of operating profit in most regions. There were
improved economic conditions in most of the Group’s Eu-
ropean markets. In Latin America, the Mexican economy
compensated for the decline in the rest of the region. As
a result, operating profit in this Group region increased
further. The need to import cement to North America to
cover the demand created by strong business activity re-
duced margins in this Group region. Asia Pacific region,
which in certain countries showed some recovery, now
appears to be on the threshold of a positive development
in the years to come. Group region Africa Middle East
also contributed to operational growth.
An analysis of the geographical segments in which
“Holderbank” operates again highlights the progress in
further strengthening and more evenly balancing the
Group’s global portfolio. 39.8% (1998: 40.2%) of the
A global portfolio, firmly focused on cement, aggregates and concrete,
coupled with a strong management, is our recipe for sustained value
creation.
2
MD&A
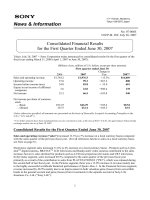
Group’s net sales were derived from Europe, the largest
region. Net sales in Latin America represented 23.0%
(1998: 23.5%) of the Group total, and the economic con-
ditions in North America increased this region’s share to
22.7% (1998: 22.2%). Group regions Africa Middle East
and Asia Pacific accounted for 7.9% (1998: 8.7%) and
6.6% (1998: 5.4%) of net sales respectively.
The Group continues to focus on core activities and has
thus disposed of certain operations, such as its concrete
chemicals business.
Goal was the further strengthening of core segments.
60.2% (1998: 59.3%) of net sales derived from the segment
cement/clinker and 21.2% (1998: 21.6%) from aggregates/
concrete. The percentage of net sales attributable to other
products/services was reduced to 18.6% (1998: 19.1%).
Further growth was the result of merging “Holderbank”
subsidiaryCorcemar S.A.(Argentina) withJuan Minetti S.A.
(Argentina) and the first consolidation of the latter.
Effect of Currencies and Inflation on Operations
The Group generates in excess of 92% of its net sales in
currencies other than CHF with transactions made in most
of the major currencies. Statements of income and cash
flow statements in foreign currencies are translated into
CHF at the average exchange rate of the year, whereas
balance sheets in foreign currencies are consolidated at
year-end exchange rates.
In 1999, the average valuation of the CHF weakened
slightly against all major currencies. As a consequence,
exchange rate movements had a minor impact on the con-
solidated statement of income and the results of the
Group. Due to exchange rate differences, net sales im-
proved by CHF 173 million (1998: -331) and operating
profit by CHF 31 million (1998: -35).
A major impact on the consolidated balance sheet result-
ed from the appreciation of the USD and some other cur-
rencies by more than 15% at year-end. These movements
led to a CHF 493 million (1998: -261) increase in share-
3
Net sales per Group region 1999
Europe 39.8%
Latin America 23.0%
North America 22.7%
Africa Middle East 7.9%
Asia Pacific 6.6%
holders’ equity. The impact of inflation and devaluation in
some high-inflation countries is minimized by functional
currency accounting – usually USD accounting. In 1999,
the devaluation of the Real in Brazil led to a temporary
margin decrease at “Holdercim” Brasil S.A., which was,
however, eliminated by year-end.
Change in Group Structure
Total financial investments amounted to CHF 1,261 million
(1998: 2,372) due to major changes in the scope of con-
solidation by merging Corcemar S.A. (Argentina) with
Juan Minetti S.A. (Argentina) and the first consolidation of
Ruhunu Cement Company Ltd. (Sri Lanka) and Tenggara
Cement Manufacturing Sdn Bhd (Malaysia).
Various initiatives were directed into strengthening the
Group’s participation in subsidiaries. Minority buyouts
were undertaken at HISALBA – Hornos Ibéricos Alba S.A.
(Spain), Société Suisse de Ciment Portland SA (Switzer-
land) and Portland-Cementwerk Thayngen AG (Switzer-
land). Group participation in Tvornica Cementa Koro-
ma˘cno (Croatia), Apasco S.A. de C.V. (Mexico), Puttalam
Cement Company Ltd. (Sri Lanka), Alsons Cement Corpo-
ration (Philippines), Milburn New Zealand Ltd. (New
Zealand) and others was further increased. In addition,
further minority stakes have been acquired at Egyptian
Cement Company S.A.E. (Egypt), Huaxin Cement Com-
pany Ltd. (China), Siam City Cement (Public) Company
Limited (Thailand), and controlling positions were taken
in Cimus SA (Romania) and Garadagh Cement J.S.C.
(Azerbaijan).
Divestments included operations falling outside the
Group’s core activities. Focusing on the development of
products and expertise in the field of cement additives,
Group activities in the area of concrete chemicals were
sold, including Holderchem Euco AG (Switzerland), C.I.A.
of Origny S.A. (France), Holderchem Euco S.A. (Spain),
Euclid Chemical Company (USA), Polchem S.A. (Chile)
and others. After commissioning the new plant on Min-
danao, Alsons Cement Corporation (Philippines) sold the
Iligan Cement Corporation (Kiwalan plant).
Although the change in Group structure increased net
sales by CHF 318 million (1998: -38), there was no mater-
ial effect on overall operating results. The divestments
mentioned above, together with amortization of goodwill
on the acquisitions, offset the impact of new investments
on the operating results.
Results of Operations
In 1999, operations achieved a further increase in ca-
pacity utilization to reach 83% despite the fact that
the newly commissioned plants in Vietnam, Australia
and the Philippines operated for a full year for the first
time.
The percentage of the Group’s net sales represented by
statement of income items is detailed in the following
table:
Per year-end in % 1999 1998
Net sales 100.0 100.0
Cost of products and services sold (59.9)(60.5)
Gross profit 40.139.5
Distribution and selling expenses (17.1)(16.5)
Administrative expenses (7.2)(7.4)
Other depreciation and amortization (1.8)(1.7)
Operating profit 14.013.9
Additional ordinary income 2.31.1
Financial expenses (4.9)(4.4)
Group net income before taxes 11.410.6
Income taxes (3.4)(3.2)
Group net income before minority interests 8.07.4
Net Sales
Net sales increased by 8.2% compared with the previous
year. Internal growth (volume and price) of CHF 435 mil-
lion (1998: 372), favorable impacts arising from exchange
rate movements of CHF 173 million (1998: -331) and
changes in Group structure amounting to CHF 318 million
(1998: -38) contributed towards this improvement. The
cement / clinker segment increased its net sales by 9.4%
and now generates 60.2% (1998: 59.3%) of total Group
turnover.
4
Operating Profit
The gross profit margin improved to 40.1% (1998: 39.5%)
primarily due to favorable market conditions – particularly
in Europe – and the closure of redundant capacity in previ-
ous years. Production costs per tonne of cement de-
creased further as a result of improved capacity utilization
and the related higher absorption of fixed costs. In addi-
tion, variable costs also reduced. Fuel costs benefited
primarily from the Group’s initiative to increase its use
of alternative fuels. A project to achieve excellence in
maintenance has been extended to all Group companies
and the first cost reductions were realized during the year
already.
Distribution and selling expenses amounted to 17.1%
(1998: 16.5%) of net sales. The opportunities presented
by a booming US cement market were supported by addi-
tional imports from various Group companies. The higher
cost level was primarily due to the cost of distributing
these imports in the US.
Administrative expenses amounted to 7.2% (1998: 7.4%) of
net sales. Various initiatives have been launched to stream-
line administration and reduce costs. The reduction in ad-
ministration expenses also reflects early results of efforts
to optimize the Group’s structure. Furthermore, an initiative
was launched to harmonize the management accounting
system Group-wide. This new management information
system and related activities will facilitate international
benchmarking, enable Group companies to share services,
and further strengthen the efficiency and effectiveness of
administration.
Other depreciation and amortization expenses increased
to 1.8% (1998: 1.7%) of net sales. This increase, which
contains amortization and depreciation on other operating
assets, was mainly due to the amortization of goodwill
arising from the Group’s recent investing activities.
Operating profit amounted to 14.0% (1998: 13.9%) of net
sales. The increase of CHF 139 million or 8.9% is primarily
driven by changes in the segment mix and partly offset by
increased distribution costs and amortization of goodwill.
In addition, positive effects of exchange rate movements
and changes in the consolidation structure further im-
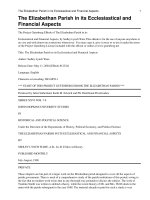
proved operating profit. The largest growth was achieved
in Group region Europe, which increased its operating
profit by 24.5% and now accounts for 31.6% (1998:
27.6%) of Group operating profit. Regions not showing an
increase in operating profit were North America (-2.1%),
largely due to the proportional increase in imported ce-
ment in this area, and Asia Pacific (-1.4%). Operating profit
in Latin America increased by 4.5%, despite the crises in
various countries noted earlier. Declines in Venezuela,
Ecuador, Colombia, Chile and Brazil were offset by strong
results from Apasco S.A. de C.V. (Mexico), the Group’s
Central American companies as well as the first consolida-
tion of Juan Minetti. EBITDA margin of “Holdercim” Brazil
S.A., which had previously suffered from the devaluation
of the Real, recovered by the end of the year. Group region
Latin America accounts for 34.2% (1998: 35.6%) of
Group operating profit and remains the highest regional
contributor within the Group.
Financial Expenses
Financial expenses amounted to 4.9% (1998: 4.4%) of net
sales. The increase resulted from higher levels of net
financial debt arising from investing activities over the
past few years as well as higher interest rates of 5.9%
(1998: 5.6%) on short and long-term financial liabilities.
Income Taxes
The expected income tax rate for the Group remains at
33%. In 1999, the effective tax rate was 29.8% (1998:
30.4%). Main reason for this lower than expected rate
are deferred taxation credits arising from the benefits of
restructuring certain operations in Africa Middle East.
Net Income
Net income after minority interests improved significantly
(+16.6%) especially due to capital gains on the sale
of fixed and financial non-core assets. Accordingly,
fully diluted earnings per share increased by 14.6%
to CHF 108.50.
5
Cash Flow
The high level of cash flow achieved in the previous year
was maintained in 1999. Cash flow from operating activi-
ties amounted to CHF 1,902 million (1998: 1,887). Cash
generated from operations increased by 8.7%. This in-
crease was able to cover higher interest and tax pay-
ments of CHF 217 million. Interest payments in turn
increased due to higher borrowing levels which were
needed to finance the non-consolidated positions in the
emerging markets. Tax payments were higher because
various Group companies had used up their tax-de-
ductible tax losses carried forward. Analysis of cash flow
from operating activities by region show improvements
in Group regions Europe and North America compensat-
ing the decreases in all other Group regions.
Balance Sheet
Consolidated shareholders’ equity grew by CHF 1,437 mil-
lion to CHF 6,430 million (1998: 4,993). Currency trans-
lation adjustments of CHF 493 million (1998: -261) and
a capital increase of CHF 375 million contributed, in
addition to net income, to the increase in shareholders’
equity. Interests of minority shareholders increased by
CHF 379 million to CHF 1,802 million (1998: 1,423) main-
ly due to currency translation adjustments offsetting the
buyouts of minority interests.
“Holderbank” strengthened the shareholders’ equity
through the creation of additional share capital. 25 of the
existing bearer shares entitled the holder to subscribe to
one new bearer share at CHF 50.– par at an issue price of
CHF 1,350.–. 25 existing registered shares entitled the
holder to subscribe to one new registered share at CHF
10.– par at an issue price of CHF 270.–. The subsequent
capital increase through the issue of 209,371 bearer and
404,000 registered shares generated CHF 375 million net
in new equity capital for the company.
In addition, the general assembly approved a condi-
tional share capital of 200,000 bearer shares to cover a
future issuing of convertible bonds to finance investments
in emerging markets. This transaction will permit to build-
6
up new positions in growth markets without diluting earn-
ings of present shares as conversions will be timed to
match profit expectations.
The Group’s net financial debt of CHF 7,631 million (1998:
7,069) increased by 8.0% primarily due to currency trans-
lation adjustments and cash requirements for expansion
through property, plant and equipment and financial in-
vestments.
From the proceeds of a called CHF 250 million convertible
bond issue, a new CHF 448 million zero coupon convert-
ible bond due 2014 was issued during the year. Gearing
(net financial debt divided by shareholders’ equity includ-
ing minority interests) benefited from the capital increase
and improved from 110.2% to 92.7%. As a result, the cash
position strengthened to support the Group’s acquisition
strategy.
In 1996, the Group established a specific provision of
CHF 560 million necessary to restructure operations. The
remaining provision of CHF 108 million covered the final
expenses of this restructuring exercise during 1999
mainly in Group region Europe.
Sustainable Development
In 1999, the Group became a member of the World Busi-
ness Council for Sustainable Development, further rein-
forcing its commitment to the environment. The use of
alternative fuels and raw materials as well as the produc-
tion of blended cements is being systematically pursued
in all regions to bring environmental, economic and so-
cial benefits to both the Group and the communities in
which it operates with a long-term perspective. Invest-
ments in environmental protection are clearly a priority in
acquired companies, especially in developing countries.
CHF 73 million (1998: 70) was invested to further improve
the environmental sustainability of production facilities.
Group companies provide for their environmental liabili-
ties based on legal or contractual obligations. A provision
7
Operating profit per Group region 1999
Latin America 34.2%
Europe 31.6%
North America 24.9%
Africa Middle East 5.3%
Asia Pacific 4.0%
8
of CHF 130 million (1998: 89) has been made for reculti-
vation and other environmental liabilities. Beyond this
provision the Group does not anticipate any material ad-
verse effect of environmental liabilities on future results
of its operations.
Derivative Financial Instruments
Derivative financial instruments are mainly used to fix
the interest rate of long-term variable-rate liabilities and
to hedge liabilities denominated in foreign currencies
against swings in currency exchange rates on specific
transactions.
Corporate Governance
During 1999, the first phase of the rollout of the Group’s
comprehensive business risk management program was
completed. This phase focused on an initial assessment of
risks for individual Group companies, including the iden-
tification of relevant risks. In 2000, the rollout of the busi-
ness risk management program will continue with the de-
velopment of risk management strategies in Group com-
panies and procedures related to their implementation
and continuous improvement.
Risks Associated with International Operations
The Group includes operations in the emerging markets of
Eastern Europe, Latin America, Africa and Asia. It is these
areas which have produced the highest levels of growth
in cement demand over the past several years and have
provided “Holderbank” with strength and flexibility in a
rapidly growing market.
In several Southeast Asian markets the economic down-
turn witnessed in previous years appears to have ended
and an initial recovery was in evidence during the year. The
decision to boost the Group’s presence in this region
proved strategically sound and Group companies are
well positioned to take advantage of expected economic
growth in the future. In some Latin American countries,
the effect of the Asian crisis and political uncertainty im-
pacted negatively on demand for construction. However,
general business conditions are expected to improve.
Accounting Policies
There were several changes in accounting policies adopted
during the year under review, including some which
were adopted prior to their effective date as encouraged
by the International Accounting Standards Committee. In-
ternational Accounting Standards introduced were IAS 16
(revised) on property, plant and equipment, IAS 19
(revised) on employee benefits, IAS 22 (revised) on busi-
ness combinations, IAS 36 on impairment of assets and
IAS 38 on intangible assets. In addition, the Group adopt-
ed the findings of the Standard Interpretation Committee
(SIC) 16 that treasury shares are to be offset against equi-
ty and not disclosed as an asset as was previously the case.
When the Group introduced IAS 12 (revised) on income
taxes in 1996 for certain Group companies operating in a
hyperinflationary economy and thus using a hard curren-
cy for reporting, the deferred tax provisions calculated
were not fully adequate. The accounting treatment has
now been corrected.
As a consequence of all these accounting changes, share-
holders’ equity was reduced by CHF 284 million as at
January 1, 1998.
IAS 37 on provisions, contingent liabilities and contingent
assets will be implemented in 2000. The introduction of
IAS 37 will not have a material effect on the financial re-
sults of the Group, as the balance sheet at December 31,
1999 is already largely compliant with the principles of
this standard.
Year 2000 Compliance
The measures taken for a smooth transition at year-end
were successful. The advent of year 2000 did not have a sig-
nificant impact on the Group. The important operating and
administrative systems were compliant and there was little
disruption arising from major suppliers and business part-
ners. Total spending on upgrades, replacements and con-
sulting prior to year 2000 amounted to approximately CHF
30 million. These costs were expensed as incurred and did
not have a major impact on the Group’s financial position.
9
Events after the Balance Sheet Date
After the balance sheet date, the Group invested in
Eastern Bulkcem Co. Ltd. (Nigeria) and Palestine Cement
Company (Palestine). Furthermore, the Group strength-
ened its export markets in the Caribbean Islands with the
acquisition of five import terminals. After successfully
concluding the joint venture negotiations with our partner
in Siam City Cement (Public) Company Limited (Thailand),
the company will be consolidated as of January 1, 2000
using the proportionate method.
Outlook
The Board of Directors and the Executive Committee are
optimistic about 2000 and expect a further increase in
Group operating profit, provided the CHF remains roughly
at its current level. The past year has demonstrated that
the Group is stronger and more flexible now than at any
previous stage. Thus, “Holderbank” is able to take appro-
priate and successful action in a rapidly changing en-
vironment and in an industry that is consolidating. In
Europe, the economic upturn is visible and continued
positive results are expected. In North America, cement
demand should remain favorable and new capacity in this
region will ensure that the high cost of importing cement,
necessary during 1999, can be gradually reduced. The
process to renew and extend production facilities in the
NAFTA area has started with the permission phase for
three flagship plants at very low investment cost. Latin
America will resume its growth path and make another
pleasing contribution to Group results this year. In Africa
Middle East indications are that demand will increase.
Signs of slow recovery are evident in Asian markets and
should accelerate during the coming year, with strategic
investments made in this area rendering significantly
improved results.
Consolidated statement of income “Holderbank” 1999 1998
Million CHF Notes
Net sales 5 12,194 11,268
Cost of products and services sold 6 (7,299) (6,821)
Gross profit 4,895 4,447
Distribution and selling expenses 7 (2,086) (1,862)
Administrative expenses (875) (831)
Other depreciation and amortization 8 (228) (187)
Operating profit 9 1,706 1,567
Additional ordinary income 10 288 128
Financial expenses 11 (601) (492)
Group net income before taxes 1,393 1,203
Income taxes 12 (415) (366)
Group net income before minority interests 978 837
Minority interests (183) (155)
Group net income after minority interests 16 795 682
CHF
Earnings per dividend-bearing bearer share 17 110.06 96.10
Fully diluted earnings per bearer share 17 108.50 94.64
10
CONSOLIDATED FINANCIAL STATEMENTS
Consolidated balance sheet “Holderbank” as at December 31 1999 1998
Million CHF Notes
Cash and cash equivalents 18 1,623 854
Accounts receivable 19 2,296 1,868
Inventories 20 1,419 1,238
Prepaid expenses and other current assets 163 180
Total current assets 5,501 4,140
Financial investments 21 1,997 1,701
Property, plant and equipment 22 11,747 10,111
Intangible and other assets 23 2,457 2,157
Total long-term assets 16,201 13,969
Total assets 21,702 18,109
Trade accounts payable 24 997 829
Current financing liabilities 25 1,982 1,598
Other current liabilities 26 1,188 910
Total short-term liabilities 4,167 3,337
Long-term financing liabilities 27 7,272 6,325
Long-term provisions 28 2,031 2,031
Total long-term liabilities 9,303 8,356
Total liabilities 13,470 11,693
Interests of minority shareholders 29 1,802 1,423
Authorized capital 377 363
Reserves 6,053 4,630
Total shareholders’ equity 6,430 4,993
Total liabilities and shareholders’ equity 21,702 18,109
11
Statement of changes in consolidated equity “Holderbank” 1999 1998
Million CHF Notes
Authorized capital as at January 1 363 362
Capital paid-in 14 1
Authorized capital as at December 31 377 363
Uncalled capital as at January 1 0 (5)
Capital paid-in 0 5
Uncalled capital as at December 31 0 0
Reserves
Capital surplus as at January 1 1,559 1,436
Capital paid-in 361 80
Shareholders’ equity – convertible bonds 25 43
Capital surplus as at December 31 1,945 1,559
Retained earnings as at January 1 3,373 3,335
Effects of changes in accounting policies 31 0 (284)
Retained earnings as at January 1 restated 3,373 3,051
Change in treasury shares (54) (151)
Profit distribution (142) (141)
Group net income after minority interests 795 682
Effect of increase in participations (55) (68)
Retained earnings as at December 31 3,917 3,373
Currency translation adjustments as at January 1 (302) (41)
Currency translation adjustments 493 (261)
Currency translation adjustments as at December 31 191 (302)
Total reserves 6,053 4,630
Total shareholders’ equity 6,430 4,993
12
Consolidated cash flow statement “Holderbank” 1999 1998
Million CHF Notes
Operating profit 1,706 1,567
Depreciation and amortization of operating assets 8 1,151 1,028
Other non-cash items 24 69
Change in net working capital (144) (145)
Cash generated from operations 2,737 2,519
Additional ordinary income 166 152
Interest paid (592) (503)
Income taxes paid (409) (281)
Cash flow from operating activities A 33 1,902 1,887
Investments in property, plant and equipment net (1,111) (967)
Financial investments net (773) (1,751)
Cash flow from investing activities B 34 (1,884) (2,718)
Dividends paid (226) (253)
Equity capital paid-in 376 91
In(De)crease in current financing liabilities 424 (711)
Proceeds from long-term financing liabilities 2,436 3,352
Repayment of long-term financing liabilities (2,267) (1,589)
Cash flow from financing activities C 35 743 890
Increase in cash and cash equivalents (A + B + C) 761 59
Cash and cash equivalents as at January 1 854 803
Increase in cash and cash equivalents 761 59
Effects of exchange rate movements 8 (8)
Cash and cash equivalents as at December 31 1,623 854
13
General
The consolidated financial statements of “Holderbank”
are based on uniform, generally accepted accounting
principles for all Group companies. Since 1991, “Holder-
bank’s” consolidated financial statements have been pre-
pared in accordance with the International Accounting
Standards (IAS) as published by the International Ac-
counting Standards Committee (IASC). The listing rules of
the Swiss Exchange SWX have also been complied with.
The promulgated standards IAS 16 (revised 1998), prop-
erty, plant and equipment; IAS 22 (revised 1998), busi-
ness combinations; IAS 36, impairment of assets and IAS
38, intangible assets, have been adopted prior to their
effective date as encouraged by the IASC.
Certain prior year balances have been restated according
to IAS 8 to comply with current year’s presentation.
Consolidation Method
The consolidated financial statements include the ac-
counts of Swiss and foreign companies and their sub-
sidiaries (Group companies) of which “Holderbank” Fi-
nancière Glaris Ltd. directly or indirectly controls more
than 50% of the voting rights, or where control is secured
by contractual agreements. The interests of other share-
holders in equity and net income are shown separately in
the consolidated balance sheet and statement of income.
In the case of joint ventures, where the partners partici-
pate at equal percentage rates, the proportionate consol-
idation method is applied. Financial investments in asso-
ciated companies which “Holderbank” does not control
(usually 20% to 50%) are included in the consolidated fi-
nancial statements according to the equity method. Par-
ticipations of less than 20% are valued at the acquisition
costs after adjustments on valuation. Group companies
acquired or sold during the year are included in or ex-
cluded from the consolidated financial statements effec-
tive from the date of acquisition or sale. Intercompany
transactions and balances are eliminated.
Translation of Foreign Currencies
Balance sheets prepared in foreign currencies are trans-
lated into CHF at year-end exchange rates. Certain Group
companies operating in high-inflation countries keep
their accounts in a functional currency, usually USD. The
statement of income and cash flow statement are trans-
lated at the average exchange rates for the year. Trans-
lation differences resulting from the above method are
directly credited or debited to shareholders’ equity. Ex-
change differences on monetary positions between the
local currency and the functional currency are included
in the annual statement of income. Exchange gains and
losses resulting from the translation of transactions are
shown in the statement of income.
Cash and Cash Equivalents
Cash comprises cash held at banks and on hand and
short or medium-term investments maturing within the
next 12 months. Marketable securities consist of securi-
ties traded on a stock exchange and held for the purpose
of being realized at short notice. Securities held over the
short term, including those of Group companies, are val-
ued at market rates. Valuation differences are included in
the statement of income. Securities held as long-term in-
vestments are included under financial investments and
are valued at the lower of acquisition cost or market price.
Inventories
Inventories are shown in the balance sheet at the lower of
historical acquisition or production costs or realizable mar-
ket value. Production costs comprise the acquisition costs
for raw materials and additives as well as variable and fixed
production costs including production overheads. Invento-
ries are valued in accordance with the FIFO method (First In,
First Out) or the average-cost method. Unbilled services
are valued according to the percentage of completion
method. As they are not material to the Group, interim prof-
its on inventories and unbilled services between Group
companies are not eliminated.
Property, Plant and Equipment
Property, plant and equipment are valued at the acquisi-
tion or construction cost less economic depreciation and
impairment loss. A straight-line method of depreciation is
applied throughout the estimated useful life. The following
aspects are taken into consideration when determining the
useful life of property, plant or equipment: the physical life
span, the company’s replacement policy, market or tech-
nological obsolescence, contractual and legal restrictions,
and the remaining useful life of existing property, plant and
equipment that have to be replaced as a single entity. The
estimated useful life for depreciation purposes is:
14
ACCOUNTING POLICIES
Repairs and renovations are normally charged to the
statement of income. Expenses are reported as assets on-
ly if the amounts involved are substantial and one or more
of the following conditions is satisfied: the original useful
life is prolonged, the original production capacity is in-
creased, the quality of the products is enhanced materi-
ally or production costs are reduced considerably. If a
construction project is to last one year or longer and the
corresponding financing costs are significant relative to
the total financing costs of the reporting company, then
the relevant financing costs are capitalized and depreci-
ated for the estimated useful life of the property, plant or
equipment. Government grants received for investments
are deducted from the relevant asset and reduce the eco-
nomic depreciation accordingly. Lease contracts which
are tantamount to the purchase of assets (finance leases)
are shown as assets and reported at the net present val-
ue under property, plant and equipment. Lease commit-
ments (excluding financing costs) are reported under cur-
rent or long-term financing liabilities. In the case of sale
and lease-back transactions, there is no change in the
book value of the relevant property, plant or equipment.
Gains from a sale are included in the liability, and the fi-
nancing costs are allocated over the term of the lease in
such a manner that the costs are reported over the rele-
vant periods.
Intangible Assets
Goodwill on participating interests acquired after January
1, 1992: Goodwill resulting from the acquisition of Group
or associated companies corresponds to the difference
between the purchase price and the fair value of the ac-
quired net assets at the time of acquisition. Goodwill is
amortized over the useful economic life, usually between
5 and 10 years, and is charged to the statement of in-
come. The maximum useful life may not exceed 20 years.
All intangible assets are stated net of any impairment
loss. If the purchase price is lower than the fair value of
the acquired net assets, the non-monetary assets are re-
duced proportionately, or the negative goodwill is recog-
nized as deferred income and systematically recorded as
income over the next few years as is the case with posi-
tive goodwill. Goodwill on participations acquired prior
to January 1, 1992: Goodwill on participations acquired
before January 1, 1992 has not been capitalized. Other
intangible assets: Patents, licenses and concessions are
valued at historical costs, corresponding either to the
purchase price or the development costs. Development
costs represent all expenses incurred until the moment of
official registration. Such costs are amortized over the
shorter of the legal or economic life. Capitalized expens-
es: Organization, formation and start-up costs are amor-
tized within 5 years.
Impairment of Assets
Property, plant and equipment and intangible assets are
reviewed for impairment whenever events or changes in
circumstances indicate that the carrying amount of an as-
set may not be recoverable. Whenever the carrying
amount of an asset exceeds its recoverable amount, an
impairment loss is recognized in the statement of income.
The recoverable amount is the higher of an asset’s net
selling price and value in use. The net selling price is the
amount obtainable from the sale of an asset in an arm’s
length transaction while value in use is the present value
of estimated future cash flows expected to arise from the
continuing use of an asset and from its disposal at the end
of its useful life. Recoverable amounts are estimated for
individual assets or, if it is not possible, for the cash-gen-
erating unit.
Reversal of impairment losses recognized in prior years is
recorded when there is an indication that the impairment
losses recognized for the asset no longer exist or have de-
creased. The reversal is recorded in income.
Revenue Recognition
Revenue is recognized when it is probable that the eco-
nomic benefits associated with the transaction will flow
to the enterprise and the amount of the revenue can be
measured reliably. Sales are recognized net of sales tax-
es and discounts when delivery has taken place and
15
Land No depreciation except on land with raw material reserves
Buildings and installations 20 to 40 years
Machines 10 to 30 years
Furniture, vehicles and tools 3 to 10 years
Construction in progress Written off only if impaired
transfer of risks and rewards has been completed. Rev-
enue from rendering services is recognized by reference
to the stage of completion when it can be measured reli-
ably. The stage of completion is determined based on sur-
veys of work performed.
Interest is recognized on a time proportion basis that re-
flects the effective yield on the asset. Dividends are rec-
ognized when the shareholder’s right to receive payment
is established.
Deferred Taxes
Provisions are made for deferred income tax liabilities
arising from differences between valuation methods used
in consolidation and those required by local tax rules as
applied to assets and liabilities. The provisions are ad-
justed continually for any changes in local tax legislation.
Provisions for deferred taxes are established in accor-
dance with the comprehensive liability method. Under the
comprehensive liability method provisions are estab-
lished for all taxable temporary differences. Tax loss carry-
forwards are only reported as deferred when it can be rea-
sonably assumed that future taxable income will be suffi-
cient to secure a tax advantage by offsetting losses.
Provisions are not made for deferred taxes on the undis-
tributed earnings of Group companies since these compa-
nies can decide themselves when dividends are to be dis-
tributed.
Employee Benefits – General
The Group adopted IAS 19 (revised 1998) in 1999 and ac-
counted for the transitional liability by adjusting the
retained earnings as at January 1, 1998.
Employee Benefits – Defined Benefit Plans
Some Group companies provide defined benefit pension
plans for employees. Professionally qualified indepen-
dent actuaries value the funds on a regular basis (1 to
3 years). The obligation and costs of pension benefits
are determined using a projected unit credit method. The
projected unit credit method considers each period of ser-
vice as giving rise to an additional unit of benefit entitle-
ment and measures each unit separately to build up the
final obligation. Past service costs are recognized on a
straight-line basis over the average period until the
amended benefits become vested. Gains or losses on the
curtailment or settlement of pension benefits are recog-
nized when the curtailment or settlement occurs. Actuar-
ial gains or losses are amortized based on the expected
average remaining working lives of the employees. The
pension obligation is measured at the present value of es-
timated future cash flows using a discount rate that is
similar to the interest rate on government bonds where
the currency and terms of the government bonds are con-
sistent with the currency and estimated terms of the de-
fined benefit obligation. The Group records an asset only
if there is control over the asset.
Employee Benefits – Defined Contribution Plans
In addition to the defined benefit plans described above,
some Group companies sponsor defined contribution
plans based on local practices and regulations. The Group’s
contributions relating to defined contribution plans are
charged to income in the year to which they relate.
Employee Benefits – Other Post Employment
Benefit Plans
Other post employee benefits include long-service leave
or sabbatical leave, medical aid, jubilee or other long-
service benefits, long-term disability benefits and, if they
are not payable wholly within twelve months after the
end of the period, profit sharing, bonuses and deferred
compensation.
Derivative Financial Instruments
Through the use of various kinds of derivative financial in-
struments, the Group hedges certain currency and inter-
est rate risks. Derivative financial instruments are used
primarily to hedge specific transactions and only involve
counterparties of sufficient credit quality. Interest rate
swaps and interest rate options are used by the Group
primarily to hedge debt positions. The interest spread is
used to offset interest expenditure during the period it
is incurred. Gains and losses from derivative financial
instruments are allocated to the period in which the
underlying transaction is recorded in the statement of
income.
Provision for Recultivation
The Group provides for the cost of recultivating a quarry
where a legal or contractual obligation exists. The provi-
sion is raised through operating costs over the life of the
quarry and is based on estimated net present value of the
costs necessary for recultivation.
16
1 Changes in the Scope of Consolidation
1
Acquisitions
Romania: Cimentul SA
Argentina: Juan Minetti S.A.
Sri Lanka: Ruhunu Cement Company Ltd.
Malaysia: Tenggara Cement Manufacturing Sdn Bhd
Singapore: Umar Pacific Pte Ltd.
Philippines: Alsons Cement Corporation (from proportionate to full consolidation)
Divestments
France: C.I.A. (concrete chemicals operations)
Spain: Holderchem Euco S.A.
Switzerland: Holderchem Euco AG
USA: Euclid Chemical Company
Chile: Polchem S.A.
Philippines: Iligan Cement Corporation
1
Major acquisitions / divestments.
2
Major foreign currencies.
2 Foreign Currencies
2
Statement of income Balance sheet
Average exchange rate in CHF Year-end exchange rate in CHF
1999 1998 ±% 1999 1998 ±%
1 EUR 1.60 1.62
–
1.2 1 EUR 1.60 1.61
–
0.6
100 BEF 3.96 3.99
–
0.8 100 BEF 3.97 3.99
–
0.5
100 FRF 24.38 24.55
–
0.
7
100 FRF 24.43 24.52
–
0.4
100 ESP 0.96 0.97
–
1.0 100 ESP 0.96 0.97
–
1.0
100 DEM 81.78 82.35
–
0.7 100 DEM 81.94 82.23
–
0.4
10,000 ITL 8.26 8.34
–
1.0 10,000 ITL 8.28 8.31
–
0.4
100 CZK 4.34 4.50
–
3.6 100 CZK 4.44 4.57
–
2.8
100 SKK 3.63 4.11
–
11.7 100 SKK 3.77 3.74 +0.8
100 HUF 0.63 0.67
–
6.0 100 HUF 0.63 0.64
–
1.6
1 USD 1.50 1.45 +3.4 1 USD 1.60 1.38 +15.9
1 CAD 1.01 0.98 +3.1 1 CAD 1.10 0.89 +23.6
100 MAD 15.32 15.08 +1.6 100 MAD 15.86 14.82 +7.0
1 ZAR 0.25 0.26
–
3.8 1 ZAR 0.26 0.24 +8.3
100 PHP 3.84 3.52 +9.1 100 PHP 3.96 3.52 +12.5
1 AUD 0.97 0.91 +6.6 1 AUD 1.04 0.84 +23.8
1 NZD 0.79 0.78 +1.3 1 NZD 0.83 0.73 +13.7
17
NOTES TO THE FINANCIAL STATEMENTS
3 Segment Information
Information by region Europe North America Latin America
1999 1998 1999 1998 1999 1998
Statement of income, balance sheet
and cash flow statement
Million CHF
Net sales 5,010 4,665 2,845 2,571 2,881 2,731
Operating profit 539 433 424 433 583 558
Net operating assets 4,846 5,253 2,087 1,655 4,859 3,728
Total financing liabilities 4,772 3,973 1,143 877 2,074 1,808
Cash flow from operating activities 767 735 417 375 522 563
Cash flow from investing activities (1,073) (1,452) (464) (166) (383) (649)
Depreciation and amortization
of operating assets 441 447 152 136 332 263
Impairment loss (charged to income) (19)00000
Capacity and sales
Million t
Production capacity cement 28.0 27.2 15.1 14.8 28.0 24.6
Sales of cement and clinker 22.8 21.6 18.4 16.8 19.3 18.3
Sales of aggregates 43.6 40.0 12.8 14.8 11.3 13.4
Million m
3
Sales of ready-mixed concrete 11.0 10.0 2.1 1.8 6.2 6.4
Personnel
Number of personnel 14,249 14,229 5,271 5,114 10,676 11,098
Information by product Cement / Clinker
1999 1998
Statement of income, balance sheet
and cash flow statement
Million CHF
Net sales 8,272 7,559
Operating profit 1,614 1,473
Net operating assets 11,561 9,694
Cash flow from investing activities (1,292) (1,543)
Personnel
Number of personnel 21,846 22,089
18
Africa Middle East Asia Pacific Corporate / Eliminations Total Group
1999 1998 1999 1998 1999 1998 1999 1998
986 1,004 823 625 (351) (328) 12,194 11,268
91 73 69 70 1,706 1,567
1,004 914 1,780 1,130 14,576 12,680
236 386 1,186 922 (157) (43) 9,254 7,923
120 155 104 106 (28) (47) 1,902 1,887
(25) (181) (18) (194) 79 (76) (1,884) (2,718)
101 107 125 75 1,151 1,028
0000 (19)0
9.5 9.5 9.4 7.1 90.0 83.2
7.5 7.7 6.6 4.0 74.6 68.4
13.3 12.5 3.9 3.2 84.9 83.9
1.6 1.7 0.9 0.9 21.8 20.8
4,999 5,967 4,132 4,112 39,327 40,520
Aggregates / Concrete Other products / Services Corporate / Eliminations Total Group
1999 1998 1999 1998 1999 1998 1999 1998
2,911 2,757 2,548 2,437 (1,537) (1,485) 12,194 11,268
103 92 (11) 2 1,706 1,567
2,174 2,081 841 905 14,576 12,680
(152) (222) (45) 16 (395) (969) (1,884) (2,718)
11,203 11,684 6,278 6,747 39,327 40,520
19
6 Cost of Products and Services Sold
Million CHF 1999 1998
Material expenses 2,469 2,131
Energy expenses 1,005 993
Personnel expenses 1,329 1,300
Depreciation 797 733
Other production expenses 1,770 1,684
Change in inventory (64) (13)
Capitalized expenses (7) (7)
Total 7,299 6,821
7 Distribution and Selling Expenses
Million CHF 1999 1998
Distribution expenses 1,651 1,456
Selling expenses 435 406
Total 2,086 1,862
Change in consolidated net sales
Million CHF 1999 1998
Volume and price 435 372
Change in structure 318 (38)
Exchange rate movements 173 (331)
Total 926 3
5 Net Sales
Million CHF 1999 1998
Sales net of taxes 12,940 11,912
Deductions from sales (746) (644)
Net sales 12,194 11,268
Of which to associates 127 107
4 Production Capacity
Cement production capacity increased by a total of 6.8
million t (1998: 4.3) to 90.0 million t (1998: 83.2). This
increase is mainly due to further additions in the scope
of consolidation and the commissioning of new capaci-
ties that accounted for 6.8 million t (1998: 5.1), whilst
divested and shutdown capacity amounted to 0.6 mil-
lion t (1998: 2.6). The remaining increase of 0.6 million t
(1998: 1.8) is the net result of technical improvements at
various plants.
20
9 Operating Profit
Operating profit increased by CHF 139 million (1998:
132) or 8.9% (1998: 9.2%). This increase resulted from
improved market conditions and benefits due to previous
years’ restructuring. The region of largest growth was
Europe, which increased its operating profit by 24.5%
(1998: 15.2%) accounting for 31.6% (1998: 27.6%) of
the Group total.
The increase in other ordinary income is primarily the re-
sult of income generated from disposals of operations
falling outside the framework of the Group’s core activi-
ties. Additionally, the Iligan Cement Corporation (Kiwalan
plant) of Alsons Cement Corporation (Philippines) was
sold as part of its restructuring.
10 Additional Ordinary Income (Expenses)
Million CHF 1999 1998
Dividends earned 26 38
Interest earned 141 133
Other ordinary income 171 53
Depreciation and amortization of non-operating assets (50) (96)
Total 288 128
21
8 Summary of Depreciation and Amortization
Million CHF 1999 1998
Depreciation of property, plant and equipment (PPE)
Production facilities 797 733
Distribution and sales facilities 71 62
Administrative facilities 55 46
Depreciation of property, plant and equipment (PPE) 923 841
Depreciation and amortization of other operating assets 228 187
Depreciation and amortization of operating assets 1,151 1,028
Additional depreciation – associates 37
Amortization of goodwill – associates 15 7
Ordinary depreciation of non-operating assets (PPE) 32 20
Unusual write-offs 062
Depreciation and amortization of non-operating assets 50 96
Total depreciation and amortization 1,201 1,124
Of which depreciation PPE 955 861
12 Income Taxes
Million CHF 1999 1998
Current taxation 449 374
Deferred taxation (34) (8)
Total 415 366
Analysis of income tax charge
Million CHF 1999 1998
Expected tax expense 464 433
Utilization / capitalization of tax loss carryforwards (41) (21)
Other (8) (46)
Effective income tax charge 415 366
Effective income tax rate in % 29.8 30.4
13 Personnel Expenses
Million CHF 1999 1998
Wages and salaries 1,473 1,427
Employee benefits 371 388
Other personnel expenses 153 149
Total 1,997 1,964
22
11 Financial Expenses
Million CHF 1999 1998
Financial expenses 647 532
Foreign exchange gains net (25) (13)
Financial expenses capitalized (21) (27)
Total 601 492
Of which to associates 11
Financial expenses capitalized comprise interest expen-
ditures on larger-scale projects during the year. In 1999,
such projects included construction of cement and grind-
ing plants at Holnam Inc. (USA) and Juan Minetti S.A. (Ar-
gentina). The average rate of interest for financial liabilities
on hand at December 31 increased to 5.9% (1998: 5.6%).
Of which transactions with associates
Million CHF 1999 1998
Dividends earned 16 29
Interest earned 69
Undistributed earnings 91
Other ordinary income 86
Amortization of investments in associates (18) (14)
Total 21 31
14 Number of Personnel at Year-End
A total of 39,327 (1998: 40,520) people were employed
by the Group at year-end. The decrease of 1,193 (1998:
259) employees was mainly due to restructuring and the
disposal of activities in Group regions Latin America and
Africa Middle East and was partly offset by various
acquisitions made during the year.
17 Earnings Per Share (EPS)
Earnings per share is calculated on the basis of Group net
income after minority interests and the weighted number
of dividend-bearing shares after deduction of treasury
shares. Based on a weighted number of 5,163,063
(1998: 5,076,778) bearer shares and 10,304,744 (1998:
10,100,000) registered shares, earnings per bearer
share amount to CHF 110.06 (1998: 96.10) and per reg-
istered share CHF 22.01 (1998: 19.22). The fully diluted
EPS factors take into account the potential dilution
effects should the conversion options on the zero coupon
convertible bonds (1999 to 2014) and the 1% convertible
bonds (1998 to 2004) be exercised. Fully diluted EPS
is based on a weighted average number of 5,437,844
(1998: 5,337,190) bearer shares – the two bonds can po-
tentially be converted into 274,781 (1998: 260,412)
bearer shares – and 10,304,744 (1998: 10,100,000) reg-
istered shares. Fully diluted EPS thus amounts to CHF
108.50 (1998: 94.64) per bearer and CHF 21.70 (1998:
18.93) per registered share.
16 Group Net Income After Minority Interests
The 16.6% increase was mainly due to stronger results in
Group regions Europe and Africa Middle East. Group net
income after minority interests came to CHF 795 million
(1998: 682), representing 81.3% (1998: 81.5%) of Group
net income before minority interests.
15 Research and Development
Research and development expenses were again con-
fined to the existing product range and to investigating
production processes and environmental protection.
Basic research costs of CHF 5 million (1998: 4) were
charged directly to the consolidated statement of in-
come. No significant costs were incurred for licenses ob-
tained from third parties, nor was any major revenue gen-
erated from licenses granted.
18 Cash and Cash Equivalents
Million CHF 1999 1998
Cash at banks and on hand 1,089 615
Marketable securities 512
Other marketable securities 529 227
Total 1,623 854
Of which pledged / restricted 20 23
Cash and cash equivalents include securities as well as
money market paper and bonds earmarked for sale.
23
20 Inventories
Million CHF 1999 1998
Raw materials and additives 207 190
Semi-finished and finished products 581 480
Fuels 134 120
Parts and supplies 480 434
Unbilled services 17 14
Total 1,419 1,238
Of which pledged / restricted 20
19 Accounts Receivable
Million CHF 1999 1998
Accounts receivable – trade 2,003 1,641
Accounts receivable – associates 83 56
Other receivables 435 334
Allowances for doubtful accounts (225) (163)
Total 2,296 1,868
Of which pledged / restricted 22 8
21 Financial Investments
Million CHF 1999 1998
Financial investments – associates 1,258 1,066
Financial investments – third parties 260 207
Long-term receivables – associates 168 221
Long-term receivables – third parties 311 207
Total 1,997 1,701
Of which pledged / restricted 111 1
The increase in financial investments in associated com-
panies reflects the acquisition of non-consolidated inter-
ests at Cimus SA (Romania) and Garadagh Cement J.S.C.
(Azerbaijan), Huaxin Cement Company Ltd. (China), Siam
City Cement (Public) Company Limited (Thailand), and
the increase in participation at Egyptian Cement Com-
pany S.A.E. (Egypt). The valuation of financial invest-
ments in associates is based on the equity accounted
carrying value that resulted in a CHF 9 million (1998: 1)
increase in investments in associates.
24