b2b customer satisfaction surveys a practical guide to make them work
Bạn đang xem bản rút gọn của tài liệu. Xem và tải ngay bản đầy đủ của tài liệu tại đây (1.36 MB, 31 trang )
customer satisfaction surveys
a practical guide to
making them work
customer satisfaction surveys
a practical guide to
making them work
customer satisfaction surveys
CHAPTER 1
WHY DO SO MANY SUCCESSFUL COMPANIES EMPLOY THEM?
TO AVOID PREVENTABLE LOSSES?
TO DRIVE CONTINUOUS IMPROVEMENT?
TO BUILD MARKET SHARE?
TO CREATE CHECKS AND BALANCES?
ALL OF THE ABOVE?
2
W
The good news is, seven of ten complaining customers will do business with you again if you resolve
the complaint in their favour.
The bad news is, for every customer complaint that you hear, there will be, on average, 27 others that
will never be brought to your attention. Stated another way, roughly 96% of customer complaints will
never be openly voiced.
To Avoid Preventable Losses
hy do so many successful companies employ customer
satisfaction survey programmes?
Among the reasons are:
The Forum Corporation of America analyzed the causes of customer
migration in 14 major manufacturing and service companies and found
that 15 percent migrated because of quality issues, and another 15 percent
changed supplier because of price issues. The remainder, 70 percent, moved
on because “they didn’t like the human side of doing business with the
prior provider of the product or service”.
Tom Peters, The Pursuit of Wow
And as if that’s not bad enough, they don’t “just” leave. Additional studies
have consistently determined that the typical dissatisfied customer will also
end up telling 8-10 people about their problem or experience.
There are three operating areas in which most customers will openly express displeasure if you
fail to perform to expectations - price, quality and on-time delivery. The problem is, there are
dozens, sometimes hundreds of additional touch-points in the average business to business
relationship in which customers tend to bottle up displeasure. Sales rep performance, tech
support, customer service in its many and varied forms, finance administration, all means and
manner of communication, placing orders, processing returns - it can be a long list.
3
W
hy do so many successful companies employ customer
satisfaction survey programmes?
Among the reasons are:
To Drive Continuous Improvement
An old truism says that it’s far easier for great service to overcome a second-rate product than it is
for a great product to overcome second-rate service. Within that realm is a simple reality that many
business operators fail to recognize:
Your customers know your company’s strengths and weaknesses, and
they usually know them better than you do.
They know what it’s like to buy your products and services, from placing an order to having
it delivered.
They know how well you solve problems.
They know how responsive you are to questions or special needs.
They know if you make it easy to conduct business with you, or if it’s a painful process that’s
riddled with red tape.
They know if your employees are competent and courteous.
They know if you keep promises or return phone calls.
They know if you value their business, and show it to them, or if they are just taken for
granted.
They know if your products or services represent value for the money, and they know why or
why not.
And if that’s not enough
Customers can be the best source of innovative new ideas. Throughout history, in all
sectors, it’s often customers who come up with new ideas for improving an old product
or launching a new one.
4
£
"Totally Satisfied" customers have a repurchase rate that is 3 to 10 times higher than that of
"Somewhat Satisfied" customers. This is documented by research at Xerox and in other in-
dustry studies.
“All or nothing: Customers must be 'Totally Satisfied“ Steve Lewis, Marketing News. Chicago: Mar 2, 1998. Vol. 32, Iss. 5; pg. 11.
“Its “Totally Satisfied” customers were six times more likely to repurchase Xerox products
over the next 18 months than its “satisfied” customers.
Why Satisfied Customers Defect. By: Jones, Thomas O.; Sasser Jr., W., Harvard Business Review, Nov/Dec95, Vol. 73 Issue 6,
p88, 14p
“The relationship between satisfaction and actual share-of-wallet in a business-to-business
environment is not only a positive relationship but the relationship is nonlinear, with the greatest
positive impact occurring at the upper extreme of satisfaction levels.”
Timothy L Keiningham, Tiffany Perkins-Munn, Heather Evans, Journal of Service Research : JSR. Thousand Oaks: Aug 2003. Vol.
6, Issue. 1; pg. 37
“By examining contract renewal rates (Johnson Controls) found a one point increase in the
overall satisfaction score was worth a $13 million increase in service contract renewals
annually.”
American Society For Quality, February 2003
“IBM Rochester determined that if customer satisfaction levels increased one percentage
point, an additional $257 million in additional revenue would be generated over five years. The
ratio of revenue growth between very satisfied and satisfied customers was 3:1.”
American Society For Quality, February 2003
To Build Market Share
The economics of customer satisfaction speak for themselves.
And, of course, the old adage that we’ve all heard and lived by for years. It costs six times more
to attract a new customer than it does to keep an old one.
W
hy do so many successful companies employ customer
satisfaction survey programmes?
Among the reasons are:
5
W
hy do so many successful companies employ customer
satisfaction survey programmes?
Among the reasons are:
To Create Checks and Balances
Various studies performed over the years, beginning with one conducted by Xerox in the early
90’s, have consistently shown that a Totally Satisfied customer is, on average, 3-10 times more
likely to buy from you again than a customer who is merely Somewhat Satisfied.
Later studies conducted by InfoQuest took those findings a step further with development of a
statistical model which determined that the financial relationship between customer satisfaction
and revenues is both measurable and predictable. It found that, over time -
Q A Totally Satisfied Customer contributes 2.6 times as much revenue
to a company as a Somewhat Satisfied Customer.
Q A Totally Satisfied Customer contributes 14 times as much revenue
as a Somewhat Dissatisfied Customer.
Q A Totally Dissatisfied Customer decreases revenue at a rate equal to
twice what a Totally Satisfied Customer contributes to a business.
That last finding is particularly noteworthy in that it highlights that you can have twice as many
satisfied customers as dissatisfied customers and still be losing ground.
What it all means in terms of revenue is simple. Maximizing business performance means
doing everything possible to:
1. Turn Dissatisfied customers into Somewhat Satisfied customers.
2. Turn Somewhat Satisfied customers into Totally Satisfied customers.
3. Avoid undoing anything with customers who are already Totally Satisfied.
And that’s where the checks and balances come into play.
Do key decision-makers in your company know which of your top accounts is
dissatisfied, and why?
6
Are priorities and initiatives aimed at improving customer satisfaction systemically
known, universally pursued and routinely measured?
Is everyone in the company, all departments at all levels, hearing and focusing on the
same things?
When your team looks at your business, do they see the same things your
customers see? Do they know what your customers see?
Does everyone understand who your top accounts are and what needs to be done to
keep them?
Fundamental questions, right? Yet in many companies, purely informal means are employed
to try to maintain a sense of customer needs. Using a combination of in-house metrics,
anecdotal field tales, passive data collection and an abundance of hindsight, they wage a
valiant attempt to keep their fingers on the pulse of customer sentiments, often collecting
information with one hand and fighting fires with the other.
Of course, bad news does not travel up the corporate hierarchy very well, and the vast majority
of customer complaints are never openly voiced, which means that informal means are rather
like estimating the depth of the ocean by looking at the surface. Add in the effects of
preconceived notions, wishful thinking, attitudinal biases and even the occasionally fragile
corporate ego and well, good luck.
So customer satisfaction surveys have been developed and adopted to fill the knowledge
void.
Which leads to the next challenge. Not all customer satisfaction surveys are created equal,
so how does one go about finding the one that will best meet your needs?
For that discussion, see brochure entitled Question 2 - How?
customer satisfaction surveys
a practical guide to
making them work
customer satisfaction surveys
CHAPTER 3
WHAT IS NEEDED TO MAKE THE INVESTMENT WORTHWHILE?
THE METRIC
QUESTION STRUCTURE
THE LIBRARY OF CATEGORIES & QUESTIONS
DATABASE COMPARISONS
OVERALL SATISFACTION
PERFORMANCE CATEGORIES
PROBLEM IDENTIFICATION
INDIVIDUAL CUSTOMER RESPONSE DETAIL
PRIORITISATION TOOLS
ANALYTICAL TOOLS
PUTTING IT ALL TO USE
CRITICAL DESIGN CRITERIA
2
n today’s competitive marketplace, the pressure on
companies to find out, in detail, what their customers
think of their products, their services and their people is relentless. Unfortunately, for every
customer complaint the typical company receives, there will be, on average, 27 others that are
never reported. The inevitable manifestation of that reality is something that every company
has seen – the long-standing customer who one day takes their business elsewhere, usually
without warning, often without explanation.
Early efforts to break that pattern first came into vogue during the 1980’s when customer
satisfaction surveys evolved from an occasionally used tool and instead became a fundamental
element of the conduct of business. The underlying theory, of course, was sound; if customers
can’t be counted on to voluntarily express their opinions and frustrations, the thinking went, let’s
go out and ask them what they think.
In the years that have passed, the conduct of
such surveys has spawned an entire industry,
yet despite explosive growth in their use, the
available means for gathering customer
opinions hasn’t changed much.
Paper, telephone and face-to-face surveys existed
in 1980, and are still in use 30 years later. Over
that same time period we also saw the rise and
fall of electronic surveys; first the short-lived survey
on disk, then the Internet or web survey. Today the
former is a relic while the latter clings to life.
Yet even if survey methodologies haven’t
evolved (well, there is one exception, but we’re
still coming to it), there can be no question
that customer viewpoints on surveys have. It
is an unavoidable reality, however, that not all
of those viewpoints have changed for the
better.
To many people, surveys have become an overused commodity - monotonous, repetitive,
intrusive and, with few exceptions, utterly uninspiring. Many people see them as a
waste of valuable time; the purpose of many of the questions unclear, the results seldom
disclosed, and at the end of the day, scant evidence that any of it is being used to drive
change. What’s the point? is a commonly held view. Why bother?
Thirty years later, many people now associate
telephone surveys with telemarketing, paper
surveys with junk mail, and Internet surveys
with Spam.
That, in turn, leads to the dilemma,
how can a company obtain vital commercial
knowledge in a manner that will enhance,
not hurt, the customer relationship?
There is an answer to that question, and it begins on the next page.
I
3
o understand if a survey methodology can or does
perform, one must understand what it needs to
accomplish in the first place.
The fundamental premise of customer relationship management is simple. If you can gain a clear
understanding of customer needs, perceptions and desires, and then provide for those needs, you
can keep customers longer and sell to them more often.
But how do you gain a candid and accurate view of your business? Of equal importance, how do you
make certain that you’ll actually be able to put the information you gather to productive use? After all,
the real value of any survey lies in its ability to generate a strategic return on investment, which is to
say that unless you can actually do something with the results, all you gain is a lot of paper.
To avoid that all too common outcome, an effective customer satisfaction survey has to deliver:
ON THE FRONT END
••
••
• A high response rate*, enabling you to get an accurate picture of the opinions of
your
top accounts.
* Response rates below 50% generally cannot be counted on to be accurate.
• Immunity to biases and influences that undermine the candour and accuracy of
responses.
• At least a perception of anonymity, enabling customers to feel free to tell you what’s
really on their mind.
ON THE BACK END
• Fully attributable customer responses, enabling you to pinpoint specific problems
in specific accounts.
• Actionable (vs. merely interesting) results, enabling the development and
implementation of effective action plans. If you can’t act on the results, you can’t
change anything.
• Prioritisation tools that clearly and accurately show you where to focus your
resources for maximum impact on improving customer satisfaction and loyalty.
• Deliverables that are built on clarity and simplicity, not arcane jargon and analytical
filler.
Without those fundamental building blocks, conducting surveys usually proves to be a waste of
valuable time and resources.
T
4
he Cassandra Phenomenon sits atop the list of biases and
influences that undermine the candoor and accuracy of a customer satisfaction
survey. It is defined as -
In a survey environment where the respondent believes their identity is or
may be known, a strong positive bias filters into responses.
The problem is simple. When customers believe that their identity is or may be known,
roughly 70% of the population will hesitate to openly voice a strongly negative opinion for fear
of the potential consequences. That hesitancy is driven by concern over possible reprisals,
the “hassle factor” of potentially being asked to explain or defend such comments, even
misgivings about getting a business partner into trouble (however deserving) and thus
detrimentally altering whatever relationship is currently in place.
It’s ironic when you think about it. In most business settings, success is based on the
development of personal relationships. Over time, people become acquainted, familiar with
their business to business contact people, perhaps even develop something of a friendship.
When they do, they tend to become more careful of hurting someone’s feelings or expressing
views that may get someone into trouble. In other words, personal relationships tend to
suppress the expression of dissatisfaction or unmet need.
The Cassandra Phenomenon does not
apply to everyone. Through long
observed behavioral patterns we see
that approximately thirty percent of the
general population suffers no
misgivings about clearly and openly
expressing their views – both positive
and negative. Those folks will look you
in the eye and tell you precisely what is
on their mind, regardless of how they
think you might react to it.
The problem is that the remaining
seventy percent of the population
harbours subconscious concerns
about the ramifications or consequences
of openly speaking their mind. For those people,
the only safe approach, assuming they can’t find a way to duck the survey in the first place, is
to “soft-sell” or “back-peddle” on complaints rather than openly voice them or have them
committed to paper, where the possible consequences cannot be measured or predicted.
And, of course, for both the interviewer and the company using the resulting data, there is no
possible way to know – before, during or after the survey – which portion of the population any
single customer belongs in.
The only possible way to mitigate these influences, and to promote the candid expression of
accurate opinions, is to provide survey participants with a vehicle that will provide them a comfort
level to openly express their views without fear of consequences.
How many of the available survey methodologies do you think provide for that need?
When customers believe their identity is known, 70% will not openly voice
negative comments for fear of producing unwanted consequences.
T
5
WHAT OPTIONS ARE AVAILABLE?
Telephone Surveys
Response Rate
Under 50% at best. Rapidly declines as number
of questions increase.
Accuracy
Little thought given after first few responses.
Extremely prone to interviewer induced influences
on responses.
Candour
Cassandra Phenomenon undermines honesty
of 70% of respondents.
Number of Questions
5 minutes, 10-12 questions, to maintain any sort of
response rate.
Perceived Value
Highly intrusive and almost universally disliked.
Associated with tele-marketing. Culturally
unacceptable in various countries.
Perceived Anonymity
None.
Telephone is an excellent vehicle for qualitative
data collection, gathering detailed input on a
very limited focus; a product’s market potential
or features, for example. Time limits apply, but
a skilled interviewer with a very narrow focus
can gather valuable information.
As to customer satisfaction, loss of candour
and practical limits on number of questions
make it poor vehicle for anything more than a
cursory overview. May be used for quick
transactional surveys, but can only scratch the
surface on a full business evaluation.
Response Rate
Similar to phone for mid-management, far less for
senior management.
Accuracy
Note-taking (recorders are frowned upon) is
undermined by need to interact and promote
discussion. Results heavily influenced by
memory and interpretation.
Candour
If anything, Cassandra Phenomenon is magnified.
Number of Questions
Clipboards and forms are frowned upon, so
interview must be conversational. Interviewer
tends to lose control of discussion.
Perceived Value
Tend to be lengthy and are highly intrusive on
busy executive schedules; participants feel they
are absorbing as much cost as interviewer.
Perceived Anonymity
None.
Face to Face Interviews
Send in the reps in and pose questions to the
customer face to face; let the reps massage,
interpret and then record responses; let the
sales manager filter the information; then spend
weeks trying to figure out how to turn the data
into a report, which inevitably turns out to be of
little use.
Between the intrusion factor for everyone
involved, the wildly expensive cost of travel, and
undermined candour and accuracy, this
approach may offer some minor PR value, but
has nearly zero worth as a research tool.
6
WHAT OPTIONS ARE AVAILABLE?
Internet Surveys
Response Rate
5% average. Response rates have been steadily
declining in recent years.
Accuracy
Low response rates produce same “far end of
spectrum” influences as paper.
Candour
Depends on format. Paper survey on a computer
screen suffers same influences as written survey.
Number of Questions
Shorter is better, but 30-50 or more questions feasible.
Completion status must be visible or respondents will
tire and cancel out.
Perceived Value
Associated with SPAM. Frequently blocked by filters,
recognized sender’s lists and firewalls.
Perceived Anonymity
Typically assumed to be traceable, undermining
honesty.
Response Rate
5-10% Average. The longer the survey, the lower the
response.
Accuracy
Low response rate is dominated by “far end of the
spectrum” responses - those who would be delighted
to endorse your company, and those who are giving
you one last chance to get it right.
Candour
Format is prone to patterned responses and compared
answers. People become more concerned about the
“appearance” of their answers than what their
answers are.
Number of Questions
1-2 pages is practical limit.
Perceived Value
Overused. Soulless. Associated with junk mail.
Perceived Anonymity
None due to common use of bar codes or other
arcane coding systems.
Paper Surveys
Paper is an inexpensive option for a company
with a very large customer base and little to no
revenue stratification between accounts. The
data may be flawed, but even a 5% response
rate can at least produce a statistically valid
result.
But, when accounts are stratified (the so-called
80/20 or Pareto Rule), a vastly higher response
rate is needed. Without it, you disproportionately
hear from those at the far ends of the opinion
spectrum. Your ability to focus on the accounts
that drive your company’s revenues is sacrificed.
Like paper, a web survey is an option for a
company with a very large customer base and
little to no revenue stratification between
accounts. Like paper, they are also quite
inexpensive to conduct.
Their primary obstacle is low response rate,
which undermines the ability to focus on your
top revenue generators. They are also nearly
impossible to conduct without email addresses
for all desired participants, which a surprising
number of companies do not possess.
7
WHAT OPTIONS ARE AVAILABLE?
WELL, THERE IS ONE MORE
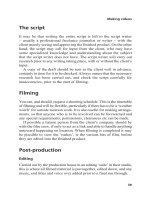
It’s called InfoQuest. Here’s how it works.
A survey of 36 to 60 questions and
statements is reduced to a deck of cards,
each about the size of business card, and
then placed inside the InfoQuest survey
“box”. After the survey is delivered by mail,
the participant reads each card, then simply
drops it into one of the five labeled
compartments to record their answers.
Each participant is also given the
opportunity to provide additional open-
ended written comments, which the
majority take advantage of. Postage paid
return mail material is included with each
survey. Average completion time is 10,
perhaps 15 minutes.
Customers you select to participate are
pre-validated through a multi-step process that
raises awareness of and interest in the process.
Following our recommendation to offer to share relevant highlights of the survey adds further interest, which
contributes to what is the highest average response rate on the planet - just a bit over 70%. And that’s a
global average. InfoQuest surveys have been delivered to customers in 77 countries and in 25 languages.
Is the survey “box” a gimmick? Sure it is. But there is sound structural thinking behind its design. Among the
reasons it works so well:
Average global response
rate since 1989 is just over 70%.
The InfoQuest Survey
Used in 77 countries and in 25 languages.
ACCEPTANCE - Unlike the drudgery of other survey formats, most customers view the
InfoQuest survey as fun - sort of like a game.
DELIVERY - Telephone surveys are easy to avoid. Paper surveys are frequently
screened by assistants as “junk mail”. Web survey emails fall prey to spam filters.
InfoQuest, on the other hand, with its unique appearance, and because the customer
always knows in advance that it’s coming, almost always makes it to the intended
recipient.
VISIBILITY - Conventional surveys, if they are not discarded upon receipt, frequently get
lost under mountains of paper. Emails about web surveys, if not responded to within 36
hours, probably won’t ever be. The InfoQuest approach is a visible attention getter that
is large enough to avoid getting lost, and viewed as too valuable to throw away.
EASE OF USE - InfoQuest is not intrusive - surveys are conducted at the convenience
and leisure of the customer. Because all return mail material is provided in the pack-
age, even sending it back for processing is an easy task.
TRACEABILITY - Each survey is uniquely coded, enabling us to track the identity of each
respondent. That, in turn, allows full insight into individual customer responses.
However, because most customers will be unaware of the coding system, they will
assume the survey is anonymous, thus giving them the freedom to tell you exactly what
is on their minds.
ACCURACY - InfoQuest produces highly accurate results. Score-keeping, patterned
responses, comparisons of answers and interviewer-based or -induced biases are
eliminated. Most importantly, because customers tend to assume their responses are
anonymous, thereby mitigating the effects of the Cassandra Phenomenon, their replies
are much more candid than other methods.
8
Response Rate
70% global average since 1989; the highest in the
world.
Accuracy
Unique design eliminates “far end of the spectrum”
effects, score-keeping, patterned responses,
comparisons of answers and interviewer-based or -
induced biases.
Candour
Perceived cloak of anonymity eliminates the effects
of the Cassandra Phenomenon, so customers feel
free to tell you exactly what is on their minds.
Number of Questions
36-60 without loss of response rate.
Perceived Value
Unique, innovative and different. Stands far above
the crowd in terms of creating a perception of value.
Perceived Anonymity
The vast majority of respondents assume the
survey is being conducted anonymously.
InfoQuest
If you have a stratified customer base wherein
a large portion of your sales and profits are
being generated by a small portion of your
customers, your survey needs to generate a
high response rate, it needs to gather candid
feedback, and the results need to be accurate.
This is the survey that can do all of that.
It is the only one that can.
For the sales department, InfoQuest identifies problems,
issues, unmet needs, and areas of subtle discontent that
are costing you sales. It identifies specific customers who
are approachable by your competitors, and tells you why. It
helps minimize customer defections by isolating and
correcting problems that can affect purchase decisions -
before they become critical.
For the marketing department, it is an effective way to
measure
brand equity and to obtain vital insights that will help you to
enhance the value of your products and services.
For the quality department, it is an effective solution to
meeting customer communication requirements under QS,
ISO and other quality related certification programs.
For the executive team, it is a way of determining how remote
areas of the company are performing. It also gives you the
tools needed to get all company personnel involved in
eliminating issues that affect the sales force's ability to
generate new and repeat business.
It’s been called the most cost effective, dynamic actionable
customer survey process on the planet. See the brochure entitled
Question 3 - What Do You Do With It? to understand why.
Because InfoQuest can touch on so many performance areas with so many people, there is a little something in
it for everyone in the company.
customer satisfaction surveys
a practical guide to
making them work
customer satisfaction surveys
CHAPTER 3
WHAT IS NEEDED TO MAKE THE INVESTMENT WORTHWHILE?
THE METRIC
QUESTION STRUCTURE
THE LIBRARY OF CATEGORIES & QUESTIONS
DATABASE COMPARISONS
OVERALL SATISFACTION
PERFORMANCE CATEGORIES
PROBLEM IDENTIFICATION
INDIVIDUAL CUSTOMER RESPONSE DETAIL
PRIORITISATION TOOLS
ANALYTICAL TOOLS
PUTTING IT ALL TO USE
CRITICAL DESIGN CRITERIA
2
o, you’re going to conduct a customer survey.
Having decided what is going to happen on the front end of a survey, far too many people fail to
stop and consider what they are going to do on the back end.
What are the results going to look like?
How actionable will they be?
How much time and effort, how many resources, are going to be required to address them?
What kind of return on investment can be expected? When will it be realized?
Will it be realized?
A few years back, a Fortune 100 company commissioned a
customer survey. The good news was, the dual volume reports,
which were delivered twice a year, offered the company
tremendous detail. The bad news was, the reports contained
so much material - the filler-laden page count was on par with
the New York City phone directory - that when all was said and
done, no one in the company even had time to read it all, let
alone to try to understand or do anything with it.
Another company was taken in by a vendor who was offering web-based surveys with a twist - in
this case, real-time reporting. Any authorized person in the company, the pitch went, could go
online at any time, pull survey results on all or some customers, then act on whatever results were
downloaded. A high-tech firefighting tool, it was called, giving the company the ability to identify
and address small problems before they became large problems.
Sounds neat, right?
Except the results being downloaded entailed raw data - none of it cleansed, processed, analysed
or subjected to anything resembling a prioritisation mechanism. Not surprisingly, people in different
parts of the company were soon running around taking disparate actions, whatever they felt was
appropriate on behalf of whomever they felt needed assistance. There was no consideration as
to whether their actions addressed a systemic or personal need, a high or low priority, or whether
there might be an unintended consequence somewhere else. It soon became what was later
characterized as a free-for-all, with many of the actions taken being little more than knee-jerk
reactions.
And finally, there are the legions of companies that have been seduced by such marketing
legerdemain as “The Ultimate Question”, where they embraced a simple survey and later found
themselves staring at bills for tens and even hundreds of thousands of dollars, pounds and euros
in order to find the answers to all of the questions that were never asked.
Three different companies. One facing incomprehensible results and zero return on investment.
A second facing random, disorganized results and a total inability to even estimate an ROI. A
third where only the tip of the iceberg was visible in terms of both results and cost.
Three circumstances which stand in testimony to the old adage, if you
can’t dazzle them with brilliance, baffle them with
Well, you know how it goes.
On the pages that follow is a discussion of what to look for
and what you will need in order to avoid the all-too-common
story of wasted time, wasted energy and wasted money.
S
3
THE METRIC
Think back to surveys you have seen over the years and consider the metric, or response options
that were employed. Remember seeing surveys with an alpha scale (Please rank the following from
A to F, with A being the best ) or a numeric scale (Please rank from 1-10, with 10 being )?
Both are commonly used but flawed approaches in which respondents tend to be subliminally driven,
their responses influenced by their experience with school grading systems.
Where an alpha scale is employed, a “C” is usually seen as
“average”, just like it was in school. On a numeric scale, the
yardstick for “average” will usually be based on a percentage;
80% being considered middle of the road, and anything below
60% considered a failing grade. Yet, companies will look at a
survey score derived from a 10-point numeric scale and
conclude that an average of 5 (or 50%) is “middle of the pack”.
In reality, they are probably looking at a measurement that
indicates abject failure.
Other scales may use various labelled derivatives - Good, Fair, Bad, Poor for example, or Meets
Expectations, Does Not Meet Expectations, and so on. The problem there, of course, is that none of
those carry a precise definition, so how can they be expected to produce a precise set of responses
or lead anyone to a precise set of conclusions?
Sometimes games are openly played. For instance, some companies like to try to help themselves
along by front-end loading the metric, perhaps something like - Excellent, Good, Fair and Poor. In
that example, there are two “positive responses” and only one “negative response”, an approach that
someone hopes will psychologically prod respondents toward a more positive answer.
A metric can also be impacted by cultural and language issues. We once saw a global survey where
the top box metric was “Very Satisfied”, followed by “Satisfied”. Looking at reports, the company was
troubled to see that responses from Japan lagged behind other areas in Asia. It was only after
considerable teeth-gnashing and hand-wringing that someone did some research and found out
there was a language problem. In Japan, when you had a modifier to something, you diminish its
value. That is to say, “Satisfied” is the best possible response; by adding “Very” to it, a lesser degree
of satisfaction was suggested. Apples and guacamole.
All of which illustrates the vital but often overlooked rules for designing response options.
The metric used in any survey must be clear, concise, unambiguous and non-subjective.
Regardless of region or language, you must be confident that all customers, regardless of
location or language, are seeing, understanding and responding to the exact same thing.
The InfoQuest metric, shown below, takes care of all of that.
Satisfaction Questions Drill-Down Statements
Totally Satisfied Fully Agree
Somewhat Satisfied Partially Agree
Insufficient Information to Evaluate Insufficient Information to Evaluate
Somewhat Dissatisfied Partially Disagree
Totally Dissatisfied Fully Disagree
The anchor point, Totally Satisfied, is a “clear line in the sand” metric. There is no subjectivity, no
interpretation, no ambiguity. It’s been proven to be multi-cultural, having been used successfully in
77 countries and 25 languages. It does not stack the deck in one direction or the other, nor does it
provide a “neutral” response along the lines of “no answer” or “don’t know”. Those kinds of options
give people a cop-out response, an easy way to duck difficult or uncomfortable questions.
Insufficient Information to Evaluate, on the other hand, recognizes a lack of experience response
without providing an open bail-out option.
4
QUESTION STRUCTURE
Next up is the question set. There are two critical elements that need to be provided here.
First, you need benchmark performance scores. Survey questions must work to clearly tell you
where you are so that you can assess precisely where you need to go.
Second, they need to provide direction on how to get there.
Our approach to meeting those objectives is to use the structure shown below. Pictured is what we
refer to as a “Category”, which as you can see is comprised of a satisfaction question that will give
you a benchmark score in (in this example) Sales Performance. Then, following the satisfaction
question are three statements which collectively serve to operate as drill-downs, helping you to
understand why customers are satisfied or dissatisfied with the accessibility of your sales reps.
The average survey gathers feedback on anywhere from 8 to 15 such categories, any or all of
which may entail a greater or lesser number of drill-downs.
THE LIBRARY OF CATEGORIES AND QUESTIONS
Originally introduced in 1995 and updated several times since, the InfoQuest Question Library
contains 63 different proven and tested Categories touching on all of the business to business
basics, including such things as Sales, Product Quality, Delivery, Customer Service, Tech Support,
Billing & Invoicing, Credits & Returns, Management Interactions, and so on.
SALES & MARKETING CATEGORIES
16. Literature
A. How satisfied are you with the literature we provide to describe our products and services?
B. Your literature is very easy to read and understand.
C. I get enough literature to keep me well informed about the products you offer.
D. Your literature is kept current and up to date.
17. Sales Performance
A. How satisfied are you with the overall performance of our sales representatives?
B. Your sales representatives thoroughly know and understand your products and services.
C. Your sales representatives understand my business needs.
D. Your sales representatives suggest solutions to improve our business.
18. Sales Performance
A. How satisfied are you with the overall performance of our sales representatives?
B. I have open and easy communication with people from your company.
C. Your sales representative treats our account as a valued partner in business.
D. I know who my sales representative is.
19. Sales Performance
A. How satisfied are you with the accessibility of our sales representatives?
B. My sales representative is never difficult to track down.
C. My sales representative responds to my inquiries promptly.
D. My sales representative is always on time for meetings.
23. Sales Performance
A. How satisfied are you with our sales representative's overall level of responsiveness?
B. My sales representative is always attentive and responsive to my needs.
C. I have met the sales account manager assigned to my company.
D. I get the feeling my sales representative views my business as a priority.
20. Sales Performance
A. How satisfied are you with the personal commitment of our sales representatives?
B. Your sales representatives are pleasant, accommodating and treat me with respect.
C. The frequency of meetings I have with your sales representatives is adequate to meet my needs.
D. Your sales representatives keep their appointments and are prepared to discuss my needs.
52. Marketing Support
A. How satisfied are you with our marketing support programs?
B. Your marketing support programs are a major component of our overall business strategy.
C. I have a clear understanding of the benefits we receive from your marketing support programs.
D. I have seen a marked improvement in company sponsored marketing support efforts.
The Library is made available to
all clients in an electronic format
that enables distribution and
review throughout your company.
Want to modify or customise
some or all of the Categories? No
problem.
Want to design new Categories,
perhaps touching on a proprietary
product or service? Again, no
problem. Or charge.
The development and use of the
Library was initially motivated by
the desire to reduce costs. In the
early days we spent time and
money with company after
company designing the content of
surveys that inevitably ended up
bearing a striking resemblance to
each other. There are market
research companies out there that
continue to take the same
resource draining approach.
Today, that time and money can
be put to far better uses. While
every survey is fully customised,
the vast majority of our clients find
everything they need right here.
5
DATABASE COMPARISONS
Want to know how your customer’s perceptions stack up to those of customers in other companies? A
major advantage of the Library of Categories and Questions is that we have been tracking and
cataloguing results to consistently worded questions for years. As a result, we can show you how your
results compare to those that have been accumulated in our international database going back to
1989.
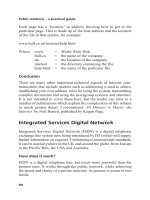
OVERALL SATISFACTION
Nearly every survey, regardless of methodology, will ask a question designed to measure respondent’s
Overall Satisfaction with the company or product being assessed. In our application, the specific
question used is -
On an overall basis, how satisfied are you with our company?
It’s a pretty straightforward question, and building it into a survey would seem to be a pretty
straightforward objective. But amazingly, both companies and market researchers often manage to
get that simple task wrong, sometimes in more ways than one.
Big Mistake Number 1 - Putting the question in the wrong place.
It is most advantageous to place the overall satisfaction question at the end of the survey, thus
assuring that before respondents consider the “big” question, they will have been exposed to all the
other questions on all the other topics that comprise the business or product relationship. In other
words, to make sure that the response provided is an informed and well-considered one.
With this feature, you can see the range of scores that other companies have generated, the median
score for all other companies, and the Percentile Rank of your current results versus those that have
been generated over the past two decades. In a growing number of instances we can even provide
industry specific comarisons.
Two thoughts on this feature. One, the InfoQuest Database Comparison is unique, it is automatic and
it doesn’t cost anything extra. Two, this information is a feature, not an objective. We provide it
because it is interesting, because it offers clients a sense of perspective, and because we can. That
said, at the end of the day - and notwithstanding the alternative opinions of many marketing folks and
most ISO compliance auditors - how one company compares to another, or even to hundreds of
others, has nothing to do with the satisfaction or loyalty or revenue generation of your customers.
If anyone tries to tell you otherwise, we’d advise you to take your money and run. We say that
because
Communication
High Company Score 83%
Low Company Score 0%
Median All Companies 38%
Percentile Rank 74%
Rank of current score in
database (High Score = 100%)
How satisfied are you with our company's overall communication efforts?
InfoQuest
Benchmarks
(Totally Satisfied)
0%
15%
30%
45%
60%
75%
90%
20%
August 2008
27%
August 2009
51%
August 2010
Very Good
Good
Average
Problem
Serious Problem
Exceptional
6
And yet, some of the same folks who think it’s a good idea to front-end load the metric also tend to
think it’s a good idea to front end load the survey itself. How? By putting the overall satisfaction
question at the front of the survey. The professed logic is that doing so will stimulate a more top-of-
mind, instinctive response.
Flying in the face of that thinking, test studies have shown that placing the Overall Satisfaction
question at the beginning of the survey will produce a score 20-25 percentage points higher than
placing it at the end. In other words, simple placement has a substantial impact on the outcome.
Does it matter? Well, consider this. .
Studies going back almost 20 years have consistently shown that over time, Totally Satisfied
customers spend over two and a half times what Somewhat Satisfied customers spend, and roughly
fourteen times what Somewhat Dissatisfied customers spend.
So yes, it matters. It matters a lot. The bottom line is, while placing the question at the top of the
survey will produce a result that will look better to the board or the shareholders, placing it at the end
will give you a much more reality based outcome.
Big Mistake Number 2 - Composite
Scores
There are companies that like to take
all of their “positive” responses, add
them together and proclaim that (using
the example to the right) “92% of our
customers are satisfied”.
While that provides a nice foundation
for a bit of public relations bluster, let
us say again what we have already
said.
Over time, Totally Satisfied
customers spend over two and a
half times what Somewhat Satisfied
customers spend, and roughly
fourteen times what Somewhat
Dissatisfied customers spend.
What that means, once again, is that
adding the scores together is utterly
delusional. Sure, it will produce a
result that will look better to the board
or the shareholders, but it will very
clearly NOT give you a view that is
based on anything which resembles
reality.
Big Mistake Number 3 - Omission
The only thing worse than misusing the
overall satisfaction question is to not
use it at all. There are firms out there
that try to hang their hats on other
Overall Satisfaction
High Company Score
90%
Low Company Score
2%
Median All Companies
42%
Percentile Rank
68%
Rank of current score in
database (High Score = 100%)
0%
15%
30%
45%
60%
75%
90%
38%
August 2008
45%
August 2009
53%
August 2010
Overall Satisfaction
is the single most important measure of customer satisfaction.
Totally Satisfied customers tend to be fiercely loyal and virtually immune to competitive influence,
while any customer who is less than Totally Satisfied is, to some degree, at risk of loss.
Range of Responses for the Current Period
The chart below illustrates the percentage of
respondents who are Totally Satisfied.
InfoQuest Benchmarks
(Totally Satisfied)
Info
Quest
Business Process Review
Number of Respondents for
Current Period
247
53%
39%
6%
2%
0%
15%
30%
45%
60%
75%
90%
Totally Satisfied Somewhat Satisfied Somewhat Dissatisfied Totally Dissatisfied
45%
41%
9%
5%
0%
15%
30%
45%
60%
75%
90%
Totally Satisfied Somewhat Satisfied Somewhat Dissatisfied Totally Dissatisfied
Range of Responses for the Prior Period
On an overall basis, how satisfied are you with our company?
Very
Good
Good
Average
Problem
Serious
Problem
Exceptional
“proprietary” (albeit arcane) mathematical formulas. Just remember that there is nothing to support
such tactics as sound, appropriate or - worst of all - accurate.
Totally Satisfied customers spend more money with you than your other customers. To grow your
revenues, you need to know who falls into the ranks of Totally Satisfied, who does not, and what
needs to be done to move everyone else up.
7
PERFORMANCE CATEGORIES
Overall Satisfaction is the single most important measure of customer satisfaction, but it is how a
company performs in critical customer touch points that drives the big picture view. Until you know
how you are doing in those performance areas, you can’t impact overall satisfaction, which means
you can’t impact your revenues.
Performance categories vary
greatly from one company to
another. While things like quality,
delivery and customer service are
constants for nearly any business,
the type of business will determine
what else needs to be measured.
Often the data will also need to be
segmented, to enable views by
region, customer type, product
line, and/or over time, to name a
few options.
Delivery
Response Detail
Number of Respondents
Management Interactions
Response Detail
Number of Respondents
Customer Service
Response Detail
How satisfied are you with the customer service we provide?
Related Questions
The customer service personnel are pleasant and knowledgeable.
Whenever a problem arises, I know who to contact.
If someone cannot initially answer my question, they find the answer and get back to me promptly.
46%
48%
6%
0%
0%
15%
30%
45%
60%
75%
90%
Fully Agree Partially Agree Partially Disagree Fully Disagree
31%
56%
6%
6%
0%
15%
30%
45%
60%
75%
90%
Fully Agree Partially Agree Partially Disagree Fully Disagree
79%
21%
0%
0%
0%
15%
30%
45%
60%
75%
90%
Fully Agree Partially Agree Partially Disagree Fully Disagree
90%
10%
0%
0%
0%
15%
30%
45%
60%
75%
90%
Fully Agree Partially Agree Partially Disagree Fully Disagree
55%
41%
4%
0%
0%
15%
30%
45%
60%
75%
90%
Fully Agree Partially Agree Partially Disagree Fully Disagree
71%
22%
6%
0%
0%
15%
30%
45%
60%
75%
90%
Fully Agree Partially Agree Partially Disagree Fully Disagree
76%
16%
8%
0%
0%
15%
30%
45%
60%
75%
90%
Totally
Satisfied
Somewhat
Satisfied
Somewhat
Dissatisfied
Totally
Dissatisfied
Info
Quest
Business Process Review
43%
24% 24%
8%
0%
15%
30%
45%
60%
75%
90%
Totally
Satisfied
Somewhat
Satisfied
Somewhat
Dissatisfied
Totally
Dissatisfied
Prior Period Scores
49
Number of Respondents
Current Period
48
Respondents
Respondents
49
Respondents
49
Delivery
Management Interactions
Customer Service
High Company Score 86%
Low Company Score 20%
Median All Companies 49%
Percentile Rank 95%
Rank of current score in
database (High Score = 100%)
Related Questions
The customer service personnel are pleasant and knowledgeable.
Whenever a problem arises, I know who to contact.
If someone cannot initially answer my question, they find the answer and get back to me promptly.
How satisfied are you with the customer service we provide?
InfoQuest
Benchmarks
(Totally Satisfied)
0%
15%
30%
45%
60%
75%
90%
94% 79% 90%
The chart to the right illustrates the
percentage of respondents who Fully Agree
with the statement below.
The chart to the right illustrates the
percentage of respondents who Fully Agree
with the statement below.
The chart to the right illustrates the
percentage of respondents who Fully Agree
with the statement below.
The chart above illustrates the percentage of
respondents who are Totally Satisfied.
0%
15%
30%
45%
60%
75%
90%
41%
August 2008
43%
August 2009
76%
August 2010
V
ery Good
Good
Average
Problem
Serious Problem
Exceptional
0%
15%
30%
45%
60%
75%
90%
44% 46% 55%
0%
15%
30%
45%
60%
75%
90%
29% 31% 71%
Info
Quest
Business Process Review
With rare exceptions, between 8 and 15 categories - or 32 to 60 questions - is adequate to assess
the performance of a company. Fewer questions will provide inadequate data to work with. One can
always think of more things to add to a survey, but it’s vital to remember that if you cross the line from
survey to endurance test, the response rate will begin to fall. But, if you control your appetite,
maintain the proper range of questions, and be certain you have the ability to segment the results,
you will have powerful tools with which to strengthen and grow your business.
8
By Account Revenue
Name Company
Account
Revenue
Overall Satisfaction
Ease of Doing Business
Billing and Invoicing
Pricing
Communication
Customer Impressions
Sales Performance
Delivery
Management Interactions
Ordering
Customer Service
Day, Neil Crest Lifts Ltd £3,200,000
Evans, Nathan Metro Lifts £2,300,000
Thomas, Doug Dewcroft Engineering £1,700,000
Graham, Peter Abbey Lifts Ltd £1,200,000
Austin, Fran Fujitec (UK) Ltd £1,115,000
Oxley, Frank Saxon Lifts Ltd £1,107,000
McNair, Brian Schindler Ltd £950,000
Bryant, Stephen Abbey Langham Lifts Ltd £815,000
Edwards, Frank Associated Lift Services Ltd £550,000
Amor, Ben Elite Elevators Ltd £540,000
James, Milton Bardeck Lift Engineers Ltd £510,000
Martin, Fenton D J Lifts Services £490,000
Davies, Paul UK Lifts Company (Watford) £485,000
Fry, Michael Leonard Lifts Ltd £260,000
Hunter, Alan Apex Lift & Escalator £174,000
Stephenson, Michael Premier Lifts Ltd (Rainham) £165,000
Young, Morris Premier Lifts Service £150,000
Kane, Timothy Accord Lift Services £132,000
Brown, Thomas Gregson & Bell £131,000
Gray, George Thyssen Lifts & Escalators Ltd £119,000
Lee, Lawton Cable Lifts £106,000
Nevill, Charles Axis Elevators Ltd £97,000
Quaterman, Arthur City Lifts Ltd £93,000
Cox, Oliver G M C £91,000
Riley, Keith Pickerings Lifts £89,000
Zwilling, Henry Design Services Ltd £89,000
Williams, Loretta Lift Services Brighton £86,500
Peters, Joan Express Evans Ltd £86,000
Ross, Richard Lutz Southern E&E £82,000
Booth, Andrew L E S (Lye) £81,000
Johnston, Janet County Lift Services £80,000
Hall, Samuel Rubax Lifts Ltd £74,000
Cole, Robert Kone Lifts Ltd £73,000
Ives, Samuel Monarch Lifts Ltd £65,000
Quinn, Kenneth Industrial Lift Services Ltd £63,500
Felstead, Doug Key Elevators Ltd £59,000
Legend
Totally Dissatisfied
Somewhat Dissatisfied
Info
Quest
Business Process Review
Knowing what is happening
with your customer base as
a whole is a vital first step,
but that’s all it is - a first
step. To be able to truly
generate meaningful and
enduring change, you need
to be able to understand -
and respond to - what is
happening at the individual
and account levels.
The sample charts on this
page show you a few
examples of what can be
done to provide a more
detailed view of the aggre-
gate response data. The
“Dot Charts” are each
designed to help point you in
the direction of what are
often referred to as “ticking
time bombs”, enabling you
to fine tune and personalize
your customer satisfaction
initiatives.
PROBLEM IDENTIFICATION
Additional sorts by region, sales
rep, service organisation, factory
or anything else you may need
are available for the asking.
By Potential Revenue
Company Revenue
Pene-
tration
Account
Potential
Overall Satisfaction
Ease of Doing Business
Billing and Invoicing
Pricing
Communication
Customer Impressions
Sales Performance
Delivery
Management Interactions
Ordering
Customer Service
Dewcroft Engineering £1,700,000 30% £5,666,667
Crest Lifts Ltd £3,200,000 80% £4,000,000
Associated Lift Services Ltd £550,000 20% £2,750,000
Abbey Langham Lifts Ltd £815,000 30% £2,716,667
Metro Lifts £2,300,000 100% £2,300,000
Bardeck Lift Engineers Ltd £510,000 25% £2,040,000
Apex Lift & Escalator £174,000 10% £1,740,000
Schindler Ltd £950,000 60% £1,583,333
Abbey Lifts Ltd £1,200,000 80% £1,500,000
Fujitec (UK) Ltd £1,115,000 80% £1,393,750
Saxon Lifts Ltd £1,107,000 80% £1,383,750
UK Lifts Company (Watford) £485,000 40% £1,212,500
Elite Elevators Ltd £540,000 66% £818,182
Industrial Lift Services Ltd £63,500 10% £635,000
Leonard Lifts Ltd £260,000 50% £520,000
Premier Lifts Ltd (Rainham) £165,000 33% £500,000
D J Lifts Services £490,000 100% £490,000
Independent Lift Services Ltd £52,000 15% £346,667
Lift Services Brighton £86,500 25% £346,000
Accord Lift Services £132,000 40% £330,000
Premier Lifts Service £150,000 50% £300,000
Thyssen Lifts & Escalators Ltd £119,000 50% £238,000
Cable Lifts £106,000 50% £212,000
Gregson & Bell £131,000 80% £163,750
G M C £91,000 80% £113,750
Design Services Ltd £89,000 80% £111,250
Axis Elevators Ltd £97,000 90% £107,778
Yorkshire Lift Services Ltd £53,000 50% £106,000
City Lifts Ltd £93,000 100% £93,000
Kone Lifts Ltd £73,000 80% £91,250
Pickerings Lifts £89,000 100% £89,000
Express Evans Ltd £86,000 100% £86,000
Lutz Southern E&E £82,000 100% £82,000
Legend
Totally Dissatisfied
Somewhat Dissatisfied
Info
Quest
Business Process Review
By Customer
Name Company
Overall Satisfaction
Ease of Doing Business
Billing and Invoicing
Pricing
Communication
Customer Impressions
Sales Performance
Delivery
Management Interactions
Ordering
Customer Service
Amor, Ben Elite Elevators Ltd
Austin, Fran Fujitec (UK) Ltd
Booth, Andrew L E S (Lye)
Brown, Thomas Gregson & Bell
Bryant, Stephen Abbey Langham Lifts Ltd
Cole, Robert Kone Lifts Ltd
Cox, Oliver G M C
Davidson, Liam Britton Price Ltd
Davies, Paul UK Lifts Company (Watford)
Day, Neil Crest Lifts Ltd
Edwards, Frank Associated Lift Services Ltd
Evans, Nathan Metro Lifts
Felstead, Doug Key Elevators Ltd
Fox, Graham Morris Vermaport
Fry, Michael Leonard Lifts Ltd
Graham, Peter Abbey Lifts Ltd
Gray, George Thyssen Lifts & Escalators Ltd
Hall, Samuel Rubax Lifts Ltd
Hunter, Alan Apex Lift & Escalator
Ives, Samuel Monarch Lifts Ltd
James, Milton Bardeck Lift Engineers Ltd
Johnston, Janet County Lift Services
Kane, Timothy Accord Lift Services
King, Jason Temple Lifts Ltd
Lawson, Maurice Amalgamated Lifts Ltd
Lee, Lawton Cable Lifts
Martin, Fenton D J Lifts Services
McNair, Brian Schindler Ltd
Nevill, Charles Axis Elevators Ltd
Norton, Bruce Independent Lift Services Ltd
Osbourne, Philip Hammond & Champness Ltd
Oxley, Frank Saxon Lifts Ltd
Patterson, Steve Liftwise Ltd
Peters, Joan Express Evans Ltd
Quaterman, Arthur City Lifts Ltd
Quinn, Kenneth Industrial Lift Services Ltd
Legend
Totally Dissatisfied
Somewhat Dissatisfied
Info
Quest
Business Process Review
9
INDIVIDUAL CUSTOMER RESPONSE DETAIL
SIF Written Comments
Kelly, Eric
Production Manager
J.M. Morley
12 Sunti Road
Suite 11
Birmingham, AL 35242
Telephone: (205) 887-7543
T
o
t
a
l
l
y
S
a
t
i
s
f
i
e
d
/
F
u
l
l
y
A
g
r
e
e
S
o
m
e
w
h
a
t
S
a
t
i
s
f
i
e
d
/
P
a
r
t
i
a
l
l
y
A
g
r
e
e
N
o
R
e
s
p
o
n
s
e
S
o
m
e
w
h
a
t
D
i
s
s
a
t
i
s
f
i
e
d
/
P
a
r
t
i
a
l
l
y
D
i
s
a
g
r
e
e
T
o
t
a
l
l
y
D
i
s
s
a
t
i
s
f
i
e
d
/
F
u
l
l
y
D
i
s
a
g
r
e
e
[Overall] On an overall basis, how satisfied are you with our company?
X
X
X
X
X
X
X
X
X
X
X
X
X
X
X
X
X
X
X
X
X
X
X
X
X
X
X
X
X
X
X
X
X
X
X
X
X
X
X
X
[Customer Impressions] How satisfied are you with our company as a business partner?
[Sales Performance] How satisfied are you with the overall performance of our sales representatives?
[Overall] On an overall basis, how satisfied are you with our company?
[Billing and Invoicing] How satisfied are you with our billing and invoicing?
[Pricing] How satisfied are you with the procedures we use for providing quotes?
[Communication] How satisfied are you with our company's overall communication efforts?
When providing quotes, your availability of information is readily accessible and up to the minute.
When providing quotes, the prices you quote or the availability of product meets my needs.
[Management Interactions] How satisfied are you with your interactions with our management?
Your sales representatives thoroughly know and understand your products and services.
Your sales representatives understand my business needs.
Your sales representatives suggest solutions to improve our business.
Your deliveries arrive when promised.
Your deliveries are complete and accurate.
All deliveries are clearly marked to identify the contents.
[Ordering] How satisfied are you with the effectiveness with which we process your orders?
[Customer Service] How satisfied are you with the customer service we provide?
The management people I have contacted in your company are customer focused.
I know that your management is available to address my problems and concerns.
I can always contact someone in your company who can make decisions that affect me.
I never experience problems when I place an order by telephone.
Ordering from your company is an easy process.
Your company is flexible and accommodating when we need to make changes to an order.
Billing issues are fairly and satisfactorily resolved.
When there is an issue with an invoice, your personnel are accommodating and helpful.
Price quotes are provided quickly and accurately.
[Delivery] How satisfied are you with the delivery of our products or services?
Your personnel routinely stay in touch with me to keep me apprised of issues that may affect me.
Everyone in your company seems committed to helping meet my business needs.
I do not need to rely solely on my sales representative to meet my informational needs.
I intend to continue my business relationship with your company.
When I think of quality products and services, I think of your company first.
Your company listens and responds to me when I have a problem.
How satisfied are you with the ease of doing business with our company?
I would purchase products or services from your company again.
I would recommend your company to an associate.
Invoices from your company are complete and accurate.
The customer service personnel are pleasant and knowledgeable.
Whenever a problem arises, I know who to contact.
If someone cannot initially answer my question, they find the answer and get back to me promptly.
Acme Widget Corporation
Sales Rep: A. Boisvert
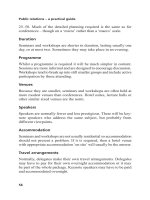
While the Problem Identification Dot Charts point you in the direction of issues within specific accounts,
the forms shown on this page take insight to the next level by providing the full array of response detail
for each individual customer. One Individual Response Sheet (below, left) is produced for every survey
respondent. On average, 60% of those persons will provide additional, open-ended written comments
(below right). The array of insights can be alternately enlightening, amusing and sometimes downright
frightening.
When it comes time for you to launch a survey, whatever kind it may be, make sure this level of
detail is available. There are researchers out there who fail to provide this sort of basic
information, sometimes due to self-imposed limitations, but more often than not due to their own
inability to consistently provide it, or to be able to show you what to do with it. Those companies
will usually provide a lot of rationalistic tofu to try to convince you that it’s not needed. If they do,
our advice would be to hang onto your wallets and run, don’t walk, as far as you can, as fast as you
can.
Bear in mind that with the right survey, producing a high response rate, the only opinions you’ll
have to be tabulated are those of your top accounts. Take a look at the samples above and
consider how you’d feel if those were the responses of one of your top customers.
Then consider how you’d feel if you were denied access to those opinions.
Any questions?
10
PRIORITISATION TOOLS
Fact 1 - The average company will spend anywhere from 2 to 10 times the cost of the survey, and
sometimes even more, addressing issues and needs identified by responding customers.
Fact 2 - The average survey will reveal far more opportunities for improvement than the average
company is going to have the time or resources to even attempt to deal with. In determining what is
going to be established as a priority, there will need to be a selection process
Fact 3 - The selection process better be right.
Fact 4 - So we developed the
ProfitMax Strategic Profile.
ProfitMax uses Neural Networks, a branch of the artificial intelligence technologies, to identify and
quantity those performance areas which, if improved, will produce the greatest positive impact on
overall satisfaction. It tells you where to place your time, energy and resources to gain the best
possible return on invested resources. Where and how to get the biggest bang for the buck (or
pound, euro, peso or yen).
We can’t explain how it all works in this short little space, but we can tell you that it represents the
most advanced analytic
survey tool on the planet,
and we can tell you that
no one else we know of
offers it.
It’s cutting edge.
It’s one of a kind.
And, it has saved hundreds
of companies the initial
and ongoing costs of false
starts, misdirected priorities
and wrong guesses.
Impact Analysis
Payoff Profile