biofouling and its control in seawater cooled power plant cooling water system
Bạn đang xem bản rút gọn của tài liệu. Xem và tải ngay bản đầy đủ của tài liệu tại đây (3.13 MB, 53 trang )
Biofouling and its control in seawater cooled power plant cooling water system - a review 191
Biofouling and its control in seawater cooled power plant cooling water
system - a review
K.K. Satpathy, A.K. Mohanty, Gouri Sahu, S. Biswas and M. Slvanayagam
x
Biofouling and its control in
seawater cooled power plant
cooling water system - a review
K.K. Satpathy
1*
, A.K. Mohanty
1
, Gouri Sahu
1
,
S. Biswas
2
, M.V.R. Prasad
1
and M. Slvanayagam
2
1
Environmental and Industrial Safety Section, Indira Gandhi Centre for Atomic Research,
Kalpakkam, Tamil Nadu, India, 603102
2
Loyola Institute of Frontier Energy, Loyola College, Chennai, India
1. Introduction
Biofouling may be defined as the attachment and subsequent growth of a community of
usually visible plants and animals on manmade structures exposed to seawater
environment. Man has long been aware of this problem. In the fourth century B.C., Aristotle
is reported to have stated that small “fish” (barnacles) were able to slow down ships.
Fouling of ship hulls, navigational buoys, underwater equipment, seawater piping systems,
industrial or municipal intakes, beach well structures, oil rigs and allied structures has often
been reported. In the past few decades, the list of affected structures has expanded. Now,
reports are common regarding the biofouling that affects Ocean Thermal Energy Conversion
(OTEC) plants, offshore platforms, moored oceanographic instruments and nuclear and
other submarines. The impact of biofouling on sea front structures is staggering. Ships show
a 10% higher fuel consumption caused by increased drag and frictional resistance resulting
from hull and propeller fouling. Water lines lose their carrying capacity and speed of flow
owing to biofouling growth along pipe systems. The heat exchanger performance declines
due to attachment of biofoulants. Many marine organisms themselves face the constant
problem of being colonized and overgrown by fouling organisms. Immobile plants and
animals are generally exposed to biofouling and consequent loss of species and community
assemblages. Biofouling also promotes corrosion of materials. The money and material
needed for fouling protection measures are indeed exorbitant. It is estimated that the marine
industry incurs an expenditure of 10 billion sterling pounds a year to combat the situations
arising from biofouling worldwide (Satpathy, 1990). A lot of research effort has been
devoted to understand the fundamental ecology and biology of fouling environments,
organisms and communities in diverse settings.
The huge requirement of cooling water as well as accrescent demand on the freshwater has
led to the natural choice for locating power plants in the coastal sites where water is
available in copious amount at relatively cheap rate. For example, a 500 MW (e) nuclear
power plant uses about 30 m
3
sec
-1
of cooling water for extracting heat from the condenser
11
www.intechopen.com
Nuclear Power192
and other auxiliary heat exchanger systems for efficient operation of the plant. However,
use of seawater, brings associated problems such as colonization of biota which stands in
the way of smooth operation of the plant. Unfortunately, every cooling system with its
concrete walls forms a suitable substrate for marine growth. Some of the conditions which
favour the development of a fouling community in power plants are (a) continuous flow of
seawater rich in oxygen & food, (b) reduction in silt deposition, (c) lack of competition from
other communities and (d) reduction in the density of predators. Broadly speaking the
effects of marine growth on the power plant are (a) losses in plant efficiency, (b) mechanical
damage and (c) problem for the integrity of the cooling circuits needed for safety of nuclear
plants (Nair, 1987). Hence biofouling control aims to achieve efficient operation of the
power station at all times. It is therefore necessary for power plant designers to make a
rational choice regarding the most suitable control method to combat biofouling problem in
a practical, yet economically feasible & environmentally acceptable manner.
1.1 Economic impacts of biofouling
Economics involved in the biofouling problem of power plant as quoted by various authors
are cited here to emphasize the importance of biofouling control.
A 5mm Hg condenser back pressure improvement can equal to 0.5% improvement in the turbine
heat rate which approximately equal to 3 additional megawatts of generating capacity (Drake,
1977). Similar increase in condenser back pressure due to fouling in a 250 MW (e) plant can cost
the utility about $ 2.5 lakhs annually (Chow et al., 1987). One report estimates that fouling by
Asiatic clam alone costs the nation over a billion $ annually (Strauss, 1989). Costs for one day
unplanned outage can run into 0.3% of their earning per year, taking 300 days operation. Hence
eliminating one unplanned outage can more than pay for measures taken to maintain cooling
water tube cleanliness. Waterside resistance accounts for 72% of the total resistance to heat
transfer of the tube. Of this, the film which forms in a condenser tube accounts for a significant
39% and the rest 33% is due to scaling (Drake, 1977).
The experience of Marchwood (Southampton) showed that between 1957 and 1964, 4000
condenser tubes failed due to mussel fouling leading to leakage. Apart from the loss of
generation, these leaks contaminated the feed water system and accelerated the boiler water side
corrosion, resulting in boiler tube failures (Coughlan and Whitehouse, 1977). The inlet culverts
had to be drained for manual cleaning at least once in a year. Average quantity of mussel
removed was 40 tons but could be as high as 130 tons. Similar stations at Pools (Dorset) had a
maximum 300 tons (Coughlan and Whitehouse, 1977). About 300 tons of mussel shells were
removed each time by shock chlorination from MAPS intake tunnel on two occasions. Cost (at
1975 prices) of dropping a 500 MW (e) oil-fired station at Fawley (Southampton) was 15000
pounds per day due to fouling, excluding repairs. The cost of chlorine for this unit for the whole
year of 1975 was 7500 pound. The consequence of inadequate chlorination at Inland station
eventually led to the unit being taken off load for manual cleaning of condenser (Coughlan and
Whitehouse, 1977). It has been observed by the CEGB investigating team on biofouling control
practices that stress corrosion cracking of admirality brass condenser tubes was attributed to
ammonia produced by bacteria (Rippon, 1979).
The cleaning out of biofouling from the cooling water intake tunnels and culverts is
generally very expensive; for instance 4000 man hours were used to clean the culverts and to
remove 360 m
3
of mussels at Dunkerque in 1971 (Whitehouse et al., 1985). Within a very
short time at Carmarthen Bay Power Station, which was commissioned in July 1953, seed
mussels and various species of marine life were noticed around the main intake to the
cooling water system. By april 1954 the fouling was so severe that plant was shutdown
daily, increasing to 3 times per shift by mid July when operation of the station became
almost impossible (James, 1967). At the Tanagwa Power Station in Japan the concrete under
ground conduit was covered with layers of attached organisms sometimes measuring to
about 70 cm thickness. A large quantity of jelly fish (150 tons/day) was also removed from
this station in one instance (Kawabe et al., 1986).
An analysis of all tube failures at Kansai Electric Power Corporation (Japan) in 1982 and
1983 showed that 94% of all tube failures were related to macrofouling lodged in the tubes
(Kawabe et al., 1986). Microfouling seems to be a major obstacle to the successful
development of the ocean thermal conversion concept into a useful solution to the world’s
energy supply (Corpe, 1984 and Darby, 1984). It has been reported that up to 3.8% loss in
unit availability in large power plants could be attributed to poor condenser tube and
auxiliary system reliability (Syrett and Coit, 1983). A 250 micron thick layer of slime may
result in up to a 50% reduction in heat transfer by heat exchangers (Goodman, 1987).
1.2 Bio-growth in different sections of a cooling water system
A typical cooling water system of a power plant involves a pre-condenser system and the
heat exchangers which includes main condenser and process water heat exchangers. The
pre-condenser system involves the intake structures and the cooling water system from
intake to the pump house. The intake system is either an open canal or pipeline or a tunnel.
It has been observed that macrofouling generally takes place in the pre-condenser system
whereas, microfouling is observed in the condenser and process water heat exchangers. This
could be due to difference in the various features like flow, temperature, space etc at
different parts of the cooling water system. In spite of various physical measures such as
trash rack, intake screen, travelling water screen, to control biofouling, the tiny larval forms
of various organisms enter the system, settle and colonize inside it and finally affect the
smooth operation of the cooling water system. These organisms clog cooling water flow
endangering the safety-related systems at some power plants. During the construction,
when the tunnel is ready and the biocide treatment plant is yet to be operational, the intake
structure gets severely fouled by macrofoulers. Despite efforts to provide an effective design
of heat exchanger and careful attention to the maintenance of the design operating
conditions, it is likely that fouling on the water side of the heat exchangers will occur unless
suitable precautions are taken. The common practice of taking water from natural sources
such as rivers and lakes for cooling purposes means that it contains micro- and macro-
organisms, which will colonize the heat transfer surfaces, to the detriment of cooling
efficiency. The problem will be aggravated by the fact that the temperature of the waterside
surface in the heat exchanger is usually close to the optimum temperature for maximum
microbial growth. In addition, water from natural sources contains nutrients from the
breakdown of naturally occurring organic material. Unless this bioactivity is controlled the
efficiency of the heat exchanger will be seriously reduced.
1.3 Biofouling and safety consequences of nuclear power plants
Many nuclear power plants have experienced fouling in their cooling water systems
(Satpathy, 1996). These fouling incidents have caused flow degradation and blockage in a
www.intechopen.com
Biofouling and its control in seawater cooled power plant cooling water system - a review 193
and other auxiliary heat exchanger systems for efficient operation of the plant. However,
use of seawater, brings associated problems such as colonization of biota which stands in
the way of smooth operation of the plant. Unfortunately, every cooling system with its
concrete walls forms a suitable substrate for marine growth. Some of the conditions which
favour the development of a fouling community in power plants are (a) continuous flow of
seawater rich in oxygen & food, (b) reduction in silt deposition, (c) lack of competition from
other communities and (d) reduction in the density of predators. Broadly speaking the
effects of marine growth on the power plant are (a) losses in plant efficiency, (b) mechanical
damage and (c) problem for the integrity of the cooling circuits needed for safety of nuclear
plants (Nair, 1987). Hence biofouling control aims to achieve efficient operation of the
power station at all times. It is therefore necessary for power plant designers to make a
rational choice regarding the most suitable control method to combat biofouling problem in
a practical, yet economically feasible & environmentally acceptable manner.
1.1 Economic impacts of biofouling
Economics involved in the biofouling problem of power plant as quoted by various authors
are cited here to emphasize the importance of biofouling control.
A 5mm Hg condenser back pressure improvement can equal to 0.5% improvement in the turbine
heat rate which approximately equal to 3 additional megawatts of generating capacity (Drake,
1977). Similar increase in condenser back pressure due to fouling in a 250 MW (e) plant can cost
the utility about $ 2.5 lakhs annually (Chow et al., 1987). One report estimates that fouling by
Asiatic clam alone costs the nation over a billion $ annually (Strauss, 1989). Costs for one day
unplanned outage can run into 0.3% of their earning per year, taking 300 days operation. Hence
eliminating one unplanned outage can more than pay for measures taken to maintain cooling
water tube cleanliness. Waterside resistance accounts for 72% of the total resistance to heat
transfer of the tube. Of this, the film which forms in a condenser tube accounts for a significant
39% and the rest 33% is due to scaling (Drake, 1977).
The experience of Marchwood (Southampton) showed that between 1957 and 1964, 4000
condenser tubes failed due to mussel fouling leading to leakage. Apart from the loss of
generation, these leaks contaminated the feed water system and accelerated the boiler water side
corrosion, resulting in boiler tube failures (Coughlan and Whitehouse, 1977). The inlet culverts
had to be drained for manual cleaning at least once in a year. Average quantity of mussel
removed was 40 tons but could be as high as 130 tons. Similar stations at Pools (Dorset) had a
maximum 300 tons (Coughlan and Whitehouse, 1977). About 300 tons of mussel shells were
removed each time by shock chlorination from MAPS intake tunnel on two occasions. Cost (at
1975 prices) of dropping a 500 MW (e) oil-fired station at Fawley (Southampton) was 15000
pounds per day due to fouling, excluding repairs. The cost of chlorine for this unit for the whole
year of 1975 was 7500 pound. The consequence of inadequate chlorination at Inland station
eventually led to the unit being taken off load for manual cleaning of condenser (Coughlan and
Whitehouse, 1977). It has been observed by the CEGB investigating team on biofouling control
practices that stress corrosion cracking of admirality brass condenser tubes was attributed to
ammonia produced by bacteria (Rippon, 1979).
The cleaning out of biofouling from the cooling water intake tunnels and culverts is
generally very expensive; for instance 4000 man hours were used to clean the culverts and to
remove 360 m
3
of mussels at Dunkerque in 1971 (Whitehouse et al., 1985). Within a very
short time at Carmarthen Bay Power Station, which was commissioned in July 1953, seed
mussels and various species of marine life were noticed around the main intake to the
cooling water system. By april 1954 the fouling was so severe that plant was shutdown
daily, increasing to 3 times per shift by mid July when operation of the station became
almost impossible (James, 1967). At the Tanagwa Power Station in Japan the concrete under
ground conduit was covered with layers of attached organisms sometimes measuring to
about 70 cm thickness. A large quantity of jelly fish (150 tons/day) was also removed from
this station in one instance (Kawabe et al., 1986).
An analysis of all tube failures at Kansai Electric Power Corporation (Japan) in 1982 and
1983 showed that 94% of all tube failures were related to macrofouling lodged in the tubes
(Kawabe et al., 1986). Microfouling seems to be a major obstacle to the successful
development of the ocean thermal conversion concept into a useful solution to the world’s
energy supply (Corpe, 1984 and Darby, 1984). It has been reported that up to 3.8% loss in
unit availability in large power plants could be attributed to poor condenser tube and
auxiliary system reliability (Syrett and Coit, 1983). A 250 micron thick layer of slime may
result in up to a 50% reduction in heat transfer by heat exchangers (Goodman, 1987).
1.2 Bio-growth in different sections of a cooling water system
A typical cooling water system of a power plant involves a pre-condenser system and the
heat exchangers which includes main condenser and process water heat exchangers. The
pre-condenser system involves the intake structures and the cooling water system from
intake to the pump house. The intake system is either an open canal or pipeline or a tunnel.
It has been observed that macrofouling generally takes place in the pre-condenser system
whereas, microfouling is observed in the condenser and process water heat exchangers. This
could be due to difference in the various features like flow, temperature, space etc at
different parts of the cooling water system. In spite of various physical measures such as
trash rack, intake screen, travelling water screen, to control biofouling, the tiny larval forms
of various organisms enter the system, settle and colonize inside it and finally affect the
smooth operation of the cooling water system. These organisms clog cooling water flow
endangering the safety-related systems at some power plants. During the construction,
when the tunnel is ready and the biocide treatment plant is yet to be operational, the intake
structure gets severely fouled by macrofoulers. Despite efforts to provide an effective design
of heat exchanger and careful attention to the maintenance of the design operating
conditions, it is likely that fouling on the water side of the heat exchangers will occur unless
suitable precautions are taken. The common practice of taking water from natural sources
such as rivers and lakes for cooling purposes means that it contains micro- and macro-
organisms, which will colonize the heat transfer surfaces, to the detriment of cooling
efficiency. The problem will be aggravated by the fact that the temperature of the waterside
surface in the heat exchanger is usually close to the optimum temperature for maximum
microbial growth. In addition, water from natural sources contains nutrients from the
breakdown of naturally occurring organic material. Unless this bioactivity is controlled the
efficiency of the heat exchanger will be seriously reduced.
1.3 Biofouling and safety consequences of nuclear power plants
Many nuclear power plants have experienced fouling in their cooling water systems
(Satpathy, 1996). These fouling incidents have caused flow degradation and blockage in a
www.intechopen.com
Nuclear Power194
variety of heat exchangers and coolers served directly by raw water. In addition, loose shells
from dead organisms are carried by the flow until they are trapped or impinged in small
piping, heat exchangers, or valves. Often the results of fouling that have accumulated
behind inlet valves and in heat exchanger water boxes degrade or compromise the safety
function of safety-related components. Events of this nature have occurred at several
nuclear plants, which prompted the Nuclear Regulatory Commission of USA to issue
warning requiring plants to determine the extent of biofouling and to outline their strategy
for controlling it (Henager et al., 1985). A few typical incidents reported in the literature are
outlined here. Brunswick power plant I and II reported blockages of their Residual Heat
Removal (RHR) heat exchangers in 1981 (Imbro and Gianelli, 1982) by American oyster
(Crassostrea virginica) shells. This produced high differential pressures across the divider
plate and caused the plate to buckle. The result was a total loss of the RHR system. The
plant was forced to provide alternate cooling. American oysters had accumulated in the
inlet piping to the RHR heat exchangers, because the chlorination had been suspended for
an extended period. RHR heat exchangers at Unit II were also fouled and severely plugged.
The Salem II (S.M. Stoller Corp. 1983) and the Arkansas Nuclear I power plant have
reported flow blockages to containment fan cooling units (plugging a backpressure control
valve, which restricted flow in the containment fan cooling units) and fouling of
containment cooling units respectively (Nuclear Regulatory Commission, 1984, Haried,
1982). Blue mussel shells deposits in the water jacket cooler of a diesel generator at Salem I
& Millstone II plant caused the generator to overheat and subsequently trip off (S. M. Stoller
Corp. 1977). An industrial processing plant experienced severe Asiatic clam (Corbicula
fluminea) fouling in its fire protection lines because of frequent flow testing at reduced flow
rates. When full flow testing was initiated after several years of operation, the sudden flow
surge caused severe blockage in the main and branch piping (Neitzel et al., 1984). Fouling in
fire protection systems by Asiatic clam has also been reported at Browns Ferry (Tennessee
Valley Authority, 1981) and McGuire power plant (Duke Power Co., 1981). The main
condenser at Browns Ferry 1 was severely fouled with Asiatic clams only a few months after
the plant began operation in 1974 and the problem increased subsequently (Rains et al.,
1984). At Pilgrim I power plant, blue mussels blocked cooling water flow and caused an
increase in differential pressure across the divider plates, forcing the plates out of position
leading to loss of Reactor Building Closed Cooling Water (RBCCW) heat exchanger capacity
(Imbro, 1982). At Trojan power plant, Asiatic clams plugged one of the heat exchangers that
cool the lubricating oil to the main turbine bearings (Portland General Electric Co., 1981).
Temporary stoppage of normal preventive maintenance during an extended plant
shutdown at San Onofre I power plant allowed barnacles (Pollicipes plymerus) to incapacitate
a component cooling water heat exchanger (Henager et al., 1985). In the same plant a
butterfly valve malfunctioned on the seawater discharge side of the cooling water heat
exchanger because massive growth of barnacles had reduced the effective diameter of the
pipe and impeded valve movement (Henager et al., 1985). In September 1984, St. Lucie
power plant reported plugging of its intake screens by Jellyfish (Henager et al., 1985). In
August 1983, Calvert Cliffs I power plant tripped manually to avoid an automatic turbine/
reactor trip due to low condenser vacuum, which was the result of shutting down two of six
circulating cooling water pumps because their inlet screens had become plugged with fish
(Nuclear Regulatory Commission, 1984).
1.3.1 Events that could exacerbate fouling
Some of the non-fouling events could cause a normal bifouling situation to become serious.
Generally they are three types; 1) environmental events that affect fouling populations
within the plant and in the vicinity of the plant, 2) plant operating events or procedures that
may dislodge or kill fouling organisms, and 3) biofouling surveillance and control
procedures that may exacerbate fouling.
a. Environmental Events
The following environmental events could occur at nuclear power plants site and affect safe
plant operation. Dynamic shocks due to seismic activity, explosions (intentional and
accidental), or similar events could loosen fouling organism from their substrate and these
can subsequently clog heat exchangers downstream. Heavy rain storms and flooding could
wash bivalves from their substrate and carry them into the intake pumps. It can also create a
thermal shock which could kill fouling organisms and fish leading to blockage of cooling
water systems. Heavy rains also have the potential of creating an osmotic shock due to a
rapid decrease in the salinity of the cooling water source resulting in massive killing of
fouling organisms. Toxic chemical spills (pesticides, herbicides, industrial chemicals, oil,
etc.) due to tanker spills and leakage of pipe line upstream of the plant could kill fouling
organisms in the cooling water source and within the plant.
b. In-plants
Some transients and operating procedures that occur during the operation of nuclear power
plants can affect biofouling. Although, most of these procedures are necessary, however,
several improvements could be made to eliminate or reduce biofouling events associated
with these procedures. The following in-plant events have occurred at nuclear power plants
leading to dislodge or movement of fouling organism. Sudden changes in flow velocity
(increases in velocity) have washed accumulations of bivalves into heat exchangers.
Changes in flow direction may also cause bivalves to move into areas with higher velocity
from where they can be swept downstream. Sudden gush of cooling water (Water hammer)
has been implicated as a cause of heat exchanger clogging at Arkansas Nuclear I plant (due
to dislodging of Asiatic clams) and at the Brunswick plant (American oysters) allowing
them to be swept into their Residual Heat Removal heat exchangers (Harried, 1982).
Thermal shock from either a rapid cooling or heating of the raw water can kill bivalves. At
pilgrim power plant, the inadvertent routing of heated water into the service-water intake
structure from a condenser backwashing operation caused a massive kill of blue mussels in
the intake structure and in the service-water headers (Satpathy et al., 2003). The plant was
forced to reduce power to 30% while blue mussels continued to break loose and plug the
Reactor Building Closed Cooling Water (RBCCW) heat exchangers. This continued for
approximately 3 months. Allowing bivalve shells to accumulate in the intake structure and
in areas of the raw-water system encourages clogging and lead to reduced suction head and
vortexing problems in the circulating water and service-water. It was reported that
accumulations of Asiatic clam shells and silt up to 90 cm (3 ft) deep are not uncommon in
the intake structure (Satpathy et al., 2003). Blue mussels have also been described as forming
1.2-m-thick (4-ft-thick) mats on the walls of intake structures (Henager et al., 1985). Starting
up of inactive systems has led to clogging when precautions were not taken to prevent
bivalves from entering and growing in those systems. The initial flow surge through the
system can carry loose bivalves and shells into constricted areas downstream. Chronic
fouling has been reported in raw-water cooling loops that are used infrequently (Henager et
al., 1985).
www.intechopen.com
Biofouling and its control in seawater cooled power plant cooling water system - a review 195
variety of heat exchangers and coolers served directly by raw water. In addition, loose shells
from dead organisms are carried by the flow until they are trapped or impinged in small
piping, heat exchangers, or valves. Often the results of fouling that have accumulated
behind inlet valves and in heat exchanger water boxes degrade or compromise the safety
function of safety-related components. Events of this nature have occurred at several
nuclear plants, which prompted the Nuclear Regulatory Commission of USA to issue
warning requiring plants to determine the extent of biofouling and to outline their strategy
for controlling it (Henager et al., 1985). A few typical incidents reported in the literature are
outlined here. Brunswick power plant I and II reported blockages of their Residual Heat
Removal (RHR) heat exchangers in 1981 (Imbro and Gianelli, 1982) by American oyster
(Crassostrea virginica) shells. This produced high differential pressures across the divider
plate and caused the plate to buckle. The result was a total loss of the RHR system. The
plant was forced to provide alternate cooling. American oysters had accumulated in the
inlet piping to the RHR heat exchangers, because the chlorination had been suspended for
an extended period. RHR heat exchangers at Unit II were also fouled and severely plugged.
The Salem II (S.M. Stoller Corp. 1983) and the Arkansas Nuclear I power plant have
reported flow blockages to containment fan cooling units (plugging a backpressure control
valve, which restricted flow in the containment fan cooling units) and fouling of
containment cooling units respectively (Nuclear Regulatory Commission, 1984, Haried,
1982). Blue mussel shells deposits in the water jacket cooler of a diesel generator at Salem I
& Millstone II plant caused the generator to overheat and subsequently trip off (S. M. Stoller
Corp. 1977). An industrial processing plant experienced severe Asiatic clam (Corbicula
fluminea) fouling in its fire protection lines because of frequent flow testing at reduced flow
rates. When full flow testing was initiated after several years of operation, the sudden flow
surge caused severe blockage in the main and branch piping (Neitzel et al., 1984). Fouling in
fire protection systems by Asiatic clam has also been reported at Browns Ferry (Tennessee
Valley Authority, 1981) and McGuire power plant (Duke Power Co., 1981). The main
condenser at Browns Ferry 1 was severely fouled with Asiatic clams only a few months after
the plant began operation in 1974 and the problem increased subsequently (Rains et al.,
1984). At Pilgrim I power plant, blue mussels blocked cooling water flow and caused an
increase in differential pressure across the divider plates, forcing the plates out of position
leading to loss of Reactor Building Closed Cooling Water (RBCCW) heat exchanger capacity
(Imbro, 1982). At Trojan power plant, Asiatic clams plugged one of the heat exchangers that
cool the lubricating oil to the main turbine bearings (Portland General Electric Co., 1981).
Temporary stoppage of normal preventive maintenance during an extended plant
shutdown at San Onofre I power plant allowed barnacles (Pollicipes plymerus) to incapacitate
a component cooling water heat exchanger (Henager et al., 1985). In the same plant a
butterfly valve malfunctioned on the seawater discharge side of the cooling water heat
exchanger because massive growth of barnacles had reduced the effective diameter of the
pipe and impeded valve movement (Henager et al., 1985). In September 1984, St. Lucie
power plant reported plugging of its intake screens by Jellyfish (Henager et al., 1985). In
August 1983, Calvert Cliffs I power plant tripped manually to avoid an automatic turbine/
reactor trip due to low condenser vacuum, which was the result of shutting down two of six
circulating cooling water pumps because their inlet screens had become plugged with fish
(Nuclear Regulatory Commission, 1984).
1.3.1 Events that could exacerbate fouling
Some of the non-fouling events could cause a normal bifouling situation to become serious.
Generally they are three types; 1) environmental events that affect fouling populations
within the plant and in the vicinity of the plant, 2) plant operating events or procedures that
may dislodge or kill fouling organisms, and 3) biofouling surveillance and control
procedures that may exacerbate fouling.
a. Environmental Events
The following environmental events could occur at nuclear power plants site and affect safe
plant operation. Dynamic shocks due to seismic activity, explosions (intentional and
accidental), or similar events could loosen fouling organism from their substrate and these
can subsequently clog heat exchangers downstream. Heavy rain storms and flooding could
wash bivalves from their substrate and carry them into the intake pumps. It can also create a
thermal shock which could kill fouling organisms and fish leading to blockage of cooling
water systems. Heavy rains also have the potential of creating an osmotic shock due to a
rapid decrease in the salinity of the cooling water source resulting in massive killing of
fouling organisms. Toxic chemical spills (pesticides, herbicides, industrial chemicals, oil,
etc.) due to tanker spills and leakage of pipe line upstream of the plant could kill fouling
organisms in the cooling water source and within the plant.
b. In-plants
Some transients and operating procedures that occur during the operation of nuclear power
plants can affect biofouling. Although, most of these procedures are necessary, however,
several improvements could be made to eliminate or reduce biofouling events associated
with these procedures. The following in-plant events have occurred at nuclear power plants
leading to dislodge or movement of fouling organism. Sudden changes in flow velocity
(increases in velocity) have washed accumulations of bivalves into heat exchangers.
Changes in flow direction may also cause bivalves to move into areas with higher velocity
from where they can be swept downstream. Sudden gush of cooling water (Water hammer)
has been implicated as a cause of heat exchanger clogging at Arkansas Nuclear I plant (due
to dislodging of Asiatic clams) and at the Brunswick plant (American oysters) allowing
them to be swept into their Residual Heat Removal heat exchangers (Harried, 1982).
Thermal shock from either a rapid cooling or heating of the raw water can kill bivalves. At
pilgrim power plant, the inadvertent routing of heated water into the service-water intake
structure from a condenser backwashing operation caused a massive kill of blue mussels in
the intake structure and in the service-water headers (Satpathy et al., 2003). The plant was
forced to reduce power to 30% while blue mussels continued to break loose and plug the
Reactor Building Closed Cooling Water (RBCCW) heat exchangers. This continued for
approximately 3 months. Allowing bivalve shells to accumulate in the intake structure and
in areas of the raw-water system encourages clogging and lead to reduced suction head and
vortexing problems in the circulating water and service-water. It was reported that
accumulations of Asiatic clam shells and silt up to 90 cm (3 ft) deep are not uncommon in
the intake structure (Satpathy et al., 2003). Blue mussels have also been described as forming
1.2-m-thick (4-ft-thick) mats on the walls of intake structures (Henager et al., 1985). Starting
up of inactive systems has led to clogging when precautions were not taken to prevent
bivalves from entering and growing in those systems. The initial flow surge through the
system can carry loose bivalves and shells into constricted areas downstream. Chronic
fouling has been reported in raw-water cooling loops that are used infrequently (Henager et
al., 1985).
www.intechopen.com
Nuclear Power196
Chemical such as diesel oil, lubricating oil, and other toxic chemicals used at nuclear plants
could spill in the intake structure and kill fouling organisms. Pump cavitation from plugged
suction lines to the pumps would result in increased wear and decreased performance of
service-water booster pumps and the main pumps in the fire protection system. The
vibration of lines associated with cavitating pumps may also dislodge bivalves and cause
fouling downstream. Flushing fouling organisms into drains and sumps could cause
plugging and subsequent flooding of equipment rooms. This could damage electrical
equipment such as pump motors, electronic instrumentation, and motor-controller valves.
Leaking valves have allowed the continuous flow of water to carry food and oxygen to
bivalves. Several utilities indicate this as a major cause of fouling in plants (Henager et al.,
1985). The same effect may occur in lines where valves are inadvertently left in the semi-
opened position. Near stagnant conditions in water systems provide ideal conditions for
bivalve growth. This is especially true for Asiatic clams. Most plants typically operate with
nearly 80% of the cooling loops in this condition (Neitzel et al., 1984) in order to maintain
redundant cooling loops in standby condition. Damaged or missing intake screens and
strainers have allowed adult organisms to be sucked into the cooling water system. Also,
severe plugging from weeds, grass, and ice have caused the automatic strainer wash
systems to malfunction at Salem 1 plant (S.M.Stoller Corp. 1978) and at Indian Point 3 plant
(S.M. Stoller Corp. 1983).
c. Surveillance and control procedures
Biofouling control techniques can be divided into two major categories, detection /
surveillance and control / prevention programs. Surveillance refers to detecting the
biofouling and the subsequent flow degradation. The goal of control techniques, however, is
to limit biofouling to a safe and acceptable level. Surveillance and control procedures could
cause organisms to flourish or to become dislodged (Daling and Johnson, 1985). Thermal
backwashing, although an effective method of killing bivalves, can result in enhanced
clogging of heat exchangers when measures are not taken to remove the bivalves that are
killed. It is also important to account for the time lag between the thermal treatment and the
detachment of the bivalves. This is especially true for blue mussel and American oyster
fouling. Thermal backwashing should be scheduled to prevent bivalves from growing large
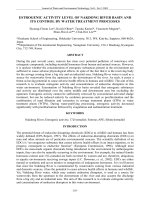
enough to block condenser tubes. Similarly, when shock chlorination is used to kill the
established community and subsequently care is not taken to remove them, they accumulate
and clog downstream (Fig. 1).
Fig. 1. Removed fouling organisms from the tunnel of a seawater cooled nuclear power
plant (Madras Atomic Power Station) by shock chlorination
Increased flow rates during testing can wash bivalves into heat exchangers. This is
especially true of Asiatic clam fouling because adults lose the ability to attach to substrates
and will be flushed into downstream heat exchangers at increased flow rates. The initial
flow testing or flushing of a stagnant, infested line has led to an unexpectedly large number
of bivalves which occurred at Browns Ferry 1 power plant, when the condenser circulating
water system was started up after construction was completed. An intermittent chlorination
system that malfunctioned and released a massive dose of chlorine to the intake killed large
numbers of bivalves. These bivalves later detached and clogged heat exchangers. The
intermittent chlorine application would not control bivalves in the system, but a large
chlorine spill may be concentrated enough and last long enough to kill bivalves.
The following enhanced growth events have occurred at nuclear power plants due to
procedures or strategies. Infrequent or inadequate chlorination caused by faulty or wrongly
calibrated chlorinating metering systems or by intentional, intermittent applications of
chlorine have allowed bivalves to survive in raw-water systems. Personnel from several
plants remarked that bivalve fouling became worse when the chlorination system was out of
service for an extended period. Intermittent chlorination to control slime and other
microfouling has been ineffective in controlling bivalves because, they are able to close their
shells tightly during periods of chlorination. Failure to chlorinate normally stagnant cooling
loops, which already have a high potential for fouling, can substantially increase the fouling
potential of the system. Frequent flow testing, particularly if done at low flow velocity, may
improve the growth potential of the system by providing a more frequent supply of food
and oxygen to bivalves. This effect is intensified if flow testing is not concomitant with
chlorination. The intermittent, “non-design” use of the fire protection system to water lawns
and wash equipment has also provided enhanced conditions for Asiatic clam growth.
1.4 Biofouling at Madras Atomic Power Station
The best approach to understand biofouling problem in a seawater cooled power plant is by
taking a typical example which has been studied well. The Madras Atomic Power Station
(MAPS) located at Kalpakkam (12 33″ N; 80 11″ E) consists of two units of Pressurized
Heavy Water Reactor (PHWR), each of 235 MW (e) capacity. Seawater is used at the rate of
35 m
3
sec
-1
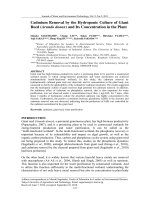
as the coolant for the condenser and process cooling water systems. A sub-seabed
tunnel located 53 m below the bottom terrain draws seawater (Fig. 2). The tunnel is 468 m
long and 3.8 m in diameter. It is connected at the landward end to the pump house through
a vertical shaft of 53 m deep and 6 m diameter called forebay. Similarly, the seaward end of
the tunnel is connected to a vertical shaft of 48 m and 4.25 m diameter called intake.
Seawater enters the intake through 16 windows located radially at the intake structure, 1 m
below the lowest low water spring tide. The tunnel, intake and forebay shafts support a
heavy growth of benthic organisms such as mussels, barnacles, oysters, ascidians etc. The
high density of these fouling organisms inside the tunnel/cooling systems could be
attributed to continuous supply of oxygen & food and removal of excretory products by the
passing seawater providing a conducive environment for their settlement and growth. In
addition, absence of any potential predator inside the cooling system supports a luxuriant
growth of these communities. The physical shape of the tunnel is such that it is an isolated
system open at both ends; seawater samples can be collected at intake as the control
location, whereas, samples collected at forebay after flowing past the fouling communities
can be investigated for change in its physicochemical properties.
www.intechopen.com
Biofouling and its control in seawater cooled power plant cooling water system - a review 197
Chemical such as diesel oil, lubricating oil, and other toxic chemicals used at nuclear plants
could spill in the intake structure and kill fouling organisms. Pump cavitation from plugged
suction lines to the pumps would result in increased wear and decreased performance of
service-water booster pumps and the main pumps in the fire protection system. The
vibration of lines associated with cavitating pumps may also dislodge bivalves and cause
fouling downstream. Flushing fouling organisms into drains and sumps could cause
plugging and subsequent flooding of equipment rooms. This could damage electrical
equipment such as pump motors, electronic instrumentation, and motor-controller valves.
Leaking valves have allowed the continuous flow of water to carry food and oxygen to
bivalves. Several utilities indicate this as a major cause of fouling in plants (Henager et al.,
1985). The same effect may occur in lines where valves are inadvertently left in the semi-
opened position. Near stagnant conditions in water systems provide ideal conditions for
bivalve growth. This is especially true for Asiatic clams. Most plants typically operate with
nearly 80% of the cooling loops in this condition (Neitzel et al., 1984) in order to maintain
redundant cooling loops in standby condition. Damaged or missing intake screens and
strainers have allowed adult organisms to be sucked into the cooling water system. Also,
severe plugging from weeds, grass, and ice have caused the automatic strainer wash
systems to malfunction at Salem 1 plant (S.M.Stoller Corp. 1978) and at Indian Point 3 plant
(S.M. Stoller Corp. 1983).
c. Surveillance and control procedures
Biofouling control techniques can be divided into two major categories, detection /
surveillance and control / prevention programs. Surveillance refers to detecting the
biofouling and the subsequent flow degradation. The goal of control techniques, however, is
to limit biofouling to a safe and acceptable level. Surveillance and control procedures could
cause organisms to flourish or to become dislodged (Daling and Johnson, 1985). Thermal
backwashing, although an effective method of killing bivalves, can result in enhanced
clogging of heat exchangers when measures are not taken to remove the bivalves that are
killed. It is also important to account for the time lag between the thermal treatment and the
detachment of the bivalves. This is especially true for blue mussel and American oyster
fouling. Thermal backwashing should be scheduled to prevent bivalves from growing large
enough to block condenser tubes. Similarly, when shock chlorination is used to kill the
established community and subsequently care is not taken to remove them, they accumulate
and clog downstream (Fig. 1).
Fig. 1. Removed fouling organisms from the tunnel of a seawater cooled nuclear power
plant (Madras Atomic Power Station) by shock chlorination
Increased flow rates during testing can wash bivalves into heat exchangers. This is
especially true of Asiatic clam fouling because adults lose the ability to attach to substrates
and will be flushed into downstream heat exchangers at increased flow rates. The initial
flow testing or flushing of a stagnant, infested line has led to an unexpectedly large number
of bivalves which occurred at Browns Ferry 1 power plant, when the condenser circulating
water system was started up after construction was completed. An intermittent chlorination
system that malfunctioned and released a massive dose of chlorine to the intake killed large
numbers of bivalves. These bivalves later detached and clogged heat exchangers. The
intermittent chlorine application would not control bivalves in the system, but a large
chlorine spill may be concentrated enough and last long enough to kill bivalves.
The following enhanced growth events have occurred at nuclear power plants due to
procedures or strategies. Infrequent or inadequate chlorination caused by faulty or wrongly
calibrated chlorinating metering systems or by intentional, intermittent applications of
chlorine have allowed bivalves to survive in raw-water systems. Personnel from several
plants remarked that bivalve fouling became worse when the chlorination system was out of
service for an extended period. Intermittent chlorination to control slime and other
microfouling has been ineffective in controlling bivalves because, they are able to close their
shells tightly during periods of chlorination. Failure to chlorinate normally stagnant cooling
loops, which already have a high potential for fouling, can substantially increase the fouling
potential of the system. Frequent flow testing, particularly if done at low flow velocity, may
improve the growth potential of the system by providing a more frequent supply of food
and oxygen to bivalves. This effect is intensified if flow testing is not concomitant with
chlorination. The intermittent, “non-design” use of the fire protection system to water lawns
and wash equipment has also provided enhanced conditions for Asiatic clam growth.
1.4 Biofouling at Madras Atomic Power Station
The best approach to understand biofouling problem in a seawater cooled power plant is by
taking a typical example which has been studied well. The Madras Atomic Power Station
(MAPS) located at Kalpakkam (12 33″ N; 80 11″ E) consists of two units of Pressurized
Heavy Water Reactor (PHWR), each of 235 MW (e) capacity. Seawater is used at the rate of
35 m
3
sec
-1
as the coolant for the condenser and process cooling water systems. A sub-seabed
tunnel located 53 m below the bottom terrain draws seawater (Fig. 2). The tunnel is 468 m
long and 3.8 m in diameter. It is connected at the landward end to the pump house through
a vertical shaft of 53 m deep and 6 m diameter called forebay. Similarly, the seaward end of
the tunnel is connected to a vertical shaft of 48 m and 4.25 m diameter called intake.
Seawater enters the intake through 16 windows located radially at the intake structure, 1 m
below the lowest low water spring tide. The tunnel, intake and forebay shafts support a
heavy growth of benthic organisms such as mussels, barnacles, oysters, ascidians etc. The
high density of these fouling organisms inside the tunnel/cooling systems could be
attributed to continuous supply of oxygen & food and removal of excretory products by the
passing seawater providing a conducive environment for their settlement and growth. In
addition, absence of any potential predator inside the cooling system supports a luxuriant
growth of these communities. The physical shape of the tunnel is such that it is an isolated
system open at both ends; seawater samples can be collected at intake as the control
location, whereas, samples collected at forebay after flowing past the fouling communities
can be investigated for change in its physicochemical properties.
www.intechopen.com
Nuclear Power198
Biofouling in the cooling system of seawater-cooled power plants is a universal problem
(Brankevich et al., 1988; Chadwick et al., 1950; Collins, 1964; Holems, 1967; James, 1967;
Relini, 1980; Satpathy, 1990). It is of considerable interest as it imposes penalty on power
production, impairs the integrity of cooling system components and in some cases even
precipitates safety problems associated with cooling system of nuclear power plants
(Henager et al., 1985; Rains et al., 1984), which has been already discussed. Different aspects
of biofouling in the cooling conduits of coastal power plant from tropical as well as
temperate regions have been studied by several researchers (Brankevich et al., 1988;
Chadwick et al., 1950; Collins, 1964; Holems, 1967; James, 1967; Relini, 1984; Satpathy, 1990;
Sashikumar, 1991). The problem of biofouling in a tropical seawater cooled power plant can
be understood by explaining a typical case study. Studies carried out in this regard from
Indian coast have not been exhaustive however, from Kalpakkam coast, south east coast of
India, it has been immense due to its importance to the existing MAPS. Biofouling has been
a serious problem in the cooling water system of MAPS. It had affected adversely the
cooling system and performance of the plant (Sashikumar, 1991; Rajagopal, et al., 1991;
Satpathy et al., 1994). Investigation on the fouling problems of MAPS cooling system
indicated extensive settlement of macro-fouling organisms inside the tunnel, which was
calculated to be around 580 tonnes (Nair, 1985) that caused severe pressure drops in the
cooling circuits.
Fig. 2. Schematic diagram of the cooling water structure of MAPS
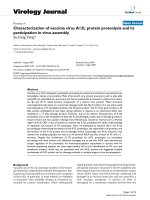
Fig. 3. A view of bio-growth inside seawater pipe lines from MAPS
The intake submarine tunnel was observed to have a maximum of 25 cm thick layer of
fouling organism with an average of 18 cm (Satpathy et al., 1994). A typical blockage of a
3.8 m
Intake
Forebay
Forebay shaft 53 m
Intake shaft 48 m
4.25 m
6.0 m
Horizontal tunnel 468
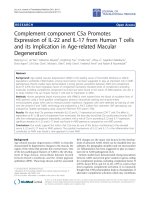
cooling water pipe is shown in Fig. 3. In addition stupendous growth of fouling organisms
on the intake screen (Fig. 4a) of MAPS impedes its smooth operation (Satpathy, 1996). The
condenser tubes of MAPS were severely affected by the clogging of dead green mussel (Fig.
4b) (Satpathy, 1996). Similarly, jelly fish ingress and clogging of intake and traveling water
screen forcing the plant authorities to shut down the reactor (Masilamani et al., 2000), has
been another problem. Albeit, it is a seasonal issue, it also plays havoc with the operation of
the cooling water system and ultimately power plant operation.
(a) (b)
Fig. 4. Blockage of intake screen by fouling organisms (a) and blockage of condenser tubes
by green mussels & barnacles (b)
2. Description of the locality
Kalpakkam coast (12
o
33' N Lat. and 80
o
11' E Long.) is situated about 80 km south of
Chennai (Fig. 5). At present a nuclear power plant (MAPS) and a desalination plant are
located near the coast. MAPS uses seawater at a rate of 35 m
3
sec
-1
for condenser cooling
purpose. The seawater is drawn through an intake structure located inside the sea at about
500 m away from the shore. After extracting heat, the heated seawater is released into the
sea. Two backwaters namely the Edaiyur and the Sadras backwater system are important
features of this coast. These backwaters are connected to the Buckingham canal, which runs
parallel to the coast. Based on the pattern of rainfall and associated changes in hydrographic
characteristics at Kalpakkam coast, the whole year has been divided into three seasons viz:
1) Summer (February-June), 2) South West (SW) monsoon (July-September) and 3) North
East (NE) monsoon (October-January) (Nair and Ganapathy, 1983). Seasonal monsoon
reversal of wind is a unique feature of Indian Ocean that results in consequent change in the
circulation pattern (La Fond, 1957; Wyrtki, 1973), which is felt at this location too. The wind
reversal occurs during the transition period between the SW monsoon and NE monsoon. In
general, the SW to NE monsoon transition occurs during September/ October and the NE to
SW transition occurs during February/ March. The pole-ward current during SW monsoon
changes to equator-ward during the SW to NE monsoon transition, whereas, a reverse
current pattern is observed during the transition period between NE to SW monsoon
(Varkey et al., 1996; Vinaychandran et al., 1999; Haugen et al., 2003). Subsequent to the
change in the current pattern, the alterations of coastal water quality have been reported
(Somayajulu et al., 1987; Ramaraju et al., 1992; Babu, 1992; Saravanane, 2000). The
phenomenon of upwelling has also been reported to occur during the pre-NE monsoon
period in the southeast coast of India in low temperature and high saline water mass (De
Souza et al., 1981; La Fond, 1957; Ramaraju et al., 1992, Suryanarayan and Rao, 1992). During
www.intechopen.com
Biofouling and its control in seawater cooled power plant cooling water system - a review 199
Biofouling in the cooling system of seawater-cooled power plants is a universal problem
(Brankevich et al., 1988; Chadwick et al., 1950; Collins, 1964; Holems, 1967; James, 1967;
Relini, 1980; Satpathy, 1990). It is of considerable interest as it imposes penalty on power
production, impairs the integrity of cooling system components and in some cases even
precipitates safety problems associated with cooling system of nuclear power plants
(Henager et al., 1985; Rains et al., 1984), which has been already discussed. Different aspects
of biofouling in the cooling conduits of coastal power plant from tropical as well as
temperate regions have been studied by several researchers (Brankevich et al., 1988;
Chadwick et al., 1950; Collins, 1964; Holems, 1967; James, 1967; Relini, 1984; Satpathy, 1990;
Sashikumar, 1991). The problem of biofouling in a tropical seawater cooled power plant can
be understood by explaining a typical case study. Studies carried out in this regard from
Indian coast have not been exhaustive however, from Kalpakkam coast, south east coast of
India, it has been immense due to its importance to the existing MAPS. Biofouling has been
a serious problem in the cooling water system of MAPS. It had affected adversely the
cooling system and performance of the plant (Sashikumar, 1991; Rajagopal, et al., 1991;
Satpathy et al., 1994). Investigation on the fouling problems of MAPS cooling system
indicated extensive settlement of macro-fouling organisms inside the tunnel, which was
calculated to be around 580 tonnes (Nair, 1985) that caused severe pressure drops in the
cooling circuits.
Fig. 2. Schematic diagram of the cooling water structure of MAPS
Fig. 3. A view of bio-growth inside seawater pipe lines from MAPS
The intake submarine tunnel was observed to have a maximum of 25 cm thick layer of
fouling organism with an average of 18 cm (Satpathy et al., 1994). A typical blockage of a
3.8 m
Intake
Forebay
Forebay shaft 53 m
Intake shaft 48 m
4.25 m
6.0 m
Horizontal tunnel 468
cooling water pipe is shown in Fig. 3. In addition stupendous growth of fouling organisms
on the intake screen (Fig. 4a) of MAPS impedes its smooth operation (Satpathy, 1996). The
condenser tubes of MAPS were severely affected by the clogging of dead green mussel (Fig.
4b) (Satpathy, 1996). Similarly, jelly fish ingress and clogging of intake and traveling water
screen forcing the plant authorities to shut down the reactor (Masilamani et al., 2000), has
been another problem. Albeit, it is a seasonal issue, it also plays havoc with the operation of
the cooling water system and ultimately power plant operation.
(a) (b)
Fig. 4. Blockage of intake screen by fouling organisms (a) and blockage of condenser tubes
by green mussels & barnacles (b)
2. Description of the locality
Kalpakkam coast (12
o
33' N Lat. and 80
o
11' E Long.) is situated about 80 km south of
Chennai (Fig. 5). At present a nuclear power plant (MAPS) and a desalination plant are
located near the coast. MAPS uses seawater at a rate of 35 m
3
sec
-1
for condenser cooling
purpose. The seawater is drawn through an intake structure located inside the sea at about
500 m away from the shore. After extracting heat, the heated seawater is released into the
sea. Two backwaters namely the Edaiyur and the Sadras backwater system are important
features of this coast. These backwaters are connected to the Buckingham canal, which runs
parallel to the coast. Based on the pattern of rainfall and associated changes in hydrographic
characteristics at Kalpakkam coast, the whole year has been divided into three seasons viz:
1) Summer (February-June), 2) South West (SW) monsoon (July-September) and 3) North
East (NE) monsoon (October-January) (Nair and Ganapathy, 1983). Seasonal monsoon
reversal of wind is a unique feature of Indian Ocean that results in consequent change in the
circulation pattern (La Fond, 1957; Wyrtki, 1973), which is felt at this location too. The wind
reversal occurs during the transition period between the SW monsoon and NE monsoon. In
general, the SW to NE monsoon transition occurs during September/ October and the NE to
SW transition occurs during February/ March. The pole-ward current during SW monsoon
changes to equator-ward during the SW to NE monsoon transition, whereas, a reverse
current pattern is observed during the transition period between NE to SW monsoon
(Varkey et al., 1996; Vinaychandran et al., 1999; Haugen et al., 2003). Subsequent to the
change in the current pattern, the alterations of coastal water quality have been reported
(Somayajulu et al., 1987; Ramaraju et al., 1992; Babu, 1992; Saravanane, 2000). The
phenomenon of upwelling has also been reported to occur during the pre-NE monsoon
period in the southeast coast of India in low temperature and high saline water mass (De
Souza et al., 1981; La Fond, 1957; Ramaraju et al., 1992, Suryanarayan and Rao, 1992). During
www.intechopen.com
Nuclear Power200
the period of NE monsoon and seldom during SW monsoon monsoon, the two backwaters
get opened to the coast discharging considerable amount of freshwater to the coastal milieu
for a period of 2 to 3 months. This part of the peninsular India receives bulk of its rainfall (~
70%) from NE monsoon. The average rainfall at Kalpakkam is about 1200 mm. However,
with the stoppage of monsoon, a sand bar is formed between the backwaters and sea due to
the littoral drift, which is a prominent phenomenon in the east coast of India, resulting in a
situation wherein the inflow of low saline water from the backwaters to sea is stopped. This
location had been badly affected by 2004 mega Tsunami, which devastated the entire east
coast of India and had maximum impact at this part of the coast.
Fig. 5. A map of the study area, Kalpakkam coast, Bay of Bengal
The mean tidal range varied from 0.3 – 1.5 m. The coastal currents at Kalpakkam has
seasonal character and during SW monsoon the current is northerly (February to October)
with a magnitude of 0.2 – 1.8 km/h and during NE monsoon the current is southerly
(October to February) with a magnitude of 0.1 – 1.3 km/h. The wind speed varied from 10-
40 km/h. These monsoonal winds cause a) southerly (~ 0.5 million m
3
/y) & northerly (~ 1
million m
3
/y) littoral drift (Satpathy et al., 1999). The seawater temperature has two
maxima (Apr/May & Aug/Sept) and two minima (Dec/Jan & June/July) (Satpathy and
Nair, 1990; Satpathy et al., 1999; Satpathy et al., 1997).
3. Hydrobiological features of coastal waters
3.1. Methodology
Seawater samples were collected weekly near the MAPS cooling water intake for estimation
of water quality parameters such as pH, salinity, dissolved oxygen (DO), turbidity,
N
chlorophyll-a and nutrients such as, nitrite, nitrate, ammonia, total nitrogen, silicate,
phosphate and total phosphorous. Water temperature was measured at the site using a
mercury thermometer of 0.1
0
C accuracy. Salinity was measured using Knudsen’s method
(Grasshoff et al., 1983). Estimation of DO was carried out following the Winkler’s method
(Parsons et al., 1982). pH was measured using a pH probe (Cyberscan PCD 5500) with
accuracy of 0.01. Turbidity was measured using Turbidity meter (Cyberscan IR TB100)
with accuracy of 0.01 NTU. Chlorophyll-a and nutrients were analyzed following the
standard methods of Parsons et al. (1982) using a double beam UV visible
spectrophotometer (Chemito).
3.2 Results
Hydrographical parameters at this coast bear pronounced seasonal variations (Satpathy et
al., 2008, 2010). Temperature varies from 26.0 (August) to 31.8
o
C (May) indicating that the
annual gradient remained ~5.8
o
C. Seawater temperature is characterized by two maxima,
one during April/ May and another during September/ October coinciding with the trend
in atmospheric temperature. pH values ranged between 8.00 and 8.30 with maximum value
during NE monsoon period. Salinity ranged from 24.91 (November) – 35.90 psu (May),
which showed a unimodal oscillation. Dissolved oxygen (DO) values fluctuated between 4.2
and 6.1 mg l
-1
.
Values of turbidity varied between 9.21 and 21.42 NTU. Chlorophyll-a
concentration varies between 1.42 and 7.51 mg m
-3
during the month of November and
August respectively.
The maximum value of pH observed, coincides with NE monsoon period during which not
only the precipitation, but also the discharges from the nearby backwaters affect the
magnitude of pH as well as salinity significantly. As expected, the lowest salinity value
coincides with the local maximum precipitation period (NE monsoon period) and also with
the maximum influx of fresh water from the two nearby backwaters. The highest salinity
value coincides with the peak summer. DO shows an irregular pattern of distribution except
for the fact that during NE monsoon period, relatively high values are observed as expected
due to input of oxygen rich freshwater. Turbidity exhibits a bimodal oscillation with one
peak during July (pre-monsoon) and another during December (NE monsoon). This is
attributed to the relatively high phytoplankton density observed during pre-monsoon and
heavy silt-laden freshwater influx during NE monsoon seasons. A significant positive
correlation (p≥0.01) between turbidity and chlorophyll has been observed and is testimony
to the above observation during pre-monsoon period (Satpathy et al., 2010). Chlorophyll-a
values are found to be the lowest during November/ December (NE monsoon) and highest
during August/ September (Southwest-Northeast monsoon transition). Relatively high
concentration of chlorophyll-a coincides with summer and pre-monsoon period, when
relatively stable as well as optimal conditions of salinity, temperature, light, nutrient levels
(conducive for production of copious amount of phytoplankton) prevails. Depletion of
chlorophyll concentration during monsoon period is mainly associated with low saline, low
temperature, low irradiance and high turbidity condition.
Nutrient concentrations in general show well pronounced seasonal variation mostly influenced
by monsoonal rain. The two back waters, which are part of the ecosystem at this location, receive
various wastes (domestic, agricultural etc.) from the nearby township and villages and thereby
get enriched with nutrients. These backwaters get open to the coastal water during the NE
monsoon period resulting in influx of the nutrient rich fresh water into the coastal milieu, which
www.intechopen.com
Biofouling and its control in seawater cooled power plant cooling water system - a review 201
the period of NE monsoon and seldom during SW monsoon monsoon, the two backwaters
get opened to the coast discharging considerable amount of freshwater to the coastal milieu
for a period of 2 to 3 months. This part of the peninsular India receives bulk of its rainfall (~
70%) from NE monsoon. The average rainfall at Kalpakkam is about 1200 mm. However,
with the stoppage of monsoon, a sand bar is formed between the backwaters and sea due to
the littoral drift, which is a prominent phenomenon in the east coast of India, resulting in a
situation wherein the inflow of low saline water from the backwaters to sea is stopped. This
location had been badly affected by 2004 mega Tsunami, which devastated the entire east
coast of India and had maximum impact at this part of the coast.
Fig. 5. A map of the study area, Kalpakkam coast, Bay of Bengal
The mean tidal range varied from 0.3 – 1.5 m. The coastal currents at Kalpakkam has
seasonal character and during SW monsoon the current is northerly (February to October)
with a magnitude of 0.2 – 1.8 km/h and during NE monsoon the current is southerly
(October to February) with a magnitude of 0.1 – 1.3 km/h. The wind speed varied from 10-
40 km/h. These monsoonal winds cause a) southerly (~ 0.5 million m
3
/y) & northerly (~ 1
million m
3
/y) littoral drift (Satpathy et al., 1999). The seawater temperature has two
maxima (Apr/May & Aug/Sept) and two minima (Dec/Jan & June/July) (Satpathy and
Nair, 1990; Satpathy et al., 1999; Satpathy et al., 1997).
3. Hydrobiological features of coastal waters
3.1. Methodology
Seawater samples were collected weekly near the MAPS cooling water intake for estimation
of water quality parameters such as pH, salinity, dissolved oxygen (DO), turbidity,
N
chlorophyll-a and nutrients such as, nitrite, nitrate, ammonia, total nitrogen, silicate,
phosphate and total phosphorous. Water temperature was measured at the site using a
mercury thermometer of 0.1
0
C accuracy. Salinity was measured using Knudsen’s method
(Grasshoff et al., 1983). Estimation of DO was carried out following the Winkler’s method
(Parsons et al., 1982). pH was measured using a pH probe (Cyberscan PCD 5500) with
accuracy of 0.01. Turbidity was measured using Turbidity meter (Cyberscan IR TB100)
with accuracy of 0.01 NTU. Chlorophyll-a and nutrients were analyzed following the
standard methods of Parsons et al. (1982) using a double beam UV visible
spectrophotometer (Chemito).
3.2 Results
Hydrographical parameters at this coast bear pronounced seasonal variations (Satpathy et
al., 2008, 2010). Temperature varies from 26.0 (August) to 31.8
o
C (May) indicating that the
annual gradient remained ~5.8
o
C. Seawater temperature is characterized by two maxima,
one during April/ May and another during September/ October coinciding with the trend
in atmospheric temperature. pH values ranged between 8.00 and 8.30 with maximum value
during NE monsoon period. Salinity ranged from 24.91 (November) – 35.90 psu (May),
which showed a unimodal oscillation. Dissolved oxygen (DO) values fluctuated between 4.2
and 6.1 mg l
-1
.
Values of turbidity varied between 9.21 and 21.42 NTU. Chlorophyll-a
concentration varies between 1.42 and 7.51 mg m
-3
during the month of November and
August respectively.
The maximum value of pH observed, coincides with NE monsoon period during which not
only the precipitation, but also the discharges from the nearby backwaters affect the
magnitude of pH as well as salinity significantly. As expected, the lowest salinity value
coincides with the local maximum precipitation period (NE monsoon period) and also with
the maximum influx of fresh water from the two nearby backwaters. The highest salinity
value coincides with the peak summer. DO shows an irregular pattern of distribution except
for the fact that during NE monsoon period, relatively high values are observed as expected
due to input of oxygen rich freshwater. Turbidity exhibits a bimodal oscillation with one
peak during July (pre-monsoon) and another during December (NE monsoon). This is
attributed to the relatively high phytoplankton density observed during pre-monsoon and
heavy silt-laden freshwater influx during NE monsoon seasons. A significant positive
correlation (p≥0.01) between turbidity and chlorophyll has been observed and is testimony
to the above observation during pre-monsoon period (Satpathy et al., 2010). Chlorophyll-a
values are found to be the lowest during November/ December (NE monsoon) and highest
during August/ September (Southwest-Northeast monsoon transition). Relatively high
concentration of chlorophyll-a coincides with summer and pre-monsoon period, when
relatively stable as well as optimal conditions of salinity, temperature, light, nutrient levels
(conducive for production of copious amount of phytoplankton) prevails. Depletion of
chlorophyll concentration during monsoon period is mainly associated with low saline, low
temperature, low irradiance and high turbidity condition.
Nutrient concentrations in general show well pronounced seasonal variation mostly influenced
by monsoonal rain. The two back waters, which are part of the ecosystem at this location, receive
various wastes (domestic, agricultural etc.) from the nearby township and villages and thereby
get enriched with nutrients. These backwaters get open to the coastal water during the NE
monsoon period resulting in influx of the nutrient rich fresh water into the coastal milieu, which
www.intechopen.com
Nuclear Power202
enhances the nutrient levels in the coastal water. Relatively low values are observed during pre-
monsoon and post- monsoon period (April-August) which is attributed to their utilization by
phytoplankton, as evident from the matching chlorophyll values during the same period.
Increased levels of phosphate is also observed during September which has been associated with
the phenomenon of upwelling, an event that generally occurs during pre-monsoon (August –
September) period along the Indian east coast (La Fond, 1957; De Souza et al., 1981; Ramaraju et
al., 1992; Suryanarayan and Rao, 1992).
4. Biofouling potential of Kalpakkam coastal waters
A close perusal of literature on biofouling studies point that they have been triggered
mainly based on two sound logics, such as scientific interest or technological need
associated with maritime activities. The methodology such as, size of panel, duration of
exposure, panel material, location of exposure etc used for biofouling studies largely remain
similar by many workers. Researchers with academic interest look for ecological succession,
species diversity, breeding pattern, seasonal variations, larval availability, climax
community, that is more towards qualitative assessment and linking them with
environmental factors. However, investigations with technological need look for
quantitative assessment such as, biomass, % of area coverage, density and occurrence
interval. Notwithstanding the interest driven by either, the three important parameters for
practical use undoubtedly are a) type of foulants, b) their growth rate and c) their seasonal
variations, which decides the use of an economic and environment-friendly fouling control
strategy. Biofouling problem is not only site specific, but also have been reported to be
different for two different power plants drawing same source of cooling water (Karande et
al., 1986), which has been attributed to different design and different material of use. An
evaluation of composition and abundance of the fouling communities available in coastal
waters provides an array of information particularly for the effective antifouling measures
to be adopted in the cooling water systems.
In order to devise an effective biofouling control measure for Prototype Fast Breeder Reactor
(under construction) cooling water system, it is essential to evaluate the present biofouling
potential at Kalpakkam coastal waters. Considering a big hiatus lapsed between the last
study (almost 20 years old) and the present need, a study was carried out with the following
objectives; to find out a) the present seasonal settlement pattern of biofoulers, dominant
species and breeding pattern, b) any change, as compared to that of earlier reported data
and c) the role of physico-chemical characteristics of coastal water on biofouling. Moreover,
this coast was severely affected by 2004 tsunami. Thus, the present study also brings out any
change in settlement pattern, diversity, biomass and population density between pre- and
post-Tsunami period.
4.1 Material and Methods
The present study was carried out between May 2006 to April 2007, in the coastal waters of
Kalpakkam in the vicinity of MAPS. The study area is located at the intake of MAPS Jetty.
Water depth at the study site is ~8 m. Teak wood panels (each 12 x 9 x 0.3 cm) were
suspended on epoxy coated mild steel frames from MAPS jetty. The panels were suspended
at 1 m below the lowest low water mark, approximately 400m away from the shoreline.
Three series of observations (weekly, monthly and cumulative at 30 d intervals) were made.
Weekly & monthly observations were considered under short-term observations and
cumulative was considered under long-term observation. Two unique features of this study
are, for the first time a) fouling data at an interval of 7d is available and b) photographs of
each series are digitally available for future comparison. Different evaluating parameters
viz. composition of organisms, number of organisms, growth rate, both % of number and %
of area coverage, biomass (g. per 100 sq. cm) were used to study the fouling pattern. Fouling
concentration was assessed by counting the foulants available on the panels. Total biomass
was calculated using a correction factor due to the absorption of water by the panels for
specified time periods. The growth rate was recorded by measuring the size of
macrofoulers. Apart from the above-mentioned parameters, diversity indices such as species
diversity (D), species richness (R) and evenness (J) were also calculated following Shannon-
Weaver (1963), Gleason (1922) and Pielou (1966).
4.2. Results
4.2.1. Fouling Community
A list of organisms collected from test panels are given in Table 1. The total number of taxa
involved in the fouling process at Kalpakkam coastal waters are found to be 30 during the
present investigation.
4.2.2. Biomass
Biomass values of weekly panels ranged from 1-11 g. per 100 sq. cm (Fig. 6a). The lowest
and highest biomass values for weekly panels were obtained in the months of November
and December respectively. In the monthly observation, the lowest (17 g. per 100 sq. cm)
and
the highest (46 g. per 100 sq. cm) were observed in April and November respectively (Fig.
6b). In case of cumulative panel, a steep increase in biomass was observed from 28 d (77 g.
per 100 sq. cm), 56 d (97 g. per 100 sq. cm), 112 d (185 g. per 100 sq. cm) to 150d (648 g. per
100 sq. cm) (Table 2) onwards.
4.2.3. Settlement pattern in short-term (weekly and monthly) panels
A wide variation was observed in the number of settled organisms on weekly panels. Major
fouling organisms observed were barnacles, hydroids, ascidians, oysters, sea anemones and
green mussels. In addition to these sedentary organisms, some epizoic animals like errant
polychaetes, flat worms, amphipods, crabs were also observed. Number of fouling
organisms, number of species and % of area coverage are given in Table 2.
Coelenterata
Campanulariidae Obelia bidontata Clarke
Obelia dichotoma Linnaeus
Clytia gracilis M.Sars
Aiptasiidae Aiptasia sp
Annelida
Nereidae Pseudonereis anomala Gravier
Platynereies sp
www.intechopen.com
Biofouling and its control in seawater cooled power plant cooling water system - a review 203
enhances the nutrient levels in the coastal water. Relatively low values are observed during pre-
monsoon and post- monsoon period (April-August) which is attributed to their utilization by
phytoplankton, as evident from the matching chlorophyll values during the same period.
Increased levels of phosphate is also observed during September which has been associated with
the phenomenon of upwelling, an event that generally occurs during pre-monsoon (August –
September) period along the Indian east coast (La Fond, 1957; De Souza et al., 1981; Ramaraju et
al., 1992; Suryanarayan and Rao, 1992).
4. Biofouling potential of Kalpakkam coastal waters
A close perusal of literature on biofouling studies point that they have been triggered
mainly based on two sound logics, such as scientific interest or technological need
associated with maritime activities. The methodology such as, size of panel, duration of
exposure, panel material, location of exposure etc used for biofouling studies largely remain
similar by many workers. Researchers with academic interest look for ecological succession,
species diversity, breeding pattern, seasonal variations, larval availability, climax
community, that is more towards qualitative assessment and linking them with
environmental factors. However, investigations with technological need look for
quantitative assessment such as, biomass, % of area coverage, density and occurrence
interval. Notwithstanding the interest driven by either, the three important parameters for
practical use undoubtedly are a) type of foulants, b) their growth rate and c) their seasonal
variations, which decides the use of an economic and environment-friendly fouling control
strategy. Biofouling problem is not only site specific, but also have been reported to be
different for two different power plants drawing same source of cooling water (Karande et
al., 1986), which has been attributed to different design and different material of use. An
evaluation of composition and abundance of the fouling communities available in coastal
waters provides an array of information particularly for the effective antifouling measures
to be adopted in the cooling water systems.
In order to devise an effective biofouling control measure for Prototype Fast Breeder Reactor
(under construction) cooling water system, it is essential to evaluate the present biofouling
potential at Kalpakkam coastal waters. Considering a big hiatus lapsed between the last
study (almost 20 years old) and the present need, a study was carried out with the following
objectives; to find out a) the present seasonal settlement pattern of biofoulers, dominant
species and breeding pattern, b) any change, as compared to that of earlier reported data
and c) the role of physico-chemical characteristics of coastal water on biofouling. Moreover,
this coast was severely affected by 2004 tsunami. Thus, the present study also brings out any
change in settlement pattern, diversity, biomass and population density between pre- and
post-Tsunami period.
4.1 Material and Methods
The present study was carried out between May 2006 to April 2007, in the coastal waters of
Kalpakkam in the vicinity of MAPS. The study area is located at the intake of MAPS Jetty.
Water depth at the study site is ~8 m. Teak wood panels (each 12 x 9 x 0.3 cm) were
suspended on epoxy coated mild steel frames from MAPS jetty. The panels were suspended
at 1 m below the lowest low water mark, approximately 400m away from the shoreline.
Three series of observations (weekly, monthly and cumulative at 30 d intervals) were made.
Weekly & monthly observations were considered under short-term observations and
cumulative was considered under long-term observation. Two unique features of this study
are, for the first time a) fouling data at an interval of 7d is available and b) photographs of
each series are digitally available for future comparison. Different evaluating parameters
viz. composition of organisms, number of organisms, growth rate, both % of number and %
of area coverage, biomass (g. per 100 sq. cm) were used to study the fouling pattern. Fouling
concentration was assessed by counting the foulants available on the panels. Total biomass
was calculated using a correction factor due to the absorption of water by the panels for
specified time periods. The growth rate was recorded by measuring the size of
macrofoulers. Apart from the above-mentioned parameters, diversity indices such as species
diversity (D), species richness (R) and evenness (J) were also calculated following Shannon-
Weaver (1963), Gleason (1922) and Pielou (1966).
4.2. Results
4.2.1. Fouling Community
A list of organisms collected from test panels are given in Table 1. The total number of taxa
involved in the fouling process at Kalpakkam coastal waters are found to be 30 during the
present investigation.
4.2.2. Biomass
Biomass values of weekly panels ranged from 1-11 g. per 100 sq. cm (Fig. 6a). The lowest
and highest biomass values for weekly panels were obtained in the months of November
and December respectively. In the monthly observation, the lowest (17 g. per 100 sq. cm)
and
the highest (46 g. per 100 sq. cm) were observed in April and November respectively (Fig.
6b). In case of cumulative panel, a steep increase in biomass was observed from 28 d (77 g.
per 100 sq. cm), 56 d (97 g. per 100 sq. cm), 112 d (185 g. per 100 sq. cm) to 150d (648 g. per
100 sq. cm) (Table 2) onwards.
4.2.3. Settlement pattern in short-term (weekly and monthly) panels
A wide variation was observed in the number of settled organisms on weekly panels. Major
fouling organisms observed were barnacles, hydroids, ascidians, oysters, sea anemones and
green mussels. In addition to these sedentary organisms, some epizoic animals like errant
polychaetes, flat worms, amphipods, crabs were also observed. Number of fouling
organisms, number of species and % of area coverage are given in Table 2.
Coelenterata
Campanulariidae Obelia bidontata Clarke
Obelia dichotoma Linnaeus
Clytia gracilis M.Sars
Aiptasiidae Aiptasia sp
Annelida
Nereidae Pseudonereis anomala Gravier
Platynereies sp
www.intechopen.com
Nuclear Power204
Serpulidae Serpula vermicularis Linnaeus
Hydroides norvegica Gunnerus
Sabelidae Daychone sp
Sabellistarte sp
Arthropoda
Pycnogonidae Pycnogonium indicum Sunder Raj
Balanidae Balanus amphitrite Darwin
Balanus reticulatus Utonomi
Balanus tintinnabulum Linnaeus
Balanus variegatus Darwin
Corophidae Corophium madrasensis Nayar
Corophium triaenonyx Stebbing
Amphithoidae Paragrubia vorax Chevreux
Ectoprocta
Membraniporidae Menbranipora sp
Electridae Electra sp
Acanthodesia sp
Mollusca
Mytilidae Perna viridis Linnaeus
Perna indica Kuriaose
Modiolus undulatus Dunker
Olividae Olivancillaria gibbosa Born
Ostreidae Crassostrea madrasensis Preston
Ostrea edulis
Saccostrea cucullata Born
Urochordata
Didemnidae Didemnum psammathodes Sluiter
Lissoclinum fragile Van Name
Table 1. List of fouling organisms observed on the test panels suspended in the Kalpakkam
coastal waters
The lowest and the highest numbers of foulants for weekly panels were 1 (November) and
136 per sq. cm (October) respectively (Fig. 6c). Fouling intensity was relatively high during
summer and SW monsoon period, whereas during NE monsoon period, negligible intensity
was observed. In monthly observation, the maximum (69 per sq. cm) and the minimum (12
per sq. cm) population density were obtained in September and January respectively (Fig.
6b). From July to September (SW monsoon) an increasing trend was observed, whereas from
October onwards (NE monsoon) the fouling intensity started declining. Once again after
January the fouling density was found to increase. This almost followed the salinity
variation pattern observed for this coastal water. The percentage (%) of area coverage on
weekly panels showed a well marked variation ranging between 0.08 and 100% (Fig. 6d),
whereas, in case of monthly observation, it was found to be 89 – 100%. In monthly
observation, maximum area coverage (100%) was found during July -August, November –
January and March (Fig. 6b). However, during weekly survey, maxima (80 - 100%) were
attained in August – September and November.
4.2.4. Variation in seasonal settlement of fouling organisms
Barnacle: Among the different groups, barnacles were found to be the most dominant
fouling community and its accumulation on the test panels was observed throughout the
year. During the present study period, barnacles were represented by four species such as,
Balanus amphitrite, B. tintinabulum, B. reticulatus and B. variegatus, which were found to be the
most dominant on weekly (12.4 - 99%) as well as monthly (5.9 – 85.2 %) panels. On weekly
panels, barnacle settlement was continuous with peaks observed during June-July and
November –March. In case of monthly panels, large numbers were observed during July,
November-December and March–April. During weekly and monthly observation maximum
growth (size) obtained were 0.5-1 mm and 2-3 mm respectively.
0
2
4
6
8
10
12
Ma
y
J
une
July
Aug
Sep
Oct
Nov
Dec
Jan
Fe
b
Mar
Apr
Month
Biomass values (g. per 100 sq. cm.)
0
10
20
30
40
50
J
u
l
A
ug
Sep
Oct
N
ov
D
e
c
J
a
n
Feb
Mar
Apr
Month
No. of organisms (x 10
3
per 230 sq. cm) and
Biomass (g/ 100 sq. cm)
80
84
88
92
96
100
104
Area coverage (%)
No.of Organisms
Biomass
% of Area Coverage
(a) weekly biomass (b) monthly all three parameters
0
5
10
15
20
25
30
35
M
a
y
June
Ju
l
y
Au
g
Se
p
O
ct
Nov
De
c
Ja
n
F
eb
Mar
Ap
r
Month
N o . of Bio fo u ling O r gani sm s
(x 10
3
p e r 2 30 sq. c m )
0
20
40
60
80
100
120
May
June
J
u
ly
A
u
g
S
e
p
O
ct
N
ov
D
ec
Ja
n
Feb
Mar
A
p
r
Month
% of Area Coverage
(c) weekly no. of organisms (d) weekly area coverage
Fig. 6. Variations in no. of organisms, biomass and % of area coverage on weekly and
monthly panels
Hydroids: Hydroids were only second to barnacles in abundance as well as seasonal
occurrence and were dominated by Obelia sp. They started appearing on the panels after 5d
immersion. The growth of hydroids was recorded by measuring the length from base to tip.
A maximum length of 5 mm on weekly panel and 17 mm on monthly panel was observed.
Its % composition varied between 0.64 & 81.62 % and 1.66 & 37.28 % during weekly and
monthly investigation respectively.
Ascidians: Didemnum psammathodes and Lissoclinum fragile were the ascidian species
encountered during the present observation. In the weekly observation, the occurrence of
www.intechopen.com
Biofouling and its control in seawater cooled power plant cooling water system - a review 205
Serpulidae Serpula vermicularis Linnaeus
Hydroides norvegica Gunnerus
Sabelidae Daychone sp
Sabellistarte sp
Arthropoda
Pycnogonidae Pycnogonium indicum Sunder Raj
Balanidae Balanus amphitrite Darwin
Balanus reticulatus Utonomi
Balanus tintinnabulum Linnaeus
Balanus variegatus Darwin
Corophidae Corophium madrasensis Nayar
Corophium triaenonyx Stebbing
Amphithoidae Paragrubia vorax Chevreux
Ectoprocta
Membraniporidae Menbranipora sp
Electridae Electra sp
Acanthodesia sp
Mollusca
Mytilidae Perna viridis Linnaeus
Perna indica Kuriaose
Modiolus undulatus Dunker
Olividae Olivancillaria gibbosa Born
Ostreidae Crassostrea madrasensis Preston
Ostrea edulis
Saccostrea cucullata Born
Urochordata
Didemnidae Didemnum psammathodes Sluiter
Lissoclinum fragile Van Name
Table 1. List of fouling organisms observed on the test panels suspended in the Kalpakkam
coastal waters
The lowest and the highest numbers of foulants for weekly panels were 1 (November) and
136 per sq. cm (October) respectively (Fig. 6c). Fouling intensity was relatively high during
summer and SW monsoon period, whereas during NE monsoon period, negligible intensity
was observed. In monthly observation, the maximum (69 per sq. cm) and the minimum (12
per sq. cm) population density were obtained in September and January respectively (Fig.
6b). From July to September (SW monsoon) an increasing trend was observed, whereas from
October onwards (NE monsoon) the fouling intensity started declining. Once again after
January the fouling density was found to increase. This almost followed the salinity
variation pattern observed for this coastal water. The percentage (%) of area coverage on
weekly panels showed a well marked variation ranging between 0.08 and 100% (Fig. 6d),
whereas, in case of monthly observation, it was found to be 89 – 100%. In monthly
observation, maximum area coverage (100%) was found during July -August, November –
January and March (Fig. 6b). However, during weekly survey, maxima (80 - 100%) were
attained in August – September and November.
4.2.4. Variation in seasonal settlement of fouling organisms
Barnacle: Among the different groups, barnacles were found to be the most dominant
fouling community and its accumulation on the test panels was observed throughout the
year. During the present study period, barnacles were represented by four species such as,
Balanus amphitrite, B. tintinabulum, B. reticulatus and B. variegatus, which were found to be the
most dominant on weekly (12.4 - 99%) as well as monthly (5.9 – 85.2 %) panels. On weekly
panels, barnacle settlement was continuous with peaks observed during June-July and
November –March. In case of monthly panels, large numbers were observed during July,
November-December and March–April. During weekly and monthly observation maximum
growth (size) obtained were 0.5-1 mm and 2-3 mm respectively.
0
2
4
6
8
10
12
Ma
y
J
une
July
Aug
Sep
Oct
Nov
Dec
Jan
Fe
b
Mar
Apr
Month
Biomass values (g. per 100 sq. cm.)
0
10
20
30
40
50
J
u
l
A
ug
Sep
Oct
N
ov
D
e
c
J
a
n
Feb
Mar
Apr
Month
No. of organisms (x 10
3
per 230 sq. cm) and
Biomass (g/ 100 sq. cm)
80
84
88
92
96
100
104
Area coverage (%)
No.of Organisms
Biomass
% of Area Coverage
(a) weekly biomass (b) monthly all three parameters
0
5
10
15
20
25
30
35
M
a
y
June
Ju
l
y
Au
g
Se
p
O
ct
Nov
De
c
Ja
n
F
eb
Mar
Ap
r
Month
N o . of Bio fo u ling O r gani sm s
(x 10
3
p e r 2 30 sq. c m )
0
20
40
60
80
100
120
May
June
J
u
ly
A
u
g
S
e
p
O
ct
N
ov
D
ec
Ja
n
Feb
Mar
A
p
r
Month
% of Area Coverage
(c) weekly no. of organisms (d) weekly area coverage
Fig. 6. Variations in no. of organisms, biomass and % of area coverage on weekly and
monthly panels
Hydroids: Hydroids were only second to barnacles in abundance as well as seasonal
occurrence and were dominated by Obelia sp. They started appearing on the panels after 5d
immersion. The growth of hydroids was recorded by measuring the length from base to tip.
A maximum length of 5 mm on weekly panel and 17 mm on monthly panel was observed.
Its % composition varied between 0.64 & 81.62 % and 1.66 & 37.28 % during weekly and
monthly investigation respectively.
Ascidians: Didemnum psammathodes and Lissoclinum fragile were the ascidian species
encountered during the present observation. In the weekly observation, the occurrence of
www.intechopen.com
Nuclear Power206
ascidians was generally restricted to March-April and June – August, with peak settlement
during March-April. Monthly observation also depicted the dominance of ascidians during
March-April and June-July, but with maximum density during June.
Sea anemones: Sea anemones, also a prominent group among the fouling assemblages,
were represented by Sertularia sp., Aiptasia sp. in both weekly as well as monthly
observations. They were found settling from Sepetember/ October onwards and formed a
group particularly abundant during NE monsoon period. Their rate of growth was 1.5 mm
diameter in 7 d and 8 mm diameter in 30 d observation and the settlement was relatively
less during SW monsoon period.
Green Mussels: Green mussels (Perna viridis) were the most important constituent of the
fouling community. They were mostly found attached to the mild steel frames during short-
term investigation and their absence was encountered during the entire weekly observation.
However, during monthly survey, their % composition varied from 0.08 – 11.02 % and their
colonization was generally observed during May-September with vigorous settlement
during May-June and August – September.
4.2.5. Seasonal settlement on long -term (cumulative) panels
During the present observation, long -term panels were studied up to 150 days after which
panels were lost due to entanglement of the frames and could not be retrieved. In the
Kalpakkam coastal waters considerable settlement of barnacles, green mussels and ascidians
were observed on the long-term panels. Apart from that, colonization of hydroids, oysters
and sea anemones was also observed on the long-term panels. In addition to these sedentary
organisms, epizoic animals like errant polychaetes, flat worms, amphipods, crabs were also
observed. Peak settlement period of foulants, succession and climax community are
represented in Table 2. Fouling succession was very prominent during the long-term
observation as compared to weekly and monthly observation. Barnacles were the first to
settle on the long-term panels and by the time they were of 14 mm in size, they were
followed by hydroids and polychaete worms during the month of May. During this period,
barnacle population remained largely unaffected by the secondary settlers. Ascidians began
to colonize on the panels from June. Fully developed ascidian colonies completely covered
the barnacles and other organisms by July and they remained till the end of August.
Disappearance of ascidians was noticed from the month of September. Green mussels
started appearing from August, whereas the peak colonization of mussels was observed
from September onwards and it was maintained till mid-November.
Percentage composition of barnacles initially increased upto 56 d and subsequently reduced
significantly on the long-term panels as follows (15%, 28%, 13% and 5% on 28 d, 56 d, 112 d
and 150 d old panel respectively). Green mussel, which was absent upto 28 days, started
appearing subsequently and occupied 41% by 56d and reached 90% by 150d. Accumulation
of juvenile green mussels occurred after 28 days along with the pre-existing community
consisting of barnacles, hydroids, oysters, polychaete worms, flat worms & sea anemones.
The mussels attained 0.5-1 cm in size by 56 d and from 112 d onwards, the panels were fully
covered with adult green mussels of size 3 - 5 cm. (Fig. 7). The relative abundance of fouling
community observed for 28 d, 56 d, 112 d and 150d are given in Fig. 8.
Nair et al. , 1988 Sashikumar et al., 1989 Sashikumar et al.,
1990
Rajagopal et
al., 1997
Present study
W
eekly Monthly Cumulative
No. of organisms
(x 10
3
per 230 sq. cm)
(0.185-29) x10
3
(2 –15) x 10
3
(0.166– 63) x10
3
No. of species
21 105 30
% of Area coverage
62 (Dec.)–100% (Jul Au
g
)
- Monthy
53 (Nov.)-100%
(Apr.,Jul & Aug.)
- Monthy
34 (Feb.)–72%
(Oct.)-Monthy
0.08 (Nov. )-100
% (Aug.)
89 (Oct.)–100%
(Jul./Aug.)
100%
Biomass
(g/ 100 sq. cm)
43 d -33;128d – 52;
150 d– 135
56d -90;120d –105;
150d –1000
45d – 32; 60d – 52;
130d– 50; 160d –
138
56d –750; 125d
-1870;
150d – 1750
1 –11
17 – 46
28d - 77; 56d -97;
112d –185; 150- 648
Peak settlement
Barnacles
(Mar Jul.)
Hydroides
(Feb. – Aug.)
Ascidians- May
Sea anemone
(Sep. – Oct.)
green mussels–
September onwards
Barnacles
(throughout the year)
Hydroides
(Feb. – Nov.)
Ascidians
(Mar. –Aug.)
Sea anemone –
NE monsoon
Barnacles
(Throughout the
year)
Hydroides
(Mar. –Apr. & Sep.)
Ascidians
(Apr. - Aug.)
Sea anemone
(Feb. - Oct.)
Barnacles
(throughout
the year)
Green mussels
(Apr. – Aug.)
Barnacles
(Mar. – Jul.)
Green Mussel
(Perna viridis)-
(Sep Nov.)
Diversity indices
SD
SR
E
1.21(125d)–1.69
(75d)
0.04(150d) -
0.11(65d)
SD (0.05-0.96)
SR(0.11–0.69)
E (0.08 – 0.99)
SD(0.5-1.55)
SR(0.45-1.0)
E (0.26-0.74)
0.43(150d) –1.60(56d)
0.36(150d) –0.80(56d)
0.31(150d) –0.73(56d)
Succession
Barnacles, hydroides
sea anemone, ascidians,
green mussels
Barnacles, hydroides
ascidians,
sea anemone,
green mussels
Barnacles,
hydroides,
ascidians,
sea anemones,
green mussels
Barnacles,
ascidians,
green mussels
Barnacles, hydroides,
sea anemone,
Ascidians,
green mussels
Climax community
Barnacles Green Mussel
(Perna viridis)
Ascidians Green Mussel
(Perna viridis)
Green mussels
Table 2. Comparison of present fouling data with earlier reported values
www.intechopen.com
Biofouling and its control in seawater cooled power plant cooling water system - a review 207
ascidians was generally restricted to March-April and June – August, with peak settlement
during March-April. Monthly observation also depicted the dominance of ascidians during
March-April and June-July, but with maximum density during June.
Sea anemones: Sea anemones, also a prominent group among the fouling assemblages,
were represented by Sertularia sp., Aiptasia sp. in both weekly as well as monthly
observations. They were found settling from Sepetember/ October onwards and formed a
group particularly abundant during NE monsoon period. Their rate of growth was 1.5 mm
diameter in 7 d and 8 mm diameter in 30 d observation and the settlement was relatively
less during SW monsoon period.
Green Mussels: Green mussels (Perna viridis) were the most important constituent of the
fouling community. They were mostly found attached to the mild steel frames during short-
term investigation and their absence was encountered during the entire weekly observation.
However, during monthly survey, their % composition varied from 0.08 – 11.02 % and their
colonization was generally observed during May-September with vigorous settlement
during May-June and August – September.
4.2.5. Seasonal settlement on long -term (cumulative) panels
During the present observation, long -term panels were studied up to 150 days after which
panels were lost due to entanglement of the frames and could not be retrieved. In the
Kalpakkam coastal waters considerable settlement of barnacles, green mussels and ascidians
were observed on the long-term panels. Apart from that, colonization of hydroids, oysters
and sea anemones was also observed on the long-term panels. In addition to these sedentary
organisms, epizoic animals like errant polychaetes, flat worms, amphipods, crabs were also
observed. Peak settlement period of foulants, succession and climax community are
represented in Table 2. Fouling succession was very prominent during the long-term
observation as compared to weekly and monthly observation. Barnacles were the first to
settle on the long-term panels and by the time they were of 14 mm in size, they were
followed by hydroids and polychaete worms during the month of May. During this period,
barnacle population remained largely unaffected by the secondary settlers. Ascidians began
to colonize on the panels from June. Fully developed ascidian colonies completely covered
the barnacles and other organisms by July and they remained till the end of August.
Disappearance of ascidians was noticed from the month of September. Green mussels
started appearing from August, whereas the peak colonization of mussels was observed
from September onwards and it was maintained till mid-November.
Percentage composition of barnacles initially increased upto 56 d and subsequently reduced
significantly on the long-term panels as follows (15%, 28%, 13% and 5% on 28 d, 56 d, 112 d
and 150 d old panel respectively). Green mussel, which was absent upto 28 days, started
appearing subsequently and occupied 41% by 56d and reached 90% by 150d. Accumulation
of juvenile green mussels occurred after 28 days along with the pre-existing community
consisting of barnacles, hydroids, oysters, polychaete worms, flat worms & sea anemones.
The mussels attained 0.5-1 cm in size by 56 d and from 112 d onwards, the panels were fully
covered with adult green mussels of size 3 - 5 cm. (Fig. 7). The relative abundance of fouling
community observed for 28 d, 56 d, 112 d and 150d are given in Fig. 8.
Nair et al. , 1988 Sashikumar et al., 1989 Sashikumar et al.,
1990
Rajagopal et
al., 1997
Present study
W
eekly Monthly Cumulative
No. of organisms
(x 10
3
per 230 sq. cm)
(0.185-29) x10
3
(2 –15) x 10
3
(0.166– 63) x10
3
No. of species
21 105 30
% of Area coverage
62 (Dec.)–100% (Jul Au
g
)
- Monthy
53 (Nov.)-100%
(Apr.,Jul & Aug.)
- Monthy
34 (Feb.)–72%
(Oct.)-Monthy
0.08 (Nov. )-100
% (Aug.)
89 (Oct.)–100%
(Jul./Aug.)
100%
Biomass
(g/ 100 sq. cm)
43 d -33;128d – 52;
150 d– 135
56d -90;120d –105;
150d –1000
45d – 32; 60d – 52;
130d– 50; 160d –
138
56d –750; 125d
-1870;
150d – 1750
1 –11
17 – 46
28d - 77; 56d -97;
112d –185; 150- 648
Peak settlement
Barnacles
(Mar Jul.)
Hydroides
(Feb. – Aug.)
Ascidians- May
Sea anemone
(Sep. – Oct.)
green mussels–
September onwards
Barnacles
(throughout the year)
Hydroides
(Feb. – Nov.)
Ascidians
(Mar. –Aug.)
Sea anemone –
NE monsoon
Barnacles
(Throughout the
year)
Hydroides
(Mar. –Apr. & Sep.)
Ascidians
(Apr. - Aug.)
Sea anemone
(Feb. - Oct.)
Barnacles
(throughout
the year)
Green mussels
(Apr. – Aug.)
Barnacles
(Mar. – Jul.)
Green Mussel
(Perna viridis)-
(Sep Nov.)
Diversity indices
SD
SR
E
1.21(125d)–1.69
(75d)
0.04(150d) -
0.11(65d)
SD (0.05-0.96)
SR(0.11–0.69)
E (0.08 – 0.99)
SD(0.5-1.55)
SR(0.45-1.0)
E (0.26-0.74)
0.43(150d) –1.60(56d)
0.36(150d) –0.80(56d)
0.31(150d) –0.73(56d)
Succession
Barnacles, hydroides
sea anemone, ascidians,
green mussels
Barnacles, hydroides
ascidians,
sea anemone,
green mussels
Barnacles,
hydroides,
ascidians,
sea anemones,
green mussels
Barnacles,
ascidians,
green mussels
Barnacles, hydroides,
sea anemone,
Ascidians,
green mussels
Climax community
Barnacles Green Mussel
(Perna viridis)
Ascidians Green Mussel
(Perna viridis)
Green mussels
Table 2. Comparison of present fouling data with earlier reported values
www.intechopen.com
Nuclear Power208
4.3. Discussions
4.3.1. Fouling Community
During the present investigation, the total number of fouling organism taxa observed at
Kalpakkam coastal waters was 30, which is comparable with that of the observation of
Sashikumar et al. (1989). However, Sashikumar et al. (1989) have observed presence of a few
species of fishes, which were not encountered during the present study. Change in coastal
water quality particularly the chlorophyll content may be one of the possible causes for such
minor difference in fouling community. In contrast to the above, Rajagopal et al. (1997) have
reported almost 3.5 times higher number of fouling species (105) than that of ours as well as
that of Sashikumar et al. (1989) from the same location. In this regard, it is imperative to
mention here that values with wide variations have been reported from both east and west
coast of India. For example, 121 taxa from Visakhapatnam harbour, 37 taxa from Kakinada
(Rao and Balaji, 1988), 42 taxa from Goa (Anil and Wagh, 1988) and 65 taxa from Cochin
harbour (Nair and Nair, 1987) have been reported respectively. It is interesting to mention
here that although Sashikumar et al. (1989) and Rajagopal et al. (1997) have studied from
same location and during the same period, the no. of taxa observed by them differ
substantially. Conveniently, Rajagopal et al. (1997) have neither discussed this aspect nor
provided any plausible explanation for observation of such high no. of taxa as compared to
that of Sashikumar et al. (1989).
(a) (b) (c)
Fig. 7. A view of a weekly panel (a) A view of a monthly panel (b) A view of 112 d old panel,
covered with green mussels (c)
15%
14%
56%
2%
12%
1%
Barnacles
Mussels
Polychaete
worms
Oysters
Hydroids
Flat worms
41%
27%
1%
10%
2%
10%
5%
2%
2%
Barnacles
Mussels
Polychaete
worms
Oysters
Sea
anemones
Flat worms
Hydroids
Ascidians
Crabs
(a) 28d (b) 56d
13%
3%
84%
Barnacles
Mussels
Polychaete
worms
90%
5%
2%
3%
Barnacles
Mussels
Sea
anemones
Hydroids
(c) 112d (d) 150d
Fig. 8. Relative abundance of fouling organisms for (a) 28 d, (b) 56 d, (c) 112 and (d) 150d old
panels exposed to Kalpakkam coastal waters
Although, direct comparison of the present observation with that of the earlier data is not
justified on account of reasons, such as, differences in the exposure methodology,
substratum and level of systematic identification, however, such wide variations as above
observed by the three investigators (Present study, Rajagopal et al., 1997 and Sashikumar et
al., 1989) from the same location under comparable conditions calls for further detailed
investigations.
4.3.2. Seasonal settlement pattern on short-term (weekly and monthly) observation
The seasonal settlement of foulants in case of short-term panels was found to be quite different
from that of the long-term panels, as described in the following discussion. The weekly panels
showed well marked variation in population density of organisms. The lowest density was
found during NE monsoon period, which could be due to the lowering of salinity level in the
surface water during the above period. It is important to mention here that about 1000 mm of
rainfall is received at Kalpakkam from NE monsoon. Moreover, with the onset of NE monsoon,
the sea water current reverses from north to south as a result of which low saline riverine water
from northern Bay of Bengal (BOB) (Varkey et al., 1996) coupled with the monsoonal
precipitation deepens the salinity to the lowest during this period. It is known that salinity plays
a crucial role in the growth, development and diversity of macro-foulants in the marine
environment. Additionally, a relatively low temperature, which is not favorable for biogrowth
was also prevailed during this period. It looks quite reasonable to speculate that substantial
reduction in salinity and temperature along with enhanced suspended matter prevailed during
NE monsoon period could have contributed for the low fouling density as well as low species
diversity observed during this period. A relatively high fouling intensity on weekly panel was
observed during summer and SW monsoon period. During this period, a comparatively high
stable salinity, temperature and low turbidity prevailed, which is in general conducive for
promoting large settlement of macrofoulants. This period also harvested highest number of
phytoplankton count in this locality. The above observation was also substantiated by the
positive correlation matrix value obtained between salinity & fouling density (p≥ 0.01) and
chlorophyll/ phytoplankton density & organism density (p≥ 0.001) (Table 3). This showed that
abundance of fouling organism at this locality was regulated mainly by two important factors
namely, salinity and phytoplankton. Previous studies (Nair et al., 1988) showed peak settlement
www.intechopen.com
Biofouling and its control in seawater cooled power plant cooling water system - a review 209
4.3. Discussions
4.3.1. Fouling Community
During the present investigation, the total number of fouling organism taxa observed at
Kalpakkam coastal waters was 30, which is comparable with that of the observation of
Sashikumar et al. (1989). However, Sashikumar et al. (1989) have observed presence of a few
species of fishes, which were not encountered during the present study. Change in coastal
water quality particularly the chlorophyll content may be one of the possible causes for such
minor difference in fouling community. In contrast to the above, Rajagopal et al. (1997) have
reported almost 3.5 times higher number of fouling species (105) than that of ours as well as
that of Sashikumar et al. (1989) from the same location. In this regard, it is imperative to
mention here that values with wide variations have been reported from both east and west
coast of India. For example, 121 taxa from Visakhapatnam harbour, 37 taxa from Kakinada
(Rao and Balaji, 1988), 42 taxa from Goa (Anil and Wagh, 1988) and 65 taxa from Cochin
harbour (Nair and Nair, 1987) have been reported respectively. It is interesting to mention
here that although Sashikumar et al. (1989) and Rajagopal et al. (1997) have studied from
same location and during the same period, the no. of taxa observed by them differ
substantially. Conveniently, Rajagopal et al. (1997) have neither discussed this aspect nor
provided any plausible explanation for observation of such high no. of taxa as compared to
that of Sashikumar et al. (1989).
(a) (b) (c)
Fig. 7. A view of a weekly panel (a) A view of a monthly panel (b) A view of 112 d old panel,
covered with green mussels (c)
15%
14%
56%
2%
12%
1%
Barnacles
Mussels
Polychaete
worms
Oysters
Hydroids
Flat worms
41%
27%
1%
10%
2%
10%
5%
2%
2%
Barnacles
Mussels
Polychaete
worms
Oysters
Sea
anemones
Flat worms
Hydroids
Ascidians
Crabs
(a) 28d (b) 56d
13%
3%
84%
Barnacles
Mussels
Polychaete
worms
90%
5%
2%
3%
Barnacles
Mussels
Sea
anemones
Hydroids
(c) 112d (d) 150d
Fig. 8. Relative abundance of fouling organisms for (a) 28 d, (b) 56 d, (c) 112 and (d) 150d old
panels exposed to Kalpakkam coastal waters
Although, direct comparison of the present observation with that of the earlier data is not
justified on account of reasons, such as, differences in the exposure methodology,
substratum and level of systematic identification, however, such wide variations as above
observed by the three investigators (Present study, Rajagopal et al., 1997 and Sashikumar et
al., 1989) from the same location under comparable conditions calls for further detailed
investigations.
4.3.2. Seasonal settlement pattern on short-term (weekly and monthly) observation
The seasonal settlement of foulants in case of short-term panels was found to be quite different
from that of the long-term panels, as described in the following discussion. The weekly panels
showed well marked variation in population density of organisms. The lowest density was
found during NE monsoon period, which could be due to the lowering of salinity level in the
surface water during the above period. It is important to mention here that about 1000 mm of
rainfall is received at Kalpakkam from NE monsoon. Moreover, with the onset of NE monsoon,
the sea water current reverses from north to south as a result of which low saline riverine water
from northern Bay of Bengal (BOB) (Varkey et al., 1996) coupled with the monsoonal
precipitation deepens the salinity to the lowest during this period. It is known that salinity plays
a crucial role in the growth, development and diversity of macro-foulants in the marine
environment. Additionally, a relatively low temperature, which is not favorable for biogrowth
was also prevailed during this period. It looks quite reasonable to speculate that substantial
reduction in salinity and temperature along with enhanced suspended matter prevailed during
NE monsoon period could have contributed for the low fouling density as well as low species
diversity observed during this period. A relatively high fouling intensity on weekly panel was
observed during summer and SW monsoon period. During this period, a comparatively high
stable salinity, temperature and low turbidity prevailed, which is in general conducive for
promoting large settlement of macrofoulants. This period also harvested highest number of
phytoplankton count in this locality. The above observation was also substantiated by the
positive correlation matrix value obtained between salinity & fouling density (p≥ 0.01) and
chlorophyll/ phytoplankton density & organism density (p≥ 0.001) (Table 3). This showed that
abundance of fouling organism at this locality was regulated mainly by two important factors
namely, salinity and phytoplankton. Previous studies (Nair et al., 1988) showed peak settlement
www.intechopen.com
Nuclear Power210
rates during May and June, whereas during the present study, an extension of this period up to
September – October was observed. The present variation as compared to earlier could be due to
the temporal variability in reproductive cycles, which was related either directly or indirectly to
seasonal changes in the physical environment including temperature, salinity, phytoplankton
productivity and light characteristics (Sashikumar et al., 1989). A close look at the present
physico-chemical and biological characteristics of the Kalpakkam coastal water reveals
substantial reduction in phytoplankton density, chlorophyll concentration and enhancement in
suspended matter including that of nutrient in the recent past particularly after Tsunami
(Satpathy et al., 2008). A detailed impact of Tsunami on the coastal milieu is reported elsewhere
(Satpathy et al., 2008). Possibly these changes are also typified in the change in macrofoulant
settlement pattern as observed during the present study. A significant difference was observed
between successive weeks (Fig. 9), with respect to number of foulers, % of area coverage, growth
rate etc. The selection pressure exerted by the ambiance itself on the recruitment of fouling
organisms could be responsible for the above observation. In this context Sutherland (1981) states
that, in natural habitats development of a fouling community is influenced by seasonal variations
in larval recruitment, competition by dominant species and frequency of disturbance like
predation. The variation in fouling density pattern in monthly panel almost followed the
variability in salinity trend, which strengthened the fact that salinity is one of the major
dominating factors responsible for fouling composition or settlement in the tropical coastal
regions.
Variables
No of
organisms Biomass
% Area
coverage Temp pH Salinity DO Turbidity Chl- a
Phyto
density
No of
organisms
1
Biomass 0.359
1
% Area
coverage
0.504
b
0.518
b
1
Temp 0.197 -0.271 -0.292
1
pH -0.023
-0.475
b
-0.432
b
0.116
1
Salinity
0.515
b
0.047
0.452
b
0.195 -0.325
1
DO -0.160 -0.004 -0.128
-0.381
c
0.119
-0.430
b
1
Turbidity -0.090 -0.065
0.445
b
-0.307 -0.150 0.073 -0.276
1
Chl- a
0.458
b
-0.098
0.502
b
-0.016 -0.259
0.685
a
-0.332
0.423
b
1
Phyto
density
0.442
b
0.139
0.465
b
-0.196 -0.264
0.547
a
-0.145 0.355
0.839
a
1
a-p ≥ 0.001; b- p ≥ 0.01; c- p ≥ 0.05
Table 3. Correlation between biofouling and hydrographical parameters
November (NE monsoon period) coincided with low intensity of biofouling for monthly and
cumulative; however, % of area coverage was found to be the highest during one of the weeks in
November. Although, the highest % coverage was observed during NE monsoon, a period of
low salinity, however, both these parameters are positively correlated. Similarly, turbidity and %
of area coverage showed a positive correlation, in spite of the fact that high turbidity generally
does not support abundant settlement. This contradiction can be argued out that, the period of
low salinity and high turbidity was not favorable for settlement of most of the organisms. That is,
the competition was almost nil and only organisms (barnacle and mussel), which can thrive well
under the above environmental conditions grew fast and covered the entire area indicating a
significant relationship between salinity and turbidity with % of area coverage (Iwaki & Hattori,
1987). Considering the fact that no weekly data was available from this location, this forms the
benchmark for future reference as well as impact studies.
From 8
th
- 15
th
June, 2006 From 15
th
- 22
nd
June, 2006
Fig. 9. Variations in fouling pattern observed on the test panels between two successive
weeks
4.3.3. Variations in seasonal settlement of fouling organisms
Barnacles: Among the different groups of fouling organisms, barnacles are reported to be
the most important group and all time breeders (Godwin, 1980; Nair et al., 1988). In the
present study also, barnacles were found to be the most dominant fouler and its presence
found throughout the year. Nair et al. (1988) and Sashikumar et al. (1990) have also reported
the settlement of barnacles throughout the year at this location during the period 1986-87.
On weekly panels, settlement was continuous with peaks during June-July and from
November –March. Settlement of barnacle is known to be favored in illuminated area
(Brankevich et al., 1988; Sashikumar et al.,1989; Rajagopal et al., 1997), notwithstanding the
contradictory observation of Dahlem et al. (1984) and Venugopalan (1987). Considering the
fact that southeast coast of India receives good illumination throughout the year, it is
appropriate to assume from the present as well as earlier data that this would have
supported the settlement of barnacle throughout the year on the test panel. In case of
monthly panels, large numbers were observed during July, November-December and
March–April. Although fouling density was high during September/ October, barnacle
population was found to be the lowest in September. Settled green mussels (Perna viridis)
prior to September established their dominance on the panel surface by September/
October, thereby not facilitating further settlement by barnacles. This could be the possible
reason for relatively low settlement of barnacles during September. Dominance of other
foulants over barnacles resulting in their population reduction has also been reported by
Nelson (1981) on natural substrates. Territorial behavior of barnacles could also be another
important cause of its population reduction during a particular period of the present
investigation. It is reported that newly settled barnacles maintain a distance of ~2 mm from
the earlier settled barnacles or other settling organisms, which is known as ‘Territorial
behaviour’ of barnacles (Crisp, 1961). As fouling density rises, the territorial separation gets
weakened and as a consequence barnacle mass gets reduced (Crisp, 1961). The settlement
pattern of barnacles during the present study showed similarity with the previous studies
www.intechopen.com
Biofouling and its control in seawater cooled power plant cooling water system - a review 211
rates during May and June, whereas during the present study, an extension of this period up to
September – October was observed. The present variation as compared to earlier could be due to
the temporal variability in reproductive cycles, which was related either directly or indirectly to
seasonal changes in the physical environment including temperature, salinity, phytoplankton
productivity and light characteristics (Sashikumar et al., 1989). A close look at the present
physico-chemical and biological characteristics of the Kalpakkam coastal water reveals
substantial reduction in phytoplankton density, chlorophyll concentration and enhancement in
suspended matter including that of nutrient in the recent past particularly after Tsunami
(Satpathy et al., 2008). A detailed impact of Tsunami on the coastal milieu is reported elsewhere
(Satpathy et al., 2008). Possibly these changes are also typified in the change in macrofoulant
settlement pattern as observed during the present study. A significant difference was observed
between successive weeks (Fig. 9), with respect to number of foulers, % of area coverage, growth
rate etc. The selection pressure exerted by the ambiance itself on the recruitment of fouling
organisms could be responsible for the above observation. In this context Sutherland (1981) states
that, in natural habitats development of a fouling community is influenced by seasonal variations
in larval recruitment, competition by dominant species and frequency of disturbance like
predation. The variation in fouling density pattern in monthly panel almost followed the
variability in salinity trend, which strengthened the fact that salinity is one of the major
dominating factors responsible for fouling composition or settlement in the tropical coastal
regions.
Variables
No of
organisms Biomass
% Area
coverage Temp pH Salinity DO Turbidity Chl- a
Phyto
density
No of
organisms
1
Biomass 0.359
1
% Area
coverage
0.504
b
0.518
b
1
Temp 0.197 -0.271 -0.292
1
pH -0.023
-0.475
b
-0.432
b
0.116
1
Salinity
0.515
b
0.047
0.452
b
0.195 -0.325
1
DO -0.160 -0.004 -0.128
-0.381
c
0.119
-0.430
b
1
Turbidity -0.090 -0.065
0.445
b
-0.307 -0.150 0.073 -0.276
1
Chl- a
0.458
b
-0.098
0.502
b
-0.016 -0.259
0.685
a
-0.332
0.423
b
1
Phyto
density
0.442
b
0.139
0.465
b
-0.196 -0.264
0.547
a
-0.145 0.355
0.839
a
1
a-p ≥ 0.001; b- p ≥ 0.01; c- p ≥ 0.05
Table 3. Correlation between biofouling and hydrographical parameters
November (NE monsoon period) coincided with low intensity of biofouling for monthly and
cumulative; however, % of area coverage was found to be the highest during one of the weeks in
November. Although, the highest % coverage was observed during NE monsoon, a period of
low salinity, however, both these parameters are positively correlated. Similarly, turbidity and %
of area coverage showed a positive correlation, in spite of the fact that high turbidity generally
does not support abundant settlement. This contradiction can be argued out that, the period of
low salinity and high turbidity was not favorable for settlement of most of the organisms. That is,
the competition was almost nil and only organisms (barnacle and mussel), which can thrive well
under the above environmental conditions grew fast and covered the entire area indicating a
significant relationship between salinity and turbidity with % of area coverage (Iwaki & Hattori,
1987). Considering the fact that no weekly data was available from this location, this forms the
benchmark for future reference as well as impact studies.
From 8
th
- 15
th
June, 2006 From 15
th
- 22
nd
June, 2006
Fig. 9. Variations in fouling pattern observed on the test panels between two successive
weeks
4.3.3. Variations in seasonal settlement of fouling organisms
Barnacles: Among the different groups of fouling organisms, barnacles are reported to be
the most important group and all time breeders (Godwin, 1980; Nair et al., 1988). In the
present study also, barnacles were found to be the most dominant fouler and its presence
found throughout the year. Nair et al. (1988) and Sashikumar et al. (1990) have also reported
the settlement of barnacles throughout the year at this location during the period 1986-87.
On weekly panels, settlement was continuous with peaks during June-July and from
November –March. Settlement of barnacle is known to be favored in illuminated area
(Brankevich et al., 1988; Sashikumar et al.,1989; Rajagopal et al., 1997), notwithstanding the
contradictory observation of Dahlem et al. (1984) and Venugopalan (1987). Considering the
fact that southeast coast of India receives good illumination throughout the year, it is
appropriate to assume from the present as well as earlier data that this would have
supported the settlement of barnacle throughout the year on the test panel. In case of
monthly panels, large numbers were observed during July, November-December and
March–April. Although fouling density was high during September/ October, barnacle
population was found to be the lowest in September. Settled green mussels (Perna viridis)
prior to September established their dominance on the panel surface by September/
October, thereby not facilitating further settlement by barnacles. This could be the possible
reason for relatively low settlement of barnacles during September. Dominance of other
foulants over barnacles resulting in their population reduction has also been reported by
Nelson (1981) on natural substrates. Territorial behavior of barnacles could also be another
important cause of its population reduction during a particular period of the present
investigation. It is reported that newly settled barnacles maintain a distance of ~2 mm from
the earlier settled barnacles or other settling organisms, which is known as ‘Territorial
behaviour’ of barnacles (Crisp, 1961). As fouling density rises, the territorial separation gets
weakened and as a consequence barnacle mass gets reduced (Crisp, 1961). The settlement
pattern of barnacles during the present study showed similarity with the previous studies
www.intechopen.com
Nuclear Power212
reported from coastal waters of southeast coast of India (Nair et al., 1988; Rajagopal et al.,
1997). In contrast to the present study as well as that of Nair et al. (1988) and Rajagopal et al.
(1997), relatively low barnacle population during June-July has been reported by
Sashikumar et al. (1989). This disparity among different studies as far as peak settlement
period of organisms is concerned, could be attributed to the variation in the influence of
environmental parameters on breeding cycle of the organisms. The above agreement is
strengthened by the fact that effect of array of environmental variables on reproduction
cycle of different organisms greatly differs (Sutherland, 1981). Rajagopal et al. (1997) have
reported six species of barnacle as against four observed by us. Possibly a long-term study
would throw more light on this.
Maximum growth rate on weekly and monthly panel was observed during June and July
respectively. This period was once again a period of stable salinity, temperature and
nutrient, which was conducive for high growth. The present observation matches with those
of Iwaki et al. (1977) in Matoya Bay and Sashikumar et al. (1989) from this locality.
Although, Nair et al. (1988) have reported a relatively high growth rate as compared to the
above report, however, the period of maximum growth rate matches with the present study.
Hydroids: The peak settlement of this group was during July-August (SW monsoon) and
January-March. The accumulation of this group was prominent on the edges of the panels.
Selection of edges by the hydroids for their settlement could be due to the very location,
which was found to be favorable for their filtration. On the other hand, had they settled on
the panel surface, their growth would not have been faster due to crowding by other foulers.
The present observation is found to be parallel with that of the findings of Nair et al. (1988)
and Sashikumar et al. (1989). Interestingly, Rajagopal et al. (1997) reported peak settlement
of hydroids during NE monsoon, an observation contrary to the present as well as those of
Nair et al. (1988) and Sashikumar et al. (1989). NE monsoon period, a period of the lowest
salinity, temperature and highest turbidity concomitant with low penetration of light, leads
to lowest phytoplankton production. Under these conditions, settlement in general has been
reported to be low to very low, and thus long-term studies again would provide a plausible
answer to the above ambiguity.
Ascidians: Ascidians are a very important group of fouling organisms having a world–
wide geographical distribution (Swami and Chhapgar, 2002). It has been reported that in
temperate waters only a single generation is established each year, in contrast to two to four
generations per year are established in tropical waters (Miller, 1974). During the weekly
observation of the present study, the occurrence of ascidians was generally restricted to
March-April and June – August, with peak settlement during March-April. Monthly
observation also showed the dominance of ascidians in March-April and June-July, but with
maximum density during June. This revealed that almost seven months in a year ascidians
did not settle on the panel. In the south west coast of India (New Mangalore port), their
appearance on the panel was also restricted only to 4 to 5 months in an year. Results of this
study coupled with that of Khandeparker et al. (1995) clearly demonstrate that ascidians are
a dominant group of macrofouling community in the Indian coastal water during pre-
monsoon and late post-monsoon months. Such dominance of ascidians during a certain
period of weekly and monthly observation could be attributed to the increased larval
density & their ability to undergo dedifferentiation and redifferentiation during that period
(Sebastian & Kurian, 1981). The ascidians dedifferentiate and form a heap of cells within a
small ectodermal bag and when favourable conditions set in, the cells rebuild the tissues
and redifferentiate into an adult ascidian (Khandeparker et al., 1995). Such interaction of the
breeding period of foulants in the development of fouling communities has been reported
by Chalmer (1982). Total absence of ascidians was encountered from September to
December. This showed that early pre-monsoon to early post-monsoon period is not
conducive for ascidian settlement at this coast. Even before the onset of NE monsoon,
reversing of current (September/ October) from north to south takes place. This brings the
low saline water from the north to the south and subsequently during NE monsoon period
(October-January) salinity and temperature deep to the minimum till the end of January, the
late-NE monsoon period. This clearly demonstrates that settlement of ascidians, highly
dependent on salinity level. Similar observations have also been made by Swami and
Chhapgar (2002). Although, they have reported the settlement of about 10 ascidian species,
however, most of the ascidian species were absent during monsoon months. Ascidians have
short larval life cycle lasting for a few hours and are very sensitive to minor variation in
salinity content. Khandeparker et al. (1995) while studying the co-relation between ascidian
larval availability and their settlement have clearly demonstrated that ascidian larvae were
not available during monsoon and early post-monsoon in coastal water. Salinity, during
monsoon period in Mangalore coastal water, decreased marginally (~33 psu), whereas at
this location it deeps significantly (~25 psu). As a pure marine form, ascidians are not able to
survive at low salinity (Renganathan, 1990). Thus, it was not surprising to observe total
absence of ascidian on the panel during September-December period. Increased suspended
load (during monsoon) and dominance of green mussels on panels (from September
onwards) could be other important causes of disappearance of ascidian population
(Khandeparker et al., 1995). The present trend in the settlement pattern of ascidians agrees
with the studies by Sashikumar et al. (1989) and Nair et al. (1988). However, observations of
ours as well as those of Nair et al. (1988) and Sashikumar et al. (1989) are not in tandem with
that of Rajagopal et al. (1997), who have reported the presence of ascidians throughout the
year including the unfavorable NE monsoon period.
Sea anemones: sea anemones are soft bodied conspicuous members of the marine fouling
community. The observation of heavy colonization of sea anemone during September
/October to NE monsoon period agrees with the earlier reports (Nair et al., 1988;
Sashikumar et al., 1989; Rajagopal et al., 1997).
Green mussels: Green mussels (Perna viridis) are one of the most important constituents of
the fouling community. The first peak of green mussel settlement coincided with the
seasonal temperature and salinity maxima of the present study. Rajagopal et al. (1997) also
reported the maximum P. viridis settlement during relatively high temperature and salinity
condition. However, the second peak was observed corresponding to the maximum
phytoplankton density and relatively high salinity during August-September, indicating the
significant influence of the availability of food resources and salinity on the larval
abundance and settlement of mussels (Pieters et al., 1980; Newell et al., 1982). Paul (1942)
also recorded the settlement of this species in Madras harbor during March to November
with a distinct peak during August – September. The trend observed on settlement of
mussels corroborates the finding of Seed (1969) and Myint and Tyler (1982), who have
explained in their classical papers on the role of temperature, salinity and food availability
on mussel breeding periodicity.
Other fouling organisms: Other fouling organisms observed include bryozoans
(Ectoprocta), oysters, polychaete worms & flat worms etc and some other crustaceans such
www.intechopen.com
Biofouling and its control in seawater cooled power plant cooling water system - a review 213
reported from coastal waters of southeast coast of India (Nair et al., 1988; Rajagopal et al.,
1997). In contrast to the present study as well as that of Nair et al. (1988) and Rajagopal et al.
(1997), relatively low barnacle population during June-July has been reported by
Sashikumar et al. (1989). This disparity among different studies as far as peak settlement
period of organisms is concerned, could be attributed to the variation in the influence of
environmental parameters on breeding cycle of the organisms. The above agreement is
strengthened by the fact that effect of array of environmental variables on reproduction
cycle of different organisms greatly differs (Sutherland, 1981). Rajagopal et al. (1997) have
reported six species of barnacle as against four observed by us. Possibly a long-term study
would throw more light on this.
Maximum growth rate on weekly and monthly panel was observed during June and July
respectively. This period was once again a period of stable salinity, temperature and
nutrient, which was conducive for high growth. The present observation matches with those
of Iwaki et al. (1977) in Matoya Bay and Sashikumar et al. (1989) from this locality.
Although, Nair et al. (1988) have reported a relatively high growth rate as compared to the
above report, however, the period of maximum growth rate matches with the present study.
Hydroids: The peak settlement of this group was during July-August (SW monsoon) and
January-March. The accumulation of this group was prominent on the edges of the panels.
Selection of edges by the hydroids for their settlement could be due to the very location,
which was found to be favorable for their filtration. On the other hand, had they settled on
the panel surface, their growth would not have been faster due to crowding by other foulers.
The present observation is found to be parallel with that of the findings of Nair et al. (1988)
and Sashikumar et al. (1989). Interestingly, Rajagopal et al. (1997) reported peak settlement
of hydroids during NE monsoon, an observation contrary to the present as well as those of
Nair et al. (1988) and Sashikumar et al. (1989). NE monsoon period, a period of the lowest
salinity, temperature and highest turbidity concomitant with low penetration of light, leads
to lowest phytoplankton production. Under these conditions, settlement in general has been
reported to be low to very low, and thus long-term studies again would provide a plausible
answer to the above ambiguity.
Ascidians: Ascidians are a very important group of fouling organisms having a world–
wide geographical distribution (Swami and Chhapgar, 2002). It has been reported that in
temperate waters only a single generation is established each year, in contrast to two to four
generations per year are established in tropical waters (Miller, 1974). During the weekly
observation of the present study, the occurrence of ascidians was generally restricted to
March-April and June – August, with peak settlement during March-April. Monthly
observation also showed the dominance of ascidians in March-April and June-July, but with
maximum density during June. This revealed that almost seven months in a year ascidians
did not settle on the panel. In the south west coast of India (New Mangalore port), their
appearance on the panel was also restricted only to 4 to 5 months in an year. Results of this
study coupled with that of Khandeparker et al. (1995) clearly demonstrate that ascidians are
a dominant group of macrofouling community in the Indian coastal water during pre-
monsoon and late post-monsoon months. Such dominance of ascidians during a certain
period of weekly and monthly observation could be attributed to the increased larval
density & their ability to undergo dedifferentiation and redifferentiation during that period
(Sebastian & Kurian, 1981). The ascidians dedifferentiate and form a heap of cells within a
small ectodermal bag and when favourable conditions set in, the cells rebuild the tissues
and redifferentiate into an adult ascidian (Khandeparker et al., 1995). Such interaction of the
breeding period of foulants in the development of fouling communities has been reported
by Chalmer (1982). Total absence of ascidians was encountered from September to
December. This showed that early pre-monsoon to early post-monsoon period is not
conducive for ascidian settlement at this coast. Even before the onset of NE monsoon,
reversing of current (September/ October) from north to south takes place. This brings the
low saline water from the north to the south and subsequently during NE monsoon period
(October-January) salinity and temperature deep to the minimum till the end of January, the
late-NE monsoon period. This clearly demonstrates that settlement of ascidians, highly
dependent on salinity level. Similar observations have also been made by Swami and
Chhapgar (2002). Although, they have reported the settlement of about 10 ascidian species,
however, most of the ascidian species were absent during monsoon months. Ascidians have
short larval life cycle lasting for a few hours and are very sensitive to minor variation in
salinity content. Khandeparker et al. (1995) while studying the co-relation between ascidian
larval availability and their settlement have clearly demonstrated that ascidian larvae were
not available during monsoon and early post-monsoon in coastal water. Salinity, during
monsoon period in Mangalore coastal water, decreased marginally (~33 psu), whereas at
this location it deeps significantly (~25 psu). As a pure marine form, ascidians are not able to
survive at low salinity (Renganathan, 1990). Thus, it was not surprising to observe total
absence of ascidian on the panel during September-December period. Increased suspended
load (during monsoon) and dominance of green mussels on panels (from September
onwards) could be other important causes of disappearance of ascidian population
(Khandeparker et al., 1995). The present trend in the settlement pattern of ascidians agrees
with the studies by Sashikumar et al. (1989) and Nair et al. (1988). However, observations of
ours as well as those of Nair et al. (1988) and Sashikumar et al. (1989) are not in tandem with
that of Rajagopal et al. (1997), who have reported the presence of ascidians throughout the
year including the unfavorable NE monsoon period.
Sea anemones: sea anemones are soft bodied conspicuous members of the marine fouling
community. The observation of heavy colonization of sea anemone during September
/October to NE monsoon period agrees with the earlier reports (Nair et al., 1988;
Sashikumar et al., 1989; Rajagopal et al., 1997).
Green mussels: Green mussels (Perna viridis) are one of the most important constituents of
the fouling community. The first peak of green mussel settlement coincided with the
seasonal temperature and salinity maxima of the present study. Rajagopal et al. (1997) also
reported the maximum P. viridis settlement during relatively high temperature and salinity
condition. However, the second peak was observed corresponding to the maximum
phytoplankton density and relatively high salinity during August-September, indicating the
significant influence of the availability of food resources and salinity on the larval
abundance and settlement of mussels (Pieters et al., 1980; Newell et al., 1982). Paul (1942)
also recorded the settlement of this species in Madras harbor during March to November
with a distinct peak during August – September. The trend observed on settlement of
mussels corroborates the finding of Seed (1969) and Myint and Tyler (1982), who have
explained in their classical papers on the role of temperature, salinity and food availability
on mussel breeding periodicity.
Other fouling organisms: Other fouling organisms observed include bryozoans
(Ectoprocta), oysters, polychaete worms & flat worms etc and some other crustaceans such
www.intechopen.com
Nuclear Power214
as, crabs (both larvae and juveniles), amphipods & juvenile lobsters. Settlement pattern of
bryozoans (Ectoprocta) did not show any definite trend in their temporal variation on short-
term panels. However, Rajagopal et al. (1997) have noticed bryozoan settlement during
January – May, with peak colonization during February – March, when other fouling
recruitment was less. Khandeparker et al. (1995) have reported heavy settlement of
bryozoan during December-March from New Mangalore Port. The information available on
the life history of bryozoan larvae in Kalpakkam coastal waters is at low key. Hence, to
understand their indefinite trend, it requires more knowledge on their developmental
biology. Appearance of juvenile oysters (Crassostrea madrasensis, Ostrea edulis) was observed
in almost all the months, with peak settlement during August. However, during weekly
survey they did not appear at all. The present study recorded considerable contribution
(maximum, ~7%) by oysters to the fouling community during August on monthly panels,
which has not been observed by other workers from this locality (Nair et al., 1988;
Sasikuamr et al., 1989; Rajagopal et al., 1997). Price et al. (1975) have stated that the growth
of oysters was the highest in August i.e. after their spawning, when glycogen reserves are
restored. Growth ceases during winter, except in Florida, where growth was continuous
throughout the year (Sellers and Stanley, 1984). It is interesting to note that stable
environments inhibit better growth for oysters (Sellers and Stanley, 1984). We are unable to
explain the cause of non-availability of oysters during earlier studies (Rajagopal et al., 1997;
Sasikuamr et al., 1989; Nair et al., 1988). Though the peak settlement of polychaete worms
(Serpula vermicularis, Hydroides norvegica) (0.05-2.1%- Monthly and 2 - 56% - cumulative) was
observed in January during monthly observation, its availability as temporary settler was
noticed during most part of the study period. Khandeparker et al. (1995) have also reported
the year-round breeding activity of this organism from west coast of India. During the initial
period of cumulative observation (28d), polychaete density was found to be dominant,
which gradually disappeared during the subsequent days. Tube-dwelling polychaetes were
found to have higher covering capacity than barnacles (Anil et al., 1990; Kajihara et al.,
1976). Flat worms were found to be settled in relatively less numbers as compared to the
other foulants during the entire short-term observation. Settlement of sponges, clams and
snails were also occasionally noticed on the panels. Other crustaceans (amphipods, lobster
juveniles, crab juveniles) started appearing from August onwards with high abundance
during September. Despite, being a very significant component of the fouling assemblage in
marine environment, macroalgae, showed its total absence at Kalpakkam coastal waters
during the present investigation, which might have been due to competition for space,
predation and grazing (Carpenter, 1990). Earlier workers too have not reported the
settlement of macroalgae on the exposed panels from this locality.
4.3.4. Seasonal settlement on long -term (cumulative) panels
Long-term observation showed distinct fouling succession. To follow changes or succession
occurring within the fouling community, cumulative/ long-term panels are more suitable
than the short-term period (Rajagopal et al., 1997). Barnacles were found to be the first
community settled on the long-term panels (maximum size 14 mm). Hydroids and
polychaete worms were the next to settle during the month of May. Barnacle population
remained unaltered by the secondary settlers during this period. By June, ascidians started
appearing on the panels and by July they fully covered the barnacles and other organisms.
Sashikumar et al. (1990) have also reported the similar pattern of ascidian colonization on
long-term panel. Thus, ascidians can be considered as a temporary ‘stable point’ in the
fouling community development. According to Sutherland (1981), the term ‘stable point’ is
to describe the succession of foulers. Disappearance of this group was noticed from the
month of September, which could be due to the dominance of other fast growing foulers
such as green mussels (Perna viridis). Sashikumar et al. (1989) also observed similar pattern
of colonization on long-term panels.
During the present study, green mussel was found to be the climax community. This could
be due to the fast growing and competitively superior green mussels establishing
dominance on panel surfaces such that other fouling organisms are left with little space to
settle. Richmond and Seed (1991) have also reported that competitively dominant species
like green mussels are often successful due to their large body size, fast growth rate,
extended longevity and prolonged larval life. According to the previous study by Rajagopal
et al. (1997), the peak settlement of green mussels (P. viridis) occurred in April-June as well
as one or two months immediately proceeding it. However, the present study showed that
only from mid-July onwards mussels started appearing on the test panels and the peak was
observed in September. It is apparent to assume that a shift in the peak settlement period of
mussels has taken place, possibly due to the change in coastal water characteristics and the
same could be confirmed over a long period of study. Surprisingly and interestingly both
Nair et al. (1988) and Sashikumar et al. (1989) have not reported settlement of green mussel
on their test panel, which is not in tandem with the observation of ours as well as that of
Rajagopal et al. (1997).
4.3.5. Biomass
The lowest and highest biomass values for weekly panels were obtained in the months of
November and December respectively, which could be attributed to the difference in peak
settlement period of macrofoulants contributing more to the fouling biomass. In spite of the
influence of NE monsoon, the highest value was observed during November (Monthly
biomass) and December (Weekly biomass), which could be attributed to the elimination of
most of the organisms due to unfavourable condition of the ambience (such as low salinity,
high turbidity, low phytoplankton density leading to food scarcity etc) and survival of the
most tolerant foulers (such as barnacles and green mussels). This exclusion of organisms
leads to reduction in intra- and inter-specific competition, which ultimately facilitates the
growth of better adapted foulants (Iwaki & Hattori, 1987). Thus, barnacles and green
mussels were found to contribute maximum to the total fouling biomass during the above
period.
The abrupt increase in biomass in 150d old panel could be ascribed to the dominance of
green mussels, P. viridis during the month of October. It is worth comparing the present
data with those of Nair et al. (1988), Sashikumar et al. (1989) and Rajagopal et al. (1997) with
respect to both short-term and long-term panels. Biomass observed on short-term panels
(15-30d) exposed by Sashikumar et al. (1989) ranged from 1 to 7 g. per 100 sq. cm and Nair et
al. (1988) under similar condition observed a biomass ranged from 9 to 51 g. per 100 sq. cm.
Karande et al. (1983) have reported 45 g. per 100 sq. cm biomass on 30 days exposed wooden
panel from Kalpakkam coast. In contrast, Rajagopal et al. (1997) observed a biomass ranged
from 130 to 640 g. per 100 sq. cm, a phenomenal increase. Such abnormal increase as above
has not been explained by him as well as he has not compared his values with those of
others. The present values ranged from 17 to 46 g. per 100 sq. cm (30d) and 1 to 11 g. per 100
www.intechopen.com
Biofouling and its control in seawater cooled power plant cooling water system - a review 215
as, crabs (both larvae and juveniles), amphipods & juvenile lobsters. Settlement pattern of
bryozoans (Ectoprocta) did not show any definite trend in their temporal variation on short-
term panels. However, Rajagopal et al. (1997) have noticed bryozoan settlement during
January – May, with peak colonization during February – March, when other fouling
recruitment was less. Khandeparker et al. (1995) have reported heavy settlement of
bryozoan during December-March from New Mangalore Port. The information available on
the life history of bryozoan larvae in Kalpakkam coastal waters is at low key. Hence, to
understand their indefinite trend, it requires more knowledge on their developmental
biology. Appearance of juvenile oysters (Crassostrea madrasensis, Ostrea edulis) was observed
in almost all the months, with peak settlement during August. However, during weekly
survey they did not appear at all. The present study recorded considerable contribution
(maximum, ~7%) by oysters to the fouling community during August on monthly panels,
which has not been observed by other workers from this locality (Nair et al., 1988;
Sasikuamr et al., 1989; Rajagopal et al., 1997). Price et al. (1975) have stated that the growth
of oysters was the highest in August i.e. after their spawning, when glycogen reserves are
restored. Growth ceases during winter, except in Florida, where growth was continuous
throughout the year (Sellers and Stanley, 1984). It is interesting to note that stable
environments inhibit better growth for oysters (Sellers and Stanley, 1984). We are unable to
explain the cause of non-availability of oysters during earlier studies (Rajagopal et al., 1997;
Sasikuamr et al., 1989; Nair et al., 1988). Though the peak settlement of polychaete worms
(Serpula vermicularis, Hydroides norvegica) (0.05-2.1%- Monthly and 2 - 56% - cumulative) was
observed in January during monthly observation, its availability as temporary settler was
noticed during most part of the study period. Khandeparker et al. (1995) have also reported
the year-round breeding activity of this organism from west coast of India. During the initial
period of cumulative observation (28d), polychaete density was found to be dominant,
which gradually disappeared during the subsequent days. Tube-dwelling polychaetes were
found to have higher covering capacity than barnacles (Anil et al., 1990; Kajihara et al.,
1976). Flat worms were found to be settled in relatively less numbers as compared to the
other foulants during the entire short-term observation. Settlement of sponges, clams and
snails were also occasionally noticed on the panels. Other crustaceans (amphipods, lobster
juveniles, crab juveniles) started appearing from August onwards with high abundance
during September. Despite, being a very significant component of the fouling assemblage in
marine environment, macroalgae, showed its total absence at Kalpakkam coastal waters
during the present investigation, which might have been due to competition for space,
predation and grazing (Carpenter, 1990). Earlier workers too have not reported the
settlement of macroalgae on the exposed panels from this locality.
4.3.4. Seasonal settlement on long -term (cumulative) panels
Long-term observation showed distinct fouling succession. To follow changes or succession
occurring within the fouling community, cumulative/ long-term panels are more suitable
than the short-term period (Rajagopal et al., 1997). Barnacles were found to be the first
community settled on the long-term panels (maximum size 14 mm). Hydroids and
polychaete worms were the next to settle during the month of May. Barnacle population
remained unaltered by the secondary settlers during this period. By June, ascidians started
appearing on the panels and by July they fully covered the barnacles and other organisms.
Sashikumar et al. (1990) have also reported the similar pattern of ascidian colonization on
long-term panel. Thus, ascidians can be considered as a temporary ‘stable point’ in the
fouling community development. According to Sutherland (1981), the term ‘stable point’ is
to describe the succession of foulers. Disappearance of this group was noticed from the
month of September, which could be due to the dominance of other fast growing foulers
such as green mussels (Perna viridis). Sashikumar et al. (1989) also observed similar pattern
of colonization on long-term panels.
During the present study, green mussel was found to be the climax community. This could
be due to the fast growing and competitively superior green mussels establishing
dominance on panel surfaces such that other fouling organisms are left with little space to
settle. Richmond and Seed (1991) have also reported that competitively dominant species
like green mussels are often successful due to their large body size, fast growth rate,
extended longevity and prolonged larval life. According to the previous study by Rajagopal
et al. (1997), the peak settlement of green mussels (P. viridis) occurred in April-June as well
as one or two months immediately proceeding it. However, the present study showed that
only from mid-July onwards mussels started appearing on the test panels and the peak was
observed in September. It is apparent to assume that a shift in the peak settlement period of
mussels has taken place, possibly due to the change in coastal water characteristics and the
same could be confirmed over a long period of study. Surprisingly and interestingly both
Nair et al. (1988) and Sashikumar et al. (1989) have not reported settlement of green mussel
on their test panel, which is not in tandem with the observation of ours as well as that of
Rajagopal et al. (1997).
4.3.5. Biomass
The lowest and highest biomass values for weekly panels were obtained in the months of
November and December respectively, which could be attributed to the difference in peak
settlement period of macrofoulants contributing more to the fouling biomass. In spite of the
influence of NE monsoon, the highest value was observed during November (Monthly
biomass) and December (Weekly biomass), which could be attributed to the elimination of
most of the organisms due to unfavourable condition of the ambience (such as low salinity,
high turbidity, low phytoplankton density leading to food scarcity etc) and survival of the
most tolerant foulers (such as barnacles and green mussels). This exclusion of organisms
leads to reduction in intra- and inter-specific competition, which ultimately facilitates the
growth of better adapted foulants (Iwaki & Hattori, 1987). Thus, barnacles and green
mussels were found to contribute maximum to the total fouling biomass during the above
period.
The abrupt increase in biomass in 150d old panel could be ascribed to the dominance of
green mussels, P. viridis during the month of October. It is worth comparing the present
data with those of Nair et al. (1988), Sashikumar et al. (1989) and Rajagopal et al. (1997) with
respect to both short-term and long-term panels. Biomass observed on short-term panels
(15-30d) exposed by Sashikumar et al. (1989) ranged from 1 to 7 g. per 100 sq. cm and Nair et
al. (1988) under similar condition observed a biomass ranged from 9 to 51 g. per 100 sq. cm.
Karande et al. (1983) have reported 45 g. per 100 sq. cm biomass on 30 days exposed wooden
panel from Kalpakkam coast. In contrast, Rajagopal et al. (1997) observed a biomass ranged
from 130 to 640 g. per 100 sq. cm, a phenomenal increase. Such abnormal increase as above
has not been explained by him as well as he has not compared his values with those of
others. The present values ranged from 17 to 46 g. per 100 sq. cm (30d) and 1 to 11 g. per 100
www.intechopen.com