tóm tắt tiếng anh nghiên cứu thành phần, tính chất cơ học bê tông cường độ siêu
Bạn đang xem bản rút gọn của tài liệu. Xem và tải ngay bản đầy đủ của tài liệu tại đây (2.57 MB, 26 trang )
1
INTRODUCTION
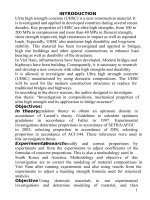
Ultra high strength concrete (UHSC) is a new construction material. It
is investigated and applied in developed countries during several recent
decades. Key properties of UHSC are ultra high strengths, from 100 to
200 MPa in compression and more than 40 MPa in flexural strength,
shear strength improved, high resistances in impact as well as repeated
loads. Especially, UHSC also maintains high durability and long-term
stability. This material has been investigated and applied in bridges,
high rise buildings and other special constructions to enhance load
bearing as well as durability of the structures.
In Viet Nam, infrastructures have been developed. Modern bridges and
highways have been building. Consequently, it is necessary to research
and develop a new concrete with ultra high strengths and durability.
It is allowed to investigate and apply Ultra high strength concrete
(UHSC) manufactured by using domestic compositions. The UHSC
will be used for the modern construction structures to replace for
traditional bridges and highways.
In according to the above reasons, the author designed to investigate
this thesis: “Investigation in compositions, mechanical properties of
ultra high strength and its application in bridge structure”.
Objectives:
In theory: gradation theory to obtain an optimum density in
accordance of Larard’s theory. Guidelines to calculate optimum
gradations in accordance of Fuller in 1997. Experimental
investigations determine proportions in accordance of SETRA/AFGC
in 2002; selecting proportion in accordance of DIN; selecting
proportion in accordance of ACI-544. These references were used in
this investigation thesis.
Experimental research: modify and correct proportions by
experiments and from the experiments to adjust coefficients of the
formulas of concrete proportions. This is also a methodology used in
South Korea and America. Methodology and objective of this
investigation are to correct the modeling of material compositions in
Viet Nam after running experiments and also using results from the
experiments to adjust a bending strength formula used for structural
analysis.
Objective: Using domestic materials to run experimental
investigations and determine modeling of material, and then
2
manufacture UHSC, from 120 to 140 MPa, as well as to apply it in
structures.
Scope of investigation: Correct the modeling of material via
experiments, experimental analysis the bending behaviour of beams to
determine
t
, experimental analysis the bending behaviour of beams to
determine their new height. The thesis investigates experimental beams
under static loads only, dynamic and repeated loads have not carried
out.
Scientific and realised values:
- In theory: Research in application of theoretical calculations of
optimum density to design proportion of UHSC. Analyse bending
behaviour of beams and bridge beams to determine flexural strength
t
and height of the beams.
- In experiments: surveying materials, selecting proportions of
UHSC, from 120-140 MPa using domestic materials. Basing on
experimental results to propose mechanical properties of the UHSC as
well as flexural strength
t
; analyse bending behaviour of bridge beams
to determine and their heights.
Chapter 1: REVIEW OF RESEARCHES AND APPLICATIONS
OF UHSC OVER THE WORLD AND IN VIETNAM
1.1. References
UHSC is a new material that has been developed since 1990.
Mechanical behaviours, formulas to select proportions as well as
guidelines for designing and construction reported in France, America
and Germany. Several first applications in Canada, Euro, Asia and
America confirmed advantages of this new material in cost, durability
and other properties.
Excellent properties of the UHSC allow to think of manufacture UHSC
using domestic materials basing on references of investigated results
published over the world. This opens a new trend for construction
materials and structures.
1.2. Investigated UHSC in America, Euro and Asia
New theories of gradation in according to optimum density presented
by Larard;
Theories of optimum gradation presented by SETRA/AFGC;
Guidelines for design and construction investigated and proposed by
RILEM, DIN;
Experiments to correct modeling of material carried out by FHWA
(America) and South Korea.
Figures from 1.1 to 1.6 introduce bridge, building structures and
military applications.
Fig 1.1. Comparison in weight and height of beams casted from
and traditional concretes.
Fig 1.2. Bridges used UHSC to cast T and
beams in America
Fig 1.3: Footbridge in Seoul, South
Korea, 2002.
Fig 1.4:
Milau roof, 2004.
Fig 1.5: Bourg –lès – Valence Bridge,
France, 2004
Fig 1.6:
Explosive test in Iran Military
3
Experiments to correct modeling of material carried out by FHWA
Figures from 1.1 to 1.6 introduce bridge, building structures and
Fig 1.1. Comparison in weight and height of beams casted from
UHSC
beams in America
Milau roof, 2004.
Explosive test in Iran Military
4
1.3. Relevant researches published in Viet Nam
In Viet Nam: UHSC is a relative new subject. In 2008, several
researchers at the University of Transportation and Communication,
University of Construction, Ho Chi Minh City University of
Polytechnics started to investigate this concrete. The investigation
from those Institutions are initial researches in UHSC in Viet Nam.
The UHSC is a hot subject in over the world and also in Viet Nam. It is
necessary to pay attentions in research and manufacture UHSC using
domestic materials to contribute understanding of fundamental,
designing and application of this material in construction.
1.4. Objective
Using domestic materials and basing on guidelines to investigate and
manufacture UHSC, from 120 to 140 MPa. Experimental research in
bending of reinforced concrete beams casted by UHSC to determine K
coefficient in formula of flexural strength. Analyse bending behaviour
of the bridge beams using UHSC to propose height of the beams.
1.5. Content and methodology
Select materials, design proportion, test mechanical properties of
UHSC, from 120 to 140 MPa. Analyse bending of beams, bridge
beams and propose the use of UHSC in structures. Using theories and
experiments to determine proportions, mechanical properties of the
UHSC and formula of flexural strength as well as height of bridge
beams.
Chapter 2: MATERIALS AND DESIGN OF PROPORTION OF
UHSC
2.1. Materials
2.1.1. Cement, superplasticiser and silica fume
This investigation used PC40 But Son cement, grade 1, agreed with
international grade and the use of Viet Nam.
Superplasticiser is a Policacbol silat supplied from Sika Viet Nam, label
3000-20, properties of the Superplasticiser agrees with ASTM C494, group C.
Silica fume was supplied also by Sika Viet Nam. The properties of this
additive agree with ASTM 1230-95a, Figure 2.1.
Fig 2.1. Silica fume
2.1.2. Coarse aggregate and quartz powder
Coarse aggregate: using quartz
sand agreed international guidelines. The
quartz sand was ground from quartz
rock that exploited at Thanh Son
Tho. The author prepared the quartz
sand (as coarse ag
gradation of the UHSC) with maximum size of 0.6 mm, gradation as
presented in Table 2.1 and Figure 2.2.
Table 2.1. Gradation of quartz sand
Size (mm) Passing, A%
0,63 100
0,315 67,1
0,14 41,6
0,075 13,9
Quartz powder was also ground from quartz
rock Thanh Son
particle size of approximately 27.9m as in Figure 2.3.
Fir 2.2: Quartz sand
Fig
2.3: Quartz
2.1.3. Steel fibre
Using Dramix steel fibre from BeKeart, Germany,
grade OL13
of 0.2 mm, length of L=13 mm. Yield strength is 2000 MPa, content of
is 2% by volume, as Figure 2.4.
Fig 2.4: Steel fibre
In short, main materials prepared to mix UHSC are PC40 But Son cement,
quartz sand and quartz powder ground from quartz
rock of Thanh Son
5
sand agreed international guidelines. The
rock that exploited at Thanh Son
-Phu
sand (as coarse ag
gregate in the
gradation of the UHSC) with maximum size of 0.6 mm, gradation as
rock Thanh Son
-Phu Tho with
2.3: Quartz
powder
grade OL13
-20, diameter
of 0.2 mm, length of L=13 mm. Yield strength is 2000 MPa, content of
fibre
In short, main materials prepared to mix UHSC are PC40 But Son cement,
rock of Thanh Son
– Phu
Tho, silica
fume and superplasticiser supplied from Sika Viet Nam, Dramix
steel fibre imported from ShangHai, China.
It was shown that there are
enough resources of materials in Viet Nam agreed with intern
standards to manufacture UHSC.
2.2. Manufacture UHSC in accordance of theory of the optimum density
2.2.1. Introduction
In this thesis, theory of the optimum density of Mooney and Larrad
was used to investigate, the optimum gradation curve of
used as a comparison.
2.2.2. Selection proportion
Base on the optimum density of Mooney, researches of Thomson and
Larrar
d, the author carried out calculation and set up three formulas of
UHSC as C1, C2 and C3 in Table 2.2.
Table 2.2: Proportions of UHSC
Materials C1 C2
But Son PC40 cement, kg/m
3
800 850
900
Silica fume (25%X), kg/m
3
195,5 195,5
207
Quartz sand Q1, kg/m
3
900 935
977
Quartz powder Q2, kg/m
3
280 150
120
Steel fibre, kg/m
3
160 170
160
Superplasticiser, kg 16 17
Water, lít 160 170
170
N/X ratio 0,20 0,20
0
Gradation with maximum size of 0.6 mm, minimum size is 0.00001
mm as in Figure 2.5.
Fig 2.5: Gradation of UHSC
2.2.3. Gradation check
Base on concrete formulas, create gradation of UHSC and
the optimum gradation in according of Fuller as in Figure 2.6.
6
fume and superplasticiser supplied from Sika Viet Nam, Dramix
It was shown that there are
enough resources of materials in Viet Nam agreed with intern
ational
2.2. Manufacture UHSC in accordance of theory of the optimum density
In this thesis, theory of the optimum density of Mooney and Larrad
was used to investigate, the optimum gradation curve of
Fuller was
Base on the optimum density of Mooney, researches of Thomson and
d, the author carried out calculation and set up three formulas of
C3
900
207
977
120
160
18
170
0
,20
Gradation with maximum size of 0.6 mm, minimum size is 0.00001
Base on concrete formulas, create gradation of UHSC and
compare to
the optimum gradation in according of Fuller as in Figure 2.6.
7
Fig 2.6: Gradation of UHSC in comparison with the Fuller gradation
Tested results showed that designed gradations C1, C2 and C3 are very
close to Fuller’s gradations.
Results obtained in Chapter 2 includes:
- Extract and ground quartz sand and powder agreed with
standards.
- Selected cement, silica fume, steel fibre agreed with UHSC.
- Using a model of the optimum density to design proportions of
UHSC C1, C2 and C3.
- Tested gradations that agreed with France researches and
Fuller’s optimum gradation.
Chapter 3: TESTS OF COMPRESSIVE STRENGTH,
BENDING STRENGTH AND ELASTIC MODULUS OF UHSC
3.1. Introduction
In this Chapter the author presents tests of compressive strength,
specific tensile strength and elastic modulus of UHSC.
3.1.1. Compressive strength
Compressive strength was determined at the ages of 3, 7 and 28 days.
Samples were cylinders with dimensions of 10×20 cm (diameter ×
height). The samples were cured in room condition.
3.1.2. Flexural strength
Bending behaviour of materials was characterised by three tests as
below:
- Tensile strength in elastic bending of UHSC (f
tj
). This tested value
was determined proportionally with elastic deformation at the time of a
first crack with a relative deformation of 1‰, opening crack width of
0.05 mm and a deflection of less than 1 mm.
- Normal maximum flexural strength (due to maximum bending
moment) with a deformation of 3‰.
-
Flexural strength at a time of maximum deformation with a
deflection
of tested beam of 10 mm. Bending were tested in
accordance with European standards (RILEM).
3.1.3. Procedure to test the samples and analyse
Two tests proposed in the world:
Type 1
: Four point bending test applied for prism samples without
notch that allows to find out tensile strength after adjusting several
proportional coefficients.
Type 2: Three point bending test applied for prism samples with notch,
using back-calculation meth
od as guideline of RILEM.
The author used four point bending test applied for beams in
accordance of European guideline (Figure 3.1).
3.1.4. Dimensions of samples (European standards)
The prism samples
with cross section in square (a=15 cm) and length
of 4a (60 cm).
a. Test equipments
The four point bending test in accordance of European guideline
specifies that measurement equipment must be fixed on the samples to
measure real deflections of the samples (Figure 3.1).
Fig 3.1: Mode of four point bending test
b. Testing result collection
Tested figures carry out with a frequency of 5 Hz. They are:
+ Deflection
+ Load
+ Load-deflection diagram.
c. Calculation of opening crack width
and deformation
Given deflection f
0
with the last stage of elastic, opening crack
(w) was analysed via a relation with deflection in accordance qith
SETRA-AFGC.
3.2. Sample preparation
8
Flexural strength at a time of maximum deformation with a
of tested beam of 10 mm. Bending were tested in
: Four point bending test applied for prism samples without
notch that allows to find out tensile strength after adjusting several
Type 2: Three point bending test applied for prism samples with notch,
od as guideline of RILEM.
The author used four point bending test applied for beams in
with cross section in square (a=15 cm) and length
The four point bending test in accordance of European guideline
specifies that measurement equipment must be fixed on the samples to
Tested figures carry out with a frequency of 5 Hz. They are:
and deformation
with the last stage of elastic, opening crack
width
(w) was analysed via a relation with deflection in accordance qith
9
3.3. Tested results:
Results of flow test, compressive strength are presented in Tables 3.1;
3.2; 3.3 and Figures 3.2; 3.3.
Table 3.1: Flow test results
Sample C1 C2 C3
Slump (cm) 24,00 29,00 27,00
Flow (cm) 45,00 64,00 50,50
Date of cast 29/3/2011 1/4/2011 6/4/2011
Fig 3.2: Trial mix
Fig 3.3: Flow test
Table 3.2: Compressive strength test
No
Label
Date of
cast
Compressive strength (MPa)
R3 TB3 S3 R7 TB7 S7 R 28 TB28 S28
C1
C11
29/3 65,89
69,77
3,32
109,89
106,59
5,33
134,70
127,59
5,22
C12
29/3 66,53
100,63
122,63
C13
29/3 71,72
101,23
126,90
C14
29/3 74,65
111,76
132,63
C15
29/3 72,48
102,36
119,79
C16
29/3 67,36
113,69
128,90
C2
C21
1/4 68,55
72,65
3,69
111,47
112,46
5,28
121,36
130,01
5,73
C22
1/4 67,89
106,34
128,63
C23
1/4 71,66
115,19
137,24
C24
1/4 75,12
120,69
133,68
C25
1/4 78,34
115,31
124,36
C26
1/4 74,35
105,73
134,80
C3
C31
6/4 82,42
84,75
5,07
115,51
113,06
5,57
142,56
139,21
6,21
C32
6/4 80,23
112,36
132,21
10
C33
6/4 77,64
105,61
129,38
C34
6/4 86,62
122,38
144,77
C35
6/4 91,65
107,34
145,61
C36
6/4 89,92
115,18
140,74
R
i
: Compressive strength at the day i
TB
i
: average compressive strength at day i
S
i
: standard deviation of compressive strength at day i
Table 3.3: Average compressive strength of sets of samples
Set
Average
compressive
strength (MPa)
Standard
deviation (S)
Relative deformation
(‰)
C1 127,59 5,22 4,02
C2 130,01 5,73 3,55
C3 139,21 5,21 3,75
From compressive strength tests of three mixtures C1, C2, C3, drawing
graphs of relationships between strength-time and strength-water/binder ratio
as in Figures 3.4 and 3.5.
Fig 3.4: Compressive strength Vs time
Fig 3.5: Compressive strength Vs
water/binder ratio of C3 mix
+ Flexural strength tested result
Four point bending test was carried out at the University of Transportation
and Communications. Procedure was accordance of RILEM as in Figure 3.6.
Fig 3.6: Bending test and damaged mode
Tested results are presented in Table 3.4 and Figure 3.7
0
20
40
60
80
100
120
140
160
3 7 28
Ngày
MPa
C1
C2
C3
0
50
100
150
0.196 0.205 0.223
N/CKD
MPa
3
7
28
11
Table 3.4: Relationship between load and deflection
Deflection
(mm)
Load P (kN)
P
M1
P
M2
P
M3
P
M4
P
M5
P
M6
0,00 0,000 0,000 0,000 0,000 0,000 0,000
0,20 75,470
70,637 112,226 80,176 73,181 97,091
0,22 80,303
78,777 118,204 94,421 76,361 101,161
0,25 83,865
82,974 126,598 107,775 80,558 106,884
0,30 94,039
100,653 142,750 148,219 90,351 119,475
0,40 107,520
119,094 162,209 207,995 106,249 126,343
0,50 112,862
122,910 179,124 227,199 118,077 128,251
0,70 115,152
123,673 205,196 247,930 126,216 132,066
1,00 119,094
123,673 210,284 291,554 126,343 132,066
2,00 89,969
79,413 159,792 219,000 90,732 78,014
3,00 66,949
57,029 103,959 143,667 73,181 59,446
5,00 29,939
32,864 57,029 106,000 51,051 29,558
10,00 12,134
11,116 8,191 42,420 22,817 9,336
Fig 3.7: Graph of load and deflection
A relationship between strength and opening crack width, strain … in
case of four point bending test is calculated in accordance of
SETRA/AFGC, results as in Table 3.5.
Table 3.5: Relation between strength and deformation of UHSC
Sampl
e
Deflectio
n (mm)
Openin
g crack
width
W (mm)
Deflectio
n (
o
/
oo
)
Load
P(kN)
Flexura
l
strength
Ru
(MPa)
Specified
strength
0,7265xR
u (MPa)
C1
0,092 0,05 0,2 73,47 9,80 7,12
0,2 0,18 2 79,50 10,60 7,70
0,3 0,30 3
122,6
8
16,36 11,88
0,9 1,02 10 97,74
13
2,12 2,48 25 84,17
11
2,55 3,00 32 0,00 0
,
C2
0,092 0,05 0,2 85,05
11
0,2 0,18 2 88,51
11
0,3 0,30 3
129,2
0
17
0,9 1,02 10
110,4
2
14
2,12 2,48 25 84,23
11
2,55 3,00 32 0,00 0
,0
0,092 0,05 0,2 90,47
12
C3
0,2 0,18 2
126,2
6
16
0,3 0,30 3
251,1
9
33
0,9 1,02 10
210,6
7
28
2,12 2,48 25
159,7
4
21
+ Stress-strain model
Drawing a graph of stress-
strain in accordance of SETRA/AFGC for
sets of C3 samples as a fundamental for structural analyse, Figure 3.8.
Fig 3.8: Graph of stress –
strain of UHSC, samples C3 drawn as SETRA/AFGC
+ Elastic modulus test
- Elastic modulus and poison coefficient tests of UHSC
carried out as ASTM,
cylinders with diameter of 15 cm and height of 30 cm. Testing equipment is a
150 tons (1500 kN) machine, as Figure 3.9.
12
13
,03 9,47
11
,22 8,15
,
00 0,00
11
,34 8,24
11
,80 8,57
17
,23 12,52
14
,72 10,70
11
,23 8,16
,0
0 0,00
12
,06 8,76
16
,83 12,23
33
,49 24,33
28
,09 20,41
21
,30 15,47
strain in accordance of SETRA/AFGC for
sets of C3 samples as a fundamental for structural analyse, Figure 3.8.
strain of UHSC, samples C3 drawn as SETRA/AFGC
carried out as ASTM,
cylinders with diameter of 15 cm and height of 30 cm. Testing equipment is a
13
Fig 3.9: Elastic modulus test
Average tested results are presented in Table 3.6.
Table 3.6: Elastic modulus tested result
Set of samples C1 C2 C3
Compressive strength
(MPa)
127,59 130,01 139,21
E (MPa) 46500 47200 49300
E= 9200 x f
1/3
cj
46085 46449 47565
Error
1,009 1,016 1,038
+Comments
It is shown from the results: E= 9200 x f
1/3
cj
Coefficient of K
0
=9200, between the range of European standards.
+Conclusion of compressive strength, flexural strength and
elastic modulus of UHSC
Three trial mixtures showed that mix C3 (as in Table 3.7) obtained a
maximum strength of 139,2 MPa, specified flexural strength of 24,22 MPa.
Table 3.7: Proportion of mix C3
Water, kg (final) 217,57 kg
Cement 900 kg
Quartz sand d=0,6mm (dry) 910 kg
Quartz powder d=27m (dry)
120 kg
Silica fume d=1m
207 kg
Steel fibre d=0,2mm 160 kg
Superplasticiser 22,46kg
3.4. Comments
The use of domestic materials prepared successfully UHSC with typical
properties as below:
-
Flow of fresh mix from 45 to 64 cm, agreed with international
requirements of more than 50 cm.
-
Compressive strength from 125,6 to 139,2 MPa at 28 days, relative
deformation of approximately 3,5‰.
-
Flexural strength at the time of first crack from 9,8 to 12,06 MPa,
Maximum flexural strength from 16,36 to 33,49 MPa.
strength at deflection of 10 mm from 2,03 to 3,9 MPa. Specified
elastic strength from 7,12 to 8,76 MPa. Maximum specified strength
from 11,8 to 24,22 MPa.
- Elastic modulus: 46,2-
49,3 GPa. This value in a range of 45
as investigations published.
- Stress-strain model used for calculation
drawn as guidelines of
Europe for C3 samples (Figure 3.8).
Chapter 4: EXPERIMENT INVESTIGATION AND ANALYSE
BENDING BEHAVIOUR OF REINFORCED CONCRETE BEAM
AND BRIDGE BEAM CASTED BY UHSC
4.1. Introduction
Investigated results of ACI-544
describes that flexural strength of
concrete is approximately 40 MPa grade.
Results from Imam et al (1995) calculated that
flexural stre
performance fibre concrete is less than 100 MPa.
Consequently, UHSC beams with compressive strength from 120 to 140 MPa
should consider formulas for flexural strength. This investigation aims to
analyse and find out a suitable formula for flexural strength
based on experiments and theory calculations.
4.2. Fundamental for analyse flexural behaviour of reinforced UHSC
beam
Using method from ACI-
544 and Imam et al. (1995) (stress
drawn as in accordance of ACI-
544 and Imam as in Figure 4.1).
Fig 4.1: Graph of flexure of beams as ACI-
544
(a): Load distribution; (b): Stress graph; (c):
Strain graph
14
Flow of fresh mix from 45 to 64 cm, agreed with international
Compressive strength from 125,6 to 139,2 MPa at 28 days, relative
Flexural strength at the time of first crack from 9,8 to 12,06 MPa,
Maximum flexural strength from 16,36 to 33,49 MPa.
Flexural
strength at deflection of 10 mm from 2,03 to 3,9 MPa. Specified
elastic strength from 7,12 to 8,76 MPa. Maximum specified strength
49,3 GPa. This value in a range of 45
-55 GPa
drawn as guidelines of
Chapter 4: EXPERIMENT INVESTIGATION AND ANALYSE
BENDING BEHAVIOUR OF REINFORCED CONCRETE BEAM
AND BRIDGE BEAM CASTED BY UHSC
describes that flexural strength of
fibre
flexural stre
ngth of high
Consequently, UHSC beams with compressive strength from 120 to 140 MPa
should consider formulas for flexural strength. This investigation aims to
analyse and find out a suitable formula for flexural strength
(
) of UHSC
4.2. Fundamental for analyse flexural behaviour of reinforced UHSC
544 and Imam et al. (1995) (stress
-strain graph
544 and Imam as in Figure 4.1).
544
Strain graph
In accordance of ACI-544,
formula to calculate bending moment of flexure
beam using fibre concrete as Figure 4.1.
=
.
. −
+
..
(
ℎ −
)
.
+
−
where
t
= K.( l
f
/d
f
)
f
F
be
t
: Flexural strength after cracking of steel fibre concrete
where:
+ In accordance of ACI, K=0,00772.
+ As Imam et al (1995), K=0,0138.
In short, steel fibre UHSC with strength more than 130 M
P
suitable K*, or other word, need to find out a suitable
t
.
4.3. Prepare samples
In this section
, use the mix C3 as describe in Chapter 2 and Chapter 3.
Cast 3 sets samples (9 beams) as accordance of ACI544 with width of 125
mm, height of 250 mm and length of 2400 mm.
Set 1: 3 beams, used 2 rebars of
12mm, label of 2D12
2D12-3.
Set 2: 3 beams, used 2 rebars of
16mm, label of 2D16
2D16-3.
Set 1: 3 beams, used 2 rebars of
20mm, label of 2D20
2D20-3.
Samples and testing model as in Figures 4.2 and 4.3.
Fig 4.2: Structure and testing model of
9 beams
Fig 4.3:
Samples ready for test
4.4. Method to test beam
Test was carried out at the University of
Communications and Transportation
(UCT). The author used four point bending test that
agreed with European
standards.
4.5. Tested results
From tested results of 9 beams (3 sets of samples) determined values of loads
and deflection. Setting up graph of load-deflection (P -
Figure 4.4 and Table 4.1.
Table 4.1: Tested results of load-deflect
ion relationship
15
formula to calculate bending moment of flexure
(4-1)
(4-2)
P
a needs to adjust a
, use the mix C3 as describe in Chapter 2 and Chapter 3.
Cast 3 sets samples (9 beams) as accordance of ACI544 with width of 125
12mm, label of 2D12
-1; 2D12-2 and
16mm, label of 2D16
-1; 2D16-2 and
20mm, label of 2D20
-1; 2D20-2 and
Samples ready for test
Communications and Transportation
agreed with European
From tested results of 9 beams (3 sets of samples) determined values of loads
) as presented in
ion relationship
0
20
40
60
80
100
120
140
160
180
200
220
0 2 4 6 8 10 12 14 16 18 20 22 24 26
Tong hop
D20-1
D20-2
D20-3
D16-1
D16-2
D16-3
D12-1
D12-2
D12-3
do vong (mm)
Tai trong P
(KN)
Fig 4.4:
Relation of loads and deflections of tested beams
4.6. Comments
- Set 1 (beams used 2 rebars of 12mm)
with the use of tensile rebars of
0.723% in ratio of cross section, load to create a first crack is P=37,741 kN in
average, and deflection is =0,814mm
in average; The average maximum
load is P
max
= 80,262 kN in proportional of deflection of
=8,626mm;
end of the test =25mm and average load is P=66,34 kN.
- Set 2 (beams used 2 rebars of 16mm)
with the use of tensile rebars of
1.286% in ratio of cross section, load to create a first crack is P=37,889 kN in
average, and deflection is =0,843mm
in average; The average maximum
load is P
max
= 110.423 kN in proportional of deflection of
=8,743
end of the test =25mm and average load is P=99,95 kN.
- Set 3 (beams used 2 rebars of 20mm)
with the use of tensile rebars of
2.009% in ratio of
cross section, load to create a first crack is P=51,999 kN in
average, and deflection is =1,070mm
in average; The average maximum
load is P
max
= 193,188 kN in proportional of deflection of
=8,
end of the test =25mm and average load is P=183,12 kN.
- As in the graph of load-
deflection, before first crack occurred: Load
deflection relationship of the UHSC beams is similar as that of traditional
reinforced concrete beams. However, after cracking the traditional beams
occur a rapidly reduction
in hardness and the cracks penetrated into
compression area of the beam, this leads to suddenly collapsed
16
Relation of loads and deflections of tested beams
with the use of tensile rebars of
0.723% in ratio of cross section, load to create a first crack is P=37,741 kN in
in average; The average maximum
=8,626mm;
At the
with the use of tensile rebars of
1.286% in ratio of cross section, load to create a first crack is P=37,889 kN in
in average; The average maximum
=8,743
mm; At the
with the use of tensile rebars of
cross section, load to create a first crack is P=51,999 kN in
in average; The average maximum
=8,
712mm; At the
deflection, before first crack occurred: Load
-
deflection relationship of the UHSC beams is similar as that of traditional
reinforced concrete beams. However, after cracking the traditional beams
in hardness and the cracks penetrated into
compression area of the beam, this leads to suddenly collapsed
. In case of
UHSC beams, the deflection continues to develop but slow, load is increased
and then
maintain horizontally, not sudden fall down. This could be due to
energy is absorbed by steel fibre
resulting in a further resistance of load and
do not sudden collapsed.
Bending behaviour of the UHS
C reinforced rebars in tensile area, after
cracking, loa
d continues to develop, tensile resistant ability and deflection
develop and do not sudden collapsed. This demonstrates that the UHSC
beams own a higher toughness. The relationship and values of loads,
deflections are similar as results published in German
y and South Korea.
4.7. Calculate and analyse the experimental results
From deflection and load it is calculated w, M
cr
, R
ku
,
2
SETRA/AFGC, presented in Table 4.2.
Table 4.2: Calculated results of
values at points of specified opening wi
cracks (CMOD)
17
UHSC beams, the deflection continues to develop but slow, load is increased
maintain horizontally, not sudden fall down. This could be due to
resulting in a further resistance of load and
C reinforced rebars in tensile area, after
d continues to develop, tensile resistant ability and deflection
develop and do not sudden collapsed. This demonstrates that the UHSC
beams own a higher toughness. The relationship and values of loads,
y and South Korea.
2
as guidelines of
values at points of specified opening wi
dth
4.8. Analyse formula of flexural strength of the beam (
4.8.1.
Comparison in bending resistance of tested beams and beams
calculated by ACI-544 and Imam et al, Table 4.3
Table 4.3:
Comparison in bending resistance
** According to ACI-544 (
n
=0,003)
t
is calculated with a coefficient
K=0,00772.
t
= 0.00772.( l
f
/d
f
)
f
F
be
=0,00772 . (13/0,2) . 2 .
4,15=4,164 (MPa)
moment is calculated by the formula 4-1
** According to Imam et al 1995,
fibre UHPC, grade
calculated with a coefficient K=0,0138 and:
t
= 0.0138.( l
f
/d
f
).
f .
F
be
(MPa) = 0,0138.(13/0,2).2.4,15=7,444 (MPa),
moment is calculated by the formula 4-1.
Therefore, in terms of bending resistant
ability, experimental moment is
higher than moment as specified in ACI-
544 from 40% to 60%; and higher
than
the moment calculated by Imam from 10% to 23%. This proves that the
experimental results are fundamental to modify formula to calculate
18
)
Comparison in bending resistance of tested beams and beams
Comparison in bending resistance
is calculated with a coefficient
4,15=4,164 (MPa)
and
fibre UHPC, grade
≤ 100MPa, is
(MPa) = 0,0138.(13/0,2).2.4,15=7,444 (MPa),
ability, experimental moment is
544 from 40% to 60%; and higher
the moment calculated by Imam from 10% to 23%. This proves that the
experimental results are fundamental to modify formula to calculate
t
.
4.8.2. Adjust coefficient K in formula 4-
1 from experimental results
From formula 4-1:
Inferring:
=
.
.(
)
.
(
)
.(
)
(4-2)
And from
t
= K . ( l
f
/d
f
)
.
f .
F
be
(MPa) (4
-
Inferring: K
tn
=
t
/
f
.F
be
.(l
f
/d
f
) (4
-
Results calculated in according to formulas from (4-1) to
(4
t
, and coefficient K
tn
,
of the experimental beams at the specified points are
presented in Table 4.4;
Table 4.4: Calculated results of coefficient K
at the specified points
Value of K* in average at the time of the first crack
: K*=0,0051.
that at the time of first crack, steel fibre involves a very small load bearing
mainly depending on concrete and rebars.
Value of K* in average at W=0,3mm; K*=0,01516
19
1 from experimental results
-
3)
-
4)
(4
-4), the values M
tn
of the experimental beams at the specified points are
at the specified points
: K*=0,0051.
This proves
that at the time of first crack, steel fibre involves a very small load bearing
,
Value of K* in average at W=0,5mm; K*=0,01792
4.9. Draw graphs ( - ); (-); ( - w)
from experimental results in
accordance of SETRA/AFGC (as Figures from 4.5 to
4.8)
Fig 4.5: Graph of stress-strain at
compression area of the tested beams
Fig 4.6:
Graph of stress
)
of the tested beams
.
Fig 4.7: Graph of stress-opening
width crack ( - w) of the tested
beams
Fig 4.8:
Graph of stress
tension area of the tested beams
Relation -
is a fundamental used to calculate structures in according to
SETRA/AFGC.
4.10. Apply to analyse bending behaviour of I33m beam
4.10.1
. Methods to analyse bending behaviour of bridge UHSC beams in
the world
Recently, in the world, there are three method
s to calculate prestress
beams casted steel fibre reinforced concrete. Method bases on guideline of
SETRA/AFGC; method in accordance of DIN 1054-
1; and method based on
ACI-544.
It is possible to use rule of (p-w) in accordance of DIN-
1054 (Germany), or
use a relation
of according to SETRA/AFGC (France); or use of block
stress graph in accordance of ACI-544 of America.
The graph of stress-
strain obtained from experimental results is used to
establish to analyse bending behaviour of bridge beams and calculating
agreed with ACI-544 with a maximum deformation of 10
‰
20
from experimental results in
4.8)
Graph of stress
-deflection ( -
of the tested beams
Graph of stress
-strain (-) at
tension area of the tested beams
is a fundamental used to calculate structures in according to
4.10. Apply to analyse bending behaviour of I33m beam
. Methods to analyse bending behaviour of bridge UHSC beams in
s to calculate prestress
beams casted steel fibre reinforced concrete. Method bases on guideline of
1; and method based on
1054 (Germany), or
of according to SETRA/AFGC (France); or use of block
strain obtained from experimental results is used to
establish to analyse bending behaviour of bridge beams and calculating
‰
as in Figure 4.9.
Fig 4.9: Graph of stress-strain from
experimental results
4.10.2. Analyse of bending
resistance of bridge beams using prestress
UHSC grade 130MPa
+Formula
I cross section bended along
side, nominal bending resistant formula of the cross
section can be determined as below:
=
.
.
−
+
.
.
−
−
.
.
−
0,8.
.
(
−
)
.0,65.ℎ
.
−
+
.
.
(
ℎ −
)
.
+
+ Characteristics of the calculated beams, Table 4.5
Table 4.5:
Characteristics of the calculated beams
Material’s
properties
Unit Notation
D33-40
(h=1650)
D33-70
(h=1650)
D33
(h=1650)
Density of concrete Kg/m
3
y
c
2500 2500
2
Compressive
strength
MPa f
c
' 40 70
Flexural strength at
the time of first
crack in concrete
MPa
0 1,5
Flexural strength at
the time of opening
width crack of
w=0,3mm
MPa
0 5,0
Maximum flexural
strength
MPa
(max)
0 8,0
Elastic modulus Mpa E
b
30000 40000
50
Yield strength of
steel rebars
MPa f
y
350 350
Yield strength of
steel fibre
MPa F
sợi
0 2000
2000
+Describe I cross section (includes I33m beam,
h=1650mm
and I33m beam with h=1100mm)
4.10.3. Calculation and results
*
Check bending resistant ability in accordance of follow formula
21
experimental results
resistance of bridge beams using prestress
side, nominal bending resistant formula of the cross
+
−
(4-5)
Characteristics of the calculated beams
D33
-130
(h=1650)
D33-130h
(h=1100)
2
500 2500
130 130
3,5 3,5
8,50 8,50
24,2 24,2
50
000 50000
350 350
2000
2000
h=1650mm
in traditional
Check bending resistant ability in accordance of follow formula
:
22
M
u
≤ M
n
(4.6)
* Check shear resistant ability in accordance of SETRA/AFGC as the follow
formula:
V
n
= V
Rb
+ V
a
+ V
f
(4-7)
*Condition V
u
< V
n
(4-8)
* Check deflection of beam in accordance of TCVN 272-05 (calculate for
beam D33-130h; h=1100mm), obtain following result:
Limited deflection =L/800=40,375mm.
Assume that bridge structured from six beams with two lanes. Deflection
distribution coefficient is 0.75. Then, deflection dues to moving load:
=16,97*0,75=12,75mm<, satisfied.
Calculated results for each beam as presented in Table 4.6.
Table 4.6: Calculated results for each beam
Parameter
D33-40
(h=1650)
D33-70F
(h=1650)
D33-130
(h=1650)
D33-130h
(h=1100)
272-05 272-05 ACI 544
AFGC ACI 544
AFGC ACI 544
0,85 0,8 0,8 0,85 0,85 0,85 0,85
Safety
coefficient
1,43 1,3 1,3 1,25 1,25 1,25 1,25
f'
c
34 60 60 110,00 110,00 110,00 110,00
E
30000 40000 40000 50000 50000 50000 50000
(w=0,3)
0 0 5 8,5 8,5 8,5 8,5
(max)
0 0 8 24,2 24,2 24,2 24,2
1
0,75 0,65 0,65 0,65 0,65 0,65 0,65
b
2200 2200 2200 2200 2200 2200 2200
h
1650 1650 1650 1650 1650 1100 1100
bw
200 200 200 200 200 200 200
c
305,323
143,842 143,842 99,006 99,006 97,907 97,907
a
228,993
93,497 93,497 64,354 64,354 63,640 63,640
e
- 435,977 206,515 435,977
435,977
290,651
290,651
ΦM
n
1,19E+10
1,48E+10
1,41E+10
2,16E+10
2,08E+10
1,46E+10
1,52E+10
M
u
6,03E+09
6,03E+09
6,03E+09
6,03E+09
6,03E+09
5,52E+09
5,61E+09
ΦM
n
/M
u
1,96 2,46 2,33 3,57 3,44 2,64 2,70
Increased in
comparison of
1,25 1,19 1,82 1,75 1,34 1,37
I33-40
ΦV
n
1,57E+06
2,03E+06
2,67E+06
V
u
8,23E+05
8,86E+05
8,91E+05
9,88E+05
ΦV
n
/V
u
1,90 2,29 2,70
Increased in
comparison of
I33-40
1,20 1,42
From calculated results, draw graphs of Mn/Mu; Vn/
V
grade of concrete and height of beam as presented in Figures 4.10, 4.11.
Fig 4.10: Graph of Mn/Mu when
changing of grade of concrete and
height of beam
Hình 4.11:
Graph of
changing of grade of concrete and
height of beam
From investigated
contents of Chapter 4, the following comments
can be withdrawn:
- In experiment: Results obta
ined from 9 tested beams
125mm x 250mm x 2400mm according to ACI -
544,
relations between load-deflection (P-); load-
opening width crack
stress-strain (-) to use for designing beam.
- Propose formula
setting up from experiments:
(MPa), where K*=0,0159 -:-0,0179
-
Building a calculated model used for bending behaviour of bridge beam as
guided of Europe. Using model of ACI-
544 and experimental flexural
strength
from 8,5 to 9,65MPa when designing beam.
-
Analyse bending behaviour I33 bridge beam used steel fibre, strength from
120 to 140 MPa,
shown that it can be reduced the height of beam from 1.65
m down to 1.1 m (33% reduction) but maintaining bending, shear and
deflection resistant abilities.
CONCLUSION AND SUBJECTION
1. CONCLUSION
From references and experimental investigation in UHSC, the author
withdrawn the following conclusions:
23
2,06E+06
9,04E+05
2,27
1,19
V
u when changing
grade of concrete and height of beam as presented in Figures 4.10, 4.11.
Graph of
Mn/Vu when
changing of grade of concrete and
height of beam
contents of Chapter 4, the following comments
ined from 9 tested beams
(dimensions of
544,
drawn graphs of
opening width crack
(P-w); and
=K*.(l
f
/d
f
).
f
.F
be
Building a calculated model used for bending behaviour of bridge beam as
544 and experimental flexural
Analyse bending behaviour I33 bridge beam used steel fibre, strength from
shown that it can be reduced the height of beam from 1.65
m down to 1.1 m (33% reduction) but maintaining bending, shear and
From references and experimental investigation in UHSC, the author
24
The author collaborated with other members from University of
Communications and Transportation (UCT) in the use of quartz rock from
Thanh Son-Phu Tho and prepared sand and powder from the quartz rock. The
quartz sand and powder agreed with international guidelines.
Using domestic materials to manufacture UHSC, grade from 120 to 140
MPa with proportion as below:
Table: Proportion of UHSC investigated
Cement
Quartz
sand
Quartz
powder
Silica
fume
Superplasticiser
Steel
fibre
Water
1 1,011 0,133 0,230 0,025 0,177 0,241
1.3. Experimental results showed characteristics of UHSC are as in the
following Table:
characteristics Value
Specified compressive strength (28 days) (MPa) 139
Specified flexural strength at the time of first
crack (MPa)
12,06
Maximum specified flexural strength (MPa) 24,22
Elastic modulus (GPa) E
đh
=46,2 -:- 49,3
Slump (cm) 27
Flow (cm) 45- 64
1.4. Model of stress-strain used for calculation was built in accordance of
Europe with specified compressive strength from 119-139 MPa, strain 1 =
2%, 2 = 3,5‰, elastic modulus: 46,2 – 49,3 GPa.
1.5. Experimental investigation in the work of reinforced UHSC beam,
grade of UHSC 139 MPa, steel fibre R=2000 MPa, d=0.2mm, l=13 mm, fibre
content 2% in volume leads to the following results:
Building graphs of relations of (P-); (-); and ( - w) at points of nominal
opening width cracks based on experimental results using for bridge design.
Analyse bending behaviour, propose formula
setting up from experiments:
=K*.(l
f
/d
f
).
f
.F
be
(MPa), where K*=0,0159 -:-0,0179
Apply methods of calculation in bridge beams using UHSC as guided of (-)
SETRA/AFGC and ACI 544 with =8,5MPa.
1.6. Numbering analyse in bending resistance in accordance of limitation states
of bridge beam structure with cross section of I, L=33m, using UHSC grade of
139 MPa, steel fibre content of 2%. This shows that the steel fibre improves
bending resistance of beam 1.82 times, height of beam reduces from 1.65 m
down to 1.1 m (33% reduction).
1.7. The above contents prove that it can be applied of UHSC in bridge
structure. The experimental results can be used as references for researchers
in UHSC.
25
2. SUBJECTION
It can be applied UHSC in bridge beam, casted bridge slabs or other partial
members that need to specially strengthen in structure.
It can be used experimental methods, calculation models in design of bridge
beam.
3. FURTHER INVESTIGATIONS
It is necessary to analyse structures using UHSC under impact and repeat
loads.
In terms of structure, it is necessary to study behaviour of slabs and method
to calculate slab structures on elastic foundation applying for special
pavements.
It is necessary to investigate resistances of UHSC in radioactive, corrosion
and erosion applying for special constructions.