Luận văn : THỬ NGHIỆM QUI TRÌNH CHẾ BIẾN SỮA TƯƠI ĐÓNG CHAI TIỆT TRÙNG CÓ BỔ SUNG SỮA BỘT TẠI NHÀ MÁY NƯỚC GIẢI KHÁT FESTI part 10 pot
Bạn đang xem bản rút gọn của tài liệu. Xem và tải ngay bản đầy đủ của tài liệu tại đây (3.51 MB, 6 trang )
Đếm tất cả số các khuẩn lạc xuất hiện trên các đĩa sau khi ủ. Chọn
các đĩa có số đếm từ 25 – 250 để tính kết quả. Mật độ tổng coliform trong 1
ml mẫu được tính như sau:
ii
VfnVfn
++
=
N
(CFU/ml) A
11
Trong đó
A: số tế bào ( đơn vị hình thành khuẩn lạc) vi khuẩn trong 1 ml mẫu.
N: tổng số khuẩn lạc đếm được trên các đĩa đã chọn
n
i
: số lượng đĩa cấy tại độ pha loãng thứ i
V: thể tích mẫu (ml) cấy vào tong mỗi đĩa
f
i
: độ pha loãng tương ứng.
4.Số liệu thống kê:
pc-11
4.1Kết quả thống kê thí nghiệm 1
General Linear Model: MAU, MDUT versus NT
Factor Type Levels Values
NT fixed 3 A B C
Analysis of Variance for MAU, using Adjusted SS for Tests
Source DF Seq SS Adj SS Adj MS F P
NT 2 1.8519 1.8519 0.9259 3.11 0.049
Error 105 31.2222 31.2222 0.2974
Total 107 33.0741
Analysis of Variance for MDUT, using Adjusted SS for Tests
Source DF Seq SS Adj SS Adj MS F P
NT 2 16.1667 16.1667 8.0833 25.92 0.000
Error 105 32.7500 32.7500 0.3119
Total 107 48.9167
Least Squares Means
MAU MDUT
NT Mean SE Mean Mean SE Mean
A 2.000 0.09088 6.500 0.09308
B 2.000 0.09088 6.750 0.09308
C 1.722 0.09088 5.833 0.09308
Tukey Simultaneous Tests
Tukey 95.0% Simultaneous Confidence Intervals
4.2Kết quả thống kê thí nghiệm 2 (dùng phần mềm MINITAB)
General Linear Model: MAU, MUI, VI, MDUT versus NT
Factor Type Levels Values
NT fixed 9 A B C D E F G H I
Analysis of Variance for MAU, using Adjusted SS for Tests
Source DF Seq SS Adj SS Adj MS F P
NT 8 968.59 968.59 121.07 229.23 0.000
Error 207 109.33 109.33 0.53
Total 215 1077.93
Analysis of Variance for MUI, using Adjusted SS for Tests
Source DF Seq SS Adj SS Adj MS F P
NT 8 83.000 83.000 10.375 48.86 0.000
Error 207 43.958 43.958 0.212
Total 215 126.958
Analysis of Variance for VI, using Adjusted SS for Tests
Source DF Seq SS Adj SS Adj MS F P
NT 8 45.5370 45.5370 5.6921 11.12 0.000
Error 207 106.0000 106.0000 0.5121
Total 215 151.5370
Analysis of Variance for MDUT, using Adjusted SS for Tests
Source DF Seq SS Adj SS Adj MS F P
NT 8 42.2500 42.2500 5.2812 8.18 0.000
Error 207 133.5833 133.5833 0.6453
Total 215 175.8333
pc-12
Least Squares Means
MAU MUI VI
NT Mean SE Mean Mean SE Mean Mean SE Mean
A 1.958 0.14835 1.542 0.09407 2.833 0.14607
B 1.958 0.14835 1.583 0.09407 1.750 0.14607
C 6.750 0.14835 1.542 0.09407 1.833 0.14607
D 1.917 0.14835 1.625 0.09407 2.792 0.14607
E 1.833 0.14835 1.583 0.09407 1.708 0.14607
F 4.250 0.14835 1.583 0.09407 1.750 0.14607
G 4.208 0.14835 2.833 0.09407 2.375 0.14607
H 5.833 0.14835 2.875 0.09407 1.583 0.14607
I 7.458 0.14835 2.958 0.09407 1.792 0.14607
MDUT
NT Mean SE Mean
A 5.958 0.16398
B 6.667 0.16398
C 6.542 0.16398
D 5.792 0.16398
E 7.333 0.16398
F 6.375 0.16398
G 6.417 0.16398
H 6.792 0.16398
I 6.875 0.16398
Tukey 95.0% Simultaneous Confidence Intervals
KẾT QUẢ THỐNG KÊ THÍ NGHIỆM 2 (DÙNG PHẦN MỀM
statgraphics plus)
Ảnh hưởng của đường và sữa bột đến màu sắc sản phẩm
Analysis of Variance for Mau - Type III Sums of Squares
Source Sum of Squares Df Mean Square F-Ratio P-Value
MAIN EFFECTS
A:Duong 501.454 2 250.727 275.07 0.0000
B:Sua bot 384.148 2 192.074 210.73 0.0000
RESIDUAL 192.324 211 0.911489
TOTAL (CORRECTED) 1077.93 215
All F-ratios are based on the residual mean square error.
Ảnh hưởng của đường và sữa bột đến mùi sản phẩm
Analysis of Variance for Mui - Type III Sums of Squares
Source Sum of Squares Df Mean Square F-Ratio P-Value
MAIN EFFECTS
A:Duong 0.0277778 2 0.0138889 0.07 0.9358
B:Sua bot 82.75 2 41.375 197.60 0.0000
RESIDUAL 44.1806 211 0.209387
TOTAL (CORRECTED) 126.958 215
All F-ratios are based on the residual mean square error.
Ảnh hưởng của đường và sữa bột đến vị sản phẩm
pc-13
Analysis of Variance for Vi - Type III Sums of Squares
Source Sum of Squares Df Mean Square F-Ratio P-Value
MAIN EFFECTS
A:Duong 42.0093 2 21.0046 41.19 0.0000
B:Sua bot 1.92593 2 0.962963 1.89 0.1539
RESIDUAL 107.602 211 0.509961
TOTAL (CORRECTED) 151.537 215
All F-ratios are based on the residual mean square error.
Ảnh hưởng của đường và sữa bột đến mức độ ưa thích sản
phẩm
Analysis of Variance for MDUT - Type III Sums of Squares
Source Sum of Squares Df Mean Square F-Ratio P-Value
MAIN EFFECTS
A:Duong 28.0833 2 14.0417 20.53 0.0000
B:Sua bot 3.44444 2 1.72222 2.52 0.0830
RESIDUAL 144.306 211 0.683913
TOTAL (CORRECTED) 175.833 215
All F-ratios are based on the residual mean square error.
4.3Kết quả thống kê thí nghiệm 3
General Linear Model: MAU, TT versus NT
Factor Type Levels Values
NT fixed 3 A B C
Analysis of Variance for MAU, using Adjusted SS for Tests
Source DF Seq SS Adj SS Adj MS F P
NT 2 48.667 48.667 24.333 116.14 0.000
Error 105 22.000 22.000 0.210
Total 107 70.667
Analysis of Variance for TT, using Adjusted SS for Tests
Source DF Seq SS Adj SS Adj MS F P
NT 2 8.2963 8.2963 4.1481 25.41 0.000
Error 105 17.1389 17.1389 0.1632
Total 107 25.4352
Least Squares Means
MAU TT
NT Mean SE Mean Mean SE Mean
A 2.833 0.07629 1.750 0.06734
B 1.500 0.07629 1.306 0.06734
C 1.333 0.07629 1.083 0.06734
Tukey 95.0% Simultaneous Confidence Intervals
4.4Kết quả thống kê thí nghiệm 4
General Linear Model: MAU SAC versus NTHUC
pc-14
Factor Type Levels Values
NTHUC fixed 9 121-10P 121-15P 121-5P 125-1P 125-2P 125-3P 127-
1P
127-2P 127-3P
Analysis of Variance for MAU SAC, using Adjusted SS for Tests
Source DF Seq SS Adj SS Adj MS F P
NTHUC 8 69.6365 69.6365 8.7046 20.28 0.000
Error 27 11.5880 11.5880 0.4292
Total 35 81.2245
Least Squares Means for MAU SAC
NTHUC Mean SE Mean
121-10P 80.95 0.3276
121-15P 80.47 0.3276
121-5P 83.41 0.3276
125-1P 81.29 0.3276
125-2P 78.90 0.3276
125-3P 79.97 0.3276
127-1P 82.83 0.3276
127-2P 82.76 0.3276
127-3P 81.76 0.3276
Tukey 95.0% Simultaneous Confidence Intervals
General Linear Model: MUI VI, T THAI versus NT
Factor Type Levels Values
NT fixed 9 A B C D E F G H I
Analysis of Variance for MUI VI, using Adjusted SS for Tests
Source DF Seq SS Adj SS Adj MS F P
NT 8 70.0833 70.0833 8.7604 39.53 0.000
Error 207 45.8750 45.8750 0.2216
Total 215 115.9583
Analysis of Variance for T THAI, using Adjusted SS for Tests
Source DF Seq SS Adj SS Adj MS F P
NT 8 2.8333 2.8333 0.3542 1.62 0.120
Error 207 45.1667 45.1667 0.2182
Total 215 48.0000
Least Squares Means
MUI VI T THAI
NT Mean SE Mean Mean SE Mean
A 1.375 0.09609 1.167 0.09535
B 1.583 0.09609 1.250 0.09535
C 2.792 0.09609 1.375 0.09535
D 1.458 0.09609 1.167 0.09535
E 1.542 0.09609 1.417 0.09535
F 1.625 0.09609 1.292 0.09535
G 1.500 0.09609 1.500 0.09535
H 1.542 0.09609 1.375 0.09535
I 2.958 0.09609 1.458 0.09535
Tukey 95.0% Simultaneous Confidence Intervals
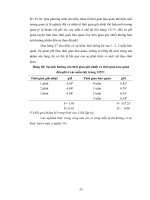
KẾT QUẢ THỐNG KÊ ẢNH HƯỞNG GIỮA CÁC CHẾ ĐỘ TIỆT TRÙNG VÀ
THỜI GIAN BẢO QUẢN ĐẾN pH
pc-15
Ở chế độ nhiệt 121
o
C
Analysis of Variance for pH - Type III Sums of Squares
Source Sum of Squares Df Mean Square F-Ratio P-Value
MAIN EFFECTS
A:Thoi gian 0,000800667 2 0,000400333 0,43 0,6696
B:Bao quan 0,122327 3 0,0407757 43,70 0,0002
RESIDUAL 0,005598 6 0,000933
TOTAL (CORRECTED) 0,128726 11
All F-ratios are based on the residual mean square error.
Ở chế độ nhiệt 125
o
C
Analysis of Variance for pH - Type III Sums of Squares
Source Sum of Squares Df Mean Square F-Ratio P-Value
MAIN EFFECTS
A:Bao quan 0,144112 3 0,0480372 337,23 0,0000
B:Thoi gian 0,000298667 2 0,000149333 1,05 0,4069
RESIDUAL 0,000854667 6 0,000142444
TOTAL (CORRECTED) 0,145265 11
All F-ratios are based on the residual mean square error.
Ở chế độ nhiệt 127
o
C
Analysis of Variance for pH - Type III Sums of Squares
Source Sum of Squares Df Mean Square F-Ratio P-Value
MAIN EFFECTS
A:Bao quan 0,0938677 3 0,0312892 113,24 0,0000
B:Thoi gian 0,00160017 2 0,000800083 2,90 0,1318
RESIDUAL 0,00165783 6 0,000276306
TOTAL (CORRECTED) 0,0971257 11
pc-16