Soil microbial indices as bioindicators of environmental changes in a poplar plantation pot
Bạn đang xem bản rút gọn của tài liệu. Xem và tải ngay bản đầy đủ của tài liệu tại đây (672.31 KB, 9 trang )
Ecological Indicators 5 (2005) 171–179
This article is also available online
at:
ww w .els e vie r .com/loca t e/ecolind
Soil microbial indices as bioindicators of environmental
changes in a poplar plantation
M.C. Moscatelli
a,
*
, A.
Lagomarsino
b
, S.
Marinari
a
, P. De
Angelis
b
, S.
Grego
a
a
Dip. di Agrobiologia e Agrochimica, Universita
`
della Tuscia, Viterbo,
Italy
b
Dip. di Scienze dell’Ambiente Forestale e delle sue Risorse, Universita` della Tuscia, Viterbo,
Italy
Accepted 20 February
2005
Abstract
An understanding of microbial biomass and microbial activity as part of belowground processes as affected by elevated
CO
2
is crucial in order to predict the long-term response of ecosystems to climatic changes. The ratio of biomass C to soil
organic C
(Cmic:Corg),
the metabolic quotient (the
specific
soil respiration of the microbial biomass, qCO
2
), the C
mineralization quotient (the fraction of total organic C mineralized throughout the incubation, qM), the microbial biomass
change rate quotient (qC) and soil inorganic nitrogen content were determined on soil samples taken during 3 years (Fall
2000–Fall 2003) in a poplar plantation exposed to increased atmospheric CO
2
by means of FACE (Free Air CO
2
Enrichment)
technique and nitrogen fertilization. A competition for nitrogen between plants and microrganisms, stronger in FACE plots,
induced a stress condition within microbial community. FACE treatment provided C for microbial growth (Cmic:Corg), but
reducing nitrogen availability, led to a higher microbial loss over time (qC). Nitrogen fertilization decreased microbial
mortality lowering energetic maintenance require- ments (qCO
2
) and induced a short-term shift in favour of microrganisms
more rapid in the use of the resources. The C mineralization quotient (qM) was not affected by either FACE nor fertilization
treatment meaning that the fraction of total organic carbon mineralized during the incubation period did not vary
significantly.
#
2005 Elsevier Ltd. All rights reserved.
Keywords: Soil; Elevated CO
2
; N fertilization; Microbial biomass; Soil respiration; Indices; Poplar
1.
Introduction
Elevated atmospheric CO
2
may affect the
microbe– soil–plant root system indirectly by
modifying soil water content and by increasing root
growth and rhizodepositions rates (Hungate et al.,
1997; Janssens
* Corresponding author. Tel.: +39 0761 357329;
fax: +39 0761 357242.
E-mail address: mcm@u n itus.it (M.C. Moscatelli).
et al., 1998). Therefore changes in microbial popula-
tion, community structure and activity of soil- and
rhizosphere-associated microrganisms are likely to
occur under elevated CO
2
(Sadowsky and Schorte-
meyer, 1997).
Microrganisms in fact are the driving force of
nutrient supply in soils and are the primary recipients
of increased photoassimilates from plants growing in
elevated atmospheric CO
2
. Moreover long-term
effects of elevated CO
2
on ecosystem carbon (C)
sequestration
1470-160X/$ – see front matter
#
2005 Elsevier Ltd. All rights reserved.
doi:10.1016/j.ecolind.2005.03.002
172 M.C. Moscatelli et al. / Ecological Indicators 5 (2005) 171–179
are highly dependent on the factors affecting C
sequestration in mineral soils and the interactions of
C with other nutrients (Cardon, 1996). Depending on
soil
C/N
ratio, the interactions of C and nitrogen (N)
are particularly important being N the nutrient most
commonly limiting plant and microbial growth and
soluble C the main energy source for microrganisms.
Terrestrial ecosystems response to CO
2
fertilization is therefore linked to the knowledge of
belowground processes and particularly those
performed by the microbial pool (Zak et al.,
2000). Microbiological parameters related to soil
weight are often correlated or combined as an
index in order to evaluate the significance of
microbial populations and microbia
l
activity in the
cycling of elements in soils of different ecosystems in
situ (Nannipieri, 1994). Brookes (1995) recommends
to combine microbial parameters in order to have an
‘‘internal control’’ such as biomass C as the
percentage of soil organic matter. The same author
also reports that combining microbial activity and
population measurements (biomass specific
respiration or metabolic quotient) appears to provide
more sensitive indications of soil pollution than either
activity or population measurements alone (see also
Dilly and Munch, 1998). Ecophysiological indices
(metabolic quotients) are generated by basing phy-
siological performances (respiration, growth/death,
carbon uptake) on the total microbial biomass per
unit time. Any environmental impact which will
affect members of a microbial community should be
detectable at the community level by a change of a
particular total microbial community activity which
can be quantified (qCO
2
, etc.) (Anderson, 2003).
The ratio
of
bio
ma
ss
C to soil organic C
(Cmic:Corg)
reflects the contribution of microbial biomass to soil
organic carbon (Anderson and Domsch, 1989). It also
indicates the substrate availability to the soil
microflora or, in reverse, the fraction of recalcitrant
organic matter in the soil; in fact this ratio
declines
as
the concentration of available organic matter
decreases (Brookes, 1995). The qCO
2
(the community
respiration per biomass unit or the metabolic
quotient) has been widely used in literature and is
originally based on Odum’s theory of ecosystem
succession. Although its reliability as a
bioindicator of disturbance or ecosystem
development has been recently criticised by some
authors, it is recognized to have valuable application
as a relative measure of how
efficiently
the soil
microbial biomass is
utilizing C resources and the degree of substrate
limitation for soil microbes (Wardle and Ghani,
1995; Dilly and Munch, 1998). The qM
(mineralization quotient) expresses the fraction of
total organic carbon mineralized throughout the
incubation time (Dommer- gues, 1960; Pinzari et al.,
1999). The qC (microbial biomass change rate
quotient) expresses the daily enrichment or loss of
soil microbial C and is calculated based on qD as
reported by Anderson and Domsch (1990). In the
present study Cmic:Corg, qCO
2
, qM, qC and
inorganic nitrogen content were determined on soil
samples taken during 3 years (Fall 2000–Fall 2003) in
a poplar plantation exposed to increased atmospheric
CO
2
by means of FACE (Free Air CO
2
Enrichment)
technique and fertilized during the last 2 years. Aim
of this paper was to assess the validity of the
microbial indices as bioindicators of microbial
processes induced by the two treatments: FACE and
N fertilization.
2.
Materials
and
method
s
2.1. Site
descripti
on
POPFACE experimental plantation and FACE
facility are located in central Italy, Tuscania (VT)
(42
8
22
0
N,
11
8
48
0
E, alt 150 m). The soil is
loam/silt- loam, total C range is 0.65–1.18%, total
N range is
0.11–0.14%. For further information on soil physical
and chemical properties, see Hoosbeck et al. (2004).
The mean values of precipitation and temperature
(calculated over a period of 14 years, from meteor-
ological data collected at
POPFACE
site) are of 14.1
8
C
and 818 mm, respectively. Clones of Populus
alb
a
,
Populus nigra and Populus euramericana
were grown, since 1999, in six 314 m
2
plots treated
either with atmospheric (control) or enriched (550
mmol mol
1
CO
2
) CO
2
concentration with FACE
technology
(Free Air
CO
2
Enrichment). Each plot
i
s
divided into
six
triangular sectors,
with two
se
ct
ors
per
pop
la
r
genotype: three species two nitrogen
levels. Nitrogen fert
ili
za- tion started in July 2002, it
was executed once per week during the growing
season and lasted for 16 weeks. Fertilizer was
supplied weekly in constant dose to a final total
amount of 212 kg N ha
1
. In the 2003 growing
season the fertilizer was supplied weekly in amounts
proportional to the growth rate for 20 weeks and
provided a total amount of 290 kg N ha
1
.
2.2. Soil sampling
After removal of litter layer two soil cores per
genotype (10 cm wide, 20 cm long) were taken inside
each of the three sectors in each plot, for a total of 36
soil cores in not fertilized sub-plots from October
2000 until October 2001 and 72 soil cores from June
2002 to October 2003 in fertilized and not fertilized
sub-plots. In June 2002 soil samples were collected
also in fertilized sub-plots although the addition of
nitrogen started the following month, however data
related to these samples are not considered in the
calculation of the fertilization effect. Soil samples
were immediately sieved
(<2
mm) and the moisture
content adjusted to 60% of their water holding
capacity (WHC). The soil samples were then left to
equilibrate at room temperature in the dark for 1 day
prior to biochemical analyses.
2.3. Chemical and microbiological
analy
ses
Inorganic nitrogen was assessed as the sum of
ammonium and nitrate: ammonium was extracted in
1 M KCl and was determined following Anderson
and Ingram (1993) while nitrate was determined
color- imetrically after extraction in 0.5 M K
2
SO
4
(Cataldo et al., 1975). Microbial biomass carbon
(MBC) was estimated following the Fumigation
Extraction (FE) method: two portions of moist soil
(20 g oven-dry soil) were weighed, the first one (non-
fumigated) was immediately extracted with 80 ml of
0.5 M K
2
SO
4
for
30 min by oscillating shaking at 200 rpm and filtered
(Whatman no. 42); the second one was fumigated for
24 h at 25
8C
with ethanol-free CHCl
3
and then
extracted as described above. Organic C in the
extracts was determined after oxidation with 0.4 N
K
2
Cr
2
O
7
at
100
8C
for 30 min (Vance et al., 1987). Microbial
biomass was calculated as follows: biomass C =
E
C
:k
EC
, where E
C
is the difference between organic C
extracted from fumigated soils and organic C
extracted from non-fumigated soils and k
EC
= 0.38.
POPFACE soil characteristics allow the use of this
factor since caution is required in soils recently
amended with organic matter (Harden et al., 1993a),
in waterlogged soils (Inubushi et al., 1991) and in
organic layers of forest soils (Scholle et al., 1992).
For measuring microbial respiration 20 g (oven-dry
basis) of moist sample were placed in 1 l stoppered
glass jars.
The CO
2
evolved was trapped, after 24, 72, 168, 240
h of incubation, in 2 ml 1 M NaOH and determined
by titration of the excess NaOH with 0.1 M
HCl (Badalucco et al., 1992). The CO
2
evolved
during the 10th day of incubation was used as
the basal respiration value because, after that period,
the soil reached a relatively constant hourly CO
2
production rate. Total organic carbon (TOC) was
estimated following the method reported by
Springer and Klee (1954). Microbial indices were
calculated as follows:
Cmic:Corg = mg of biomass C mg total organic
carbon
1
(Anderson and Domsch, 1989);
qCO
2
=
(
m
g
C-CO
2
basal
h
1
m
g
biomas
s
C
1
)
10
3
(Dilly and Munch, 1998);
qM = mg C-CO
2
cumulative
mg total organic carbon
1
(Pinzari et al., 1999);
qC = ((mg Cmic
t
1
mg Cmic
t
2
)/mg Cmic
t
1
/(t
2
t
1
)).
qC is calculated as reported by Anderson and
Domsch (1990) for qD. Positive and negative values
indicate a daily loss and an enrichment, respectively,
of microbial biomass carbon in the ecosystem.
These indices can be considered as potential
indicators of soil biological properties and processes
since they have been obtained analyzing soils through
laboratory standard procedures (sieving, controlled
temperature and moisture) that do not necessarily
reflect in situ conditions.
2.4. Statistical
analy
sis
Analysis of variance (ANOVA) was performed to
evaluate the main effects of FACE, fertilization, time
and their interaction on parameters analyzed. Data
were tested for normality with the Shapiro-Wilk
statistic and normalized with a square root transfor-
mation. qC was linearly transformed. A randomized
block design was applied using the general linear
model procedure with CO
2
, N, time and blocks as
factors. The two replicates for each plot were
averaged and the plot (three control plots and three
FACE plots) was the unit of replication. The
significance of FACE, time and the interaction
between the two factors was determined in not
fertilized plots (years 2000–2003, n = 36). The
significance of fertilization and its interaction
with FACE and time was determined in
174 M.C. Moscatelli et al. / Ecological Indicators 5 (2005) 171–179
Table 1
Inorganic N, Cmic:Corg (microbial quotient), qCO
2
(metabolic quotient), qM (C mineralization quotient) and MR24 h (microbial respiration
after 24 h) measured in control, control + N, FACE, FACE + N plots from Fall 2000 to Fall 2003
October 2000 June 2001 October 2001 June 02 October 2002 June 2003 October 03
Inorganic N (mg N-NH
4
+ N-NO
3
) g
1
Control 41.8 (4.1) 37.0 (1.2) 29.0 (3.2) 9.5 (0.7) 5.6 (0.4) 7.1 (0.6) 6.6 (0.7)
Control + N 13.2 (0.8) 26.9 (3.4) 11.4 (1.2) 12.8 (1.3)
FACE 42.1 (3.0) 35.6 (1.9) 9.9 (1.2) 6.9 (0.4) 3.9 (0.3) 3.8 (0.3) 5.4 (0.6)
FACE + N 9.0 (0.5) 13.4 (1.6) 14.7 (1.5) 14.8 (1.2)
Cmic:Corg (mg C biomass mg total organic C
1
)
Control 6.8 (0.5) 3.1 (0.4) 1.5 (0.1) 1.05 (0.2) 1.27 (0.1) 2.19 (0.2) 1.03 (0.1)
Control + N 1.01 (0.1) 1.38 (0.1) 1.79 (0.2) 1.58 (0.1)
FACE 9.1 (0.8) 5.1 (0.8) 2.2 (0.3) 1.65 (0.2) 1.43 (0.2) 2.16 (0.3) 1.32 (0.2)
FACE + N 1.76 (0.1) 1.32 (0.1) 2.34 (0.2) 1.83 (0.1)
qCO
2
(mg C-CO
2
h
1
mg C biomass
1
)
10
3
Control 0.78 (0.2) 3.36 (0.4) 2.46 (0.6) 5.44 (0.7) 2.17 (0.3) 3.11 (0.3) 3.86 (0.5)
Control + N 6.08 (1.1) 2.95 (0.6) 2.04 (0.4) 1.86 (0.2)
FACE 0.26 (0.1) 3.06 (0.6) 2.60 (0.5) 2.34 (0.5) 2.36 (0.3) 3.88 (0.4) 2.90 (0.4)
FACE + N 2.44 (0.3) 2.57 (0.5) 1.27 (0.2) 1.43 (0.2)
qM (mg C-CO
2
cumulative
mg total organic C
1
)
Control 1.54 (0.12) 0.87 (0.05) 0.99 (0.08) 1.05 (0.09) 0.91 (0.06) 1.41 (0.11) 0.85 (0.07)
Control + N 0.95 (0.05) 0.73 (0.07) 1.42 (0.09) 0.98 (0.07)
FACE 1.32 (0.12) 1.10 (0.1) 1.29 (0.13) 1.11 (0.11) 0.90 (0.10) 1.69 (0.12) 0.85 (0.06)
FACE + N 0.98 (0.07) 0.86 (0.15) 1.56 (0.12) 0.95 (0.06)
MR24 h (mg C-CO
2
g
1
24 h
1
)
Control 19.9 (3.0) 21.4 (2.1) 23.3 (1.6) 18.6 (2.3) 13.2 (1.7) 29.6 (2.3) 14.2 (1.1)
Control + N 16.5 (1.8) 22.8 (1.7) 74.1 (6.1) 27.7 (2.2)
FACE 16.7 (3.9) 28.7 (1.6) 25.4 (1.0) 17.0 (2.5) 14.5 (1.9) 26.2 (1.9) 14.7 (2.3)
FACE + N 19.5 (2.2) 24.4 (1.4) 59.9 (2.6) 28.1 (2.2)
Standard error is reported in parentheses.
fertilized and not fertilized plots from 2002 to 2003
(n = 72). Because there were no significant variations
due to the different poplar species, data from different
poplar genotypes were pooled together. When inter-
actions were not significant they were excluded from
analysis. In the results section the effect of FACE
and/ or fertilization treatments has been reported as
percentage variation with respect to the control. It
has been calculated on the average values of all
sampling dates for FACE effect and from October
2002 for the fertilization effect: June 2002 is, in fact,
not included since fertilization was started the
following month. All statistical analysis were per-
formed with the Systat 11.0 statistical software
package (SPSS Inc.).
3.
Results
A strong reduction of soil inorganic nitrogen was
observed, in not fertilized plots (FACE and control),
as
from the year 2000; the depletion of inorganic
nitrogen
was
about
85%
after 3 years (Table
1).
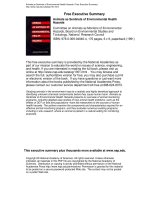
Moreover,
FACE treatment reduced inorganic
nitrogen availability, during the whole period of
study, with respect to control plots ( 20%, p
<
0.001) (Fig. 1A). The fertilization produced a
significant increase of soil inorganic nitrogen
(+123% in FACE and +160% in
control plots,
p
<
0.001) although
it did
not
re-establish the original
values of October 2000 (Fig. 1A and Table 1).
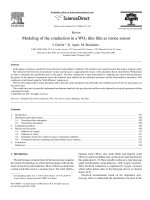
The trend of microbial quotient (Cmic:Corg ratio),
during the 3 years of observation, parallels the trend
of inorganic nitrogen, as also shown by the linear
regression on these two parameters in Fig. 2.
Cmic:Corg significantly decreases after the first year
and assesses its value to less than 2% until the end of
2003 (Table 1). However, although the contribution
of
microbial biomass to total organic carbon is very low
in this soil, FACE treatment induced a significant
increase of Cmic:Corg ratio in not fertilized plots
(+35%, p
<
0.001) (Fig. 1B).
Fig. 1. Mean percentage effects of treatments (FACE and N fertilization) calculated from 2000 to 2003 as relative variation with respect to
the control. (A) Inorganic nitrogen (N-NH
4
+ N-NO
3
), (B) microbial quotient (Cmic:Corg), (C) metabolic quotient (qCO
2
) and (D)
microbial respiration (24 h).
Tables 2 and 3 report the qC measured in not
fertilized (Fall 2000–Fall 2003) and fertilized plots
(Spring 2002–Fall 2003), respectively. The mean qC
for FACE plots during the whole period of study was
2.30 versus 0.60 mg biomass C loss mg biomass C
1
Fig. 2. Linear regression between inorganic nitrogen and Cmic:-
Corg measured from 2000 to 2003 in all plots (n = 121).
day
1
10
3
in control plots. Microbial loss thus
increased under elevated CO
2
where the depletion in
inorganic nitrogen seems to be the driving variable
of microbial physiological status, in fact the addition
of nitrogen lowers the qC ( 1.08 and 1.77 in
FACE + N and control + N, respectively) (Table 3).
The metabolic quotient is negatively and signifi-
cantly affected by FACE and N fertilization
treatments (Tables 1 and 4). Face lowers qCO
2
by
17% in not fertilized and by 23% in fertilized plots
while the addition of nitrogen causes a further
decrease of this index by 25 and 42% ( p
<
0.001) in
control and FACE plots, respectively (Fig. 1C). In
fact qCO
2
reaches, at the end of 2003, values of
1.86 and 1.43 for control + N and FACE + N
versus 3.86 and 2.90 for control and FACE (Table
1).
An inverse correlation is generally observed
between qCO
2
and Cmic:Corg ratio indicating a
strict interdependency between microbial growth and
176 M.C. Moscatelli et al. / Ecological Indicators 5 (2005) 171–179
Table 2
October 2000–March 2001
129
5.50 ( 0.29) 5.45 ( 0.31)
March 2001–June 2001
82
0.25 (
0.1)
4.89 ( 1.99)
June 2001–August 2001
98
2.13 ( 1.13) 1.22 ( 0.94)
August 2001–October 2001
53
7.85 ( 1.46) 3.90 ( 1.06)
October 2001–June 2002
240
0.98 ( 0.29) 0.78 ( 0.35)
June 2002–October 2002
145
0.47 ( 0.64)
2.75 ( 1.60)
October 2002–June 2003
220
1.36 ( 0.55)
2.20 ( 0.75)
June 2003–October 2003
156
2.54 ( 0.53) 3.27 ( 0.49)
June 2002–October 2002
145
0.47 ( 0.64)
2.75 ( 1.60) 1.69 ( 0.50)
2.72 ( 1.22)
October 2002–June 2003
220
1.36 ( 0.55)
2.20 ( 0.75)
5.70 ( 1.24)
3.82 ( 1.18)
June 2003–October 2003
156
2.54 ( 0.53) 3.27 ( 0.49) 0.78 ( 0.73) 1.21 ( 0.67)
Cmic:Corg
qC qCO
2
qM
MR24 h Inorganic N
*** *** *** *** *** ***
1 2
1
Microbial biomass change rate quotient (qC)
((mg
Cmic
t
mg
Cmic
t
)/mg
Cmic
t
/(t
2
t
1
)) 10
3
measured in FACE and control plots from
Fall 2000 to Fall 2003
Period Days FACE Control
Average 2.29 0.60
Standard error is reported in parentheses.
Table 3
3
Microbial
biomass
change rate quotient
(qC)
((
m
g
Cmic
t
1
m
g
Cmic
t
2
)/
m
g
Cmic
t
1
/(
t
2
t
1
))
10
plots from Spring 2002 to Fall 2003
measured in FACE + N and control + N
Period Days FACE Control FACE + N Control + N
Average 0.55
0.56
1.08
1.77
Standard error is reported in parentheses.
maintenance. In this study the correlation coefficient
between the two indices is r = 0.371 (n = 177;
p
<
0.001) and indicates that to a low
qCO
2
corresponds a high Cmic:Corg ratio.
In the attempt to get further insight into microbia
l
respiration activity, CO
2
output after 24 h of incuba-
tion and the cumulative value of CO
2
evolved after 10
days were considered. This was to emphasize the
known difference between the flush of CO
2
following
rewetting of soil and the basal respiration activity
(Wang et al., 2003). CO
2
production after 24 h
(MR24 h) is not modified by FACE treatment while
the fertilization caused a significant increase in both
FACE and control plots: the mean fertilization effect
was in fact +118 and +103% ( p
<
0.001),
respectively (Table 1 and Fig. 1D).
The C mineralization quotient (qM) provides
information on the fraction of total organic carbon
Table 4
Analysis of variance of Cmic:Corg, qC, qCO
2
, qM, microbial respiration (24 h) and inorganic nitrogen measured in FACE, control, FACE + N
and control + N from Fall 2000 to Fall 2003
Time
FACE
** ** *
ns ns
***
Fertilization ns
* ***
ns
***
***
Time FACE
***
ns
*
ns ns
*
Time fert. ns
* **
ns
***
*
FACE fert. ns ns ns ns ns ns
Time FACE fert. ns ns ns ns ns
**
ns: not significant.
*
p
<
0.05.
**
p
<
0.01.
***
p
<
0.001.
mineralized throughout the incubation time (10 days
in this study) (Dommergues, 1960; Pinzari et al.,
1999). qM ranged from 0.849 to 1.686 in FACE plots
and from 0.734 to 1.541
mg
C-CO
2
cumulative
TOC
1
in
control plots (Table 1). It was not affected by either
FACE nor fertilization treatments.
4.
Discus
sion
In many studies microbiological parameters were
correlated or combined as an index
(Nannipieri,
1994). Nevertheless ratios between microbiological
para- meters have often been used for evaluating the
microbial ecophysiology implying an interlinkage
between cell-physiological functioning under the
influence of environmental factors (Anderson, 2003).
In this study the responses of Cmic:Corg ratio,
qCO
2
(metabolic quotient) and qC (microbial change
rate quotient) to FACE and nitrogen fertilization
treatments, observed during 3 years, seemed to be
strongly affected by the nutritional status of the soil.
In fact a strong reduction of soil inorganic nitrogen
was detected and it was probably due to enhanced
plant uptake linked to the increase of biomass under
elevated CO
2
as shown by Calfapietra et al. (2003).
The microbial pool is strongly dependent on nitrogen
and probably suffered from a competition with plants
for this element (Allen and Schlesinger, 2004). This
nutritional ‘‘stress’’ could explain the decrease of
Cmic:Corg ratio, in not fertilized plots, to values
lower than 2.0 which is considered a critical
threshold for soils with neutral pH
(Anderson,
2003).
Moreover, it is reasonable to assume that a
nutritional unbalance between C and N may have
altered the physiological state of microbes with
changes in microbial size over time. The decrease of
qC after fertilization suggests an improvement of
microbial nutritional conditions as nitrogen in easily
available forms was provided.
Anderson (2003) refers to the same critical value,
mentioned for Cmic:Corg, also with reference to
qCO
2
, affirming that values higher than 2.0 of
metabolic quotient indicate an energetically less
efficient microbial community. Changes in nutrient
availability can modify microbial maintenance energy
requirements. The low Cmic:Corg and the high
qCO
2
reflect a less efficient use of organic substrates by
microbial biomass (Anderson, 2003; Pinzari et al.,
1999). Nutrients acquisition activity is an energeti-
cally expensive process particularly when microbes
are forced to degrade stable SOM to get new
available substrates. qCO
2
decreases under FACE
treatment but this reduction is more pronounced
when both treatments (FACE and N fertilization)
are applied. In fact, in FACE + N plots, C and
N are easily available in soil, therefore a more
efficient use of energy in nutrient acquisition activity
is permitted.
In elevated CO
2
environments it is assumed that,
because of faster root turnover or increased
production of root exudates, more C is available for
microbes (Cardon, 1996; Cheng, 1999;
Schortmeyer et al.,
2000). In another study that we performed at
POPFACE experimental station, elevated
CO
2
induced a significant increase of soil labile carbon
fractions (+19% of water soluble carbon and + 21%
of K
2
SO
4
-extractable carbon) indicating a
flux
of
soluble C forms that could lead to the microbial
immobiliza- tion process observed (Moscatelli et al.,
in press). We can therefore hypothesize that, in our
experimental conditions, the extra C made available
for microbes has been used to build up more
microbial biomass as the significant increase of
microbial quotient under FACE treatment suggests.
The response of microbial respiration to nitrogen
fertilization was significant in the first 24 h of
incubation, particularly in June 2003 when the
highest
increase of
this
parameter was recorded. At
this purpose it should be
considered
that June 2003
was just 1 month after the beginning of the
fertilization and this could be the reason for the
consistent flush of
CO
2
measured.
It is well known
that a sudden increase of CO
2
output from soil is
generally observed after the addition of easily
available organic substrates or of inorganic nitrogen
fertilizers to the soil. This phenomenon, the so-called
priming effect, is due to an increase of microbial
activity resulting in an acceleration of soil organic
matter mineralization as substrate and energy source
(Kuzyakov et al., 2000). The addition of inorganic
nitrogen could have provoked, likewise, a short-term
selection inside the microbial community in favour of
microrganisms more efficient in the use of the
nutrient resources. To support this hypothesis we
have evidence that microbial biomass C/N ratio
decreased signifi- cantly in June 2003 after
fertilization by 61% in control + N and 48% in
FACE + N indicating a shift towards bacterial
communities (data not shown).
178 M.C. Moscatelli et al. / Ecological Indicators 5 (2005) 171–179
The qM, or the potential C mineralization activity
(measured under controlled conditions of temperature
and humidity) as defined by Dommergues (1960), did
not show significant changes meaning that neither
FACE treatment nor N fertilization did affect the
capacity of the soil to store carbon.
In conclusion, as far as the aim of this paper is
concerned, microbial indices proved to be sensitive to
changes occurred to soil processes under FACE and
N fertilization. We hypothesize that a competition for
nitrogen between plants and microrganisms occurred,
strongly in FACE plots, and that it probably induced
a stress condition within microbial community.
FACE treatment provided C for microbial growth,
but reduced nitrogen availability and increased
microbia
l
loss. Nitrogen fertilization, conversely,
promoted soil microbial biomass enrichment,
lowering energetic maintenance requirements.
Although we need further investigation on microbial
C mineralization kinetics, particularly during a longer
incubation experiment, a not consistent change on
carbon sequestration soil capacity has been observed.
Ackno
wledg
ements
The authors are grateful to Prof. Giuseppe
Scarascia Mugnozza coordinator of EU EUROFACE
(EVR1-CT-2002-40027) and MIUR Centre of Excel-
lence ‘‘Forests and climate’’ projects for allowing the
use of POPFACE experimental station.
Ref
er
en
ces
Allen, A.S., Schlesinger, W.H., 2004. Nutrient limitations to soil
microbial biomass and activity in loblolly pine forests. Soil
Biol. Biochem. 36 (4), 581–589.
Anderson, J.M., Ingram, J.S.I., 1993. Colorimetric determination
of ammonium. In: Anderson, J.M., Ingram, J.S.I. (Eds.),
Tropical Soil Biology and Fertility, A Handbook of Methods.
2nd ed. CAB International, Wallingford, UK, pp. 73–74.
Anderson, T.H., 2003. Microbial eco-physiological indicators to
assess soil quality. Agric. Ecosyst. Environ. 98,
285–293.
Anderson, T.H., Domsch, K.H., 1989. Ratios of microbial
biomass
carbon to total organic-C in arable soils. Soil Biol. Biochem.
21,
471–479.
Anderson, T.H., Domsch, K.H., 1990. Application of eco-
physiolo- gical quotients (qCO
2
and qD) on microbial
biomasses from soils of different cropping histories. Soil Biol.
Biochem. 22, 251–255.
Badalucco, L., Grego, S., Dell’Orco, S., Nannipieri, P., 1992.
Effect of liming on some chemical, biochemical and
microbiological properties of acid soil under spruce (Picea
abies L.) Biol. Fert. Soils 14, 76–83.
Brookes, P.C., 1995. The use of microbial parameters in
monitoring soil pollution by heavy metals. Biol. Fert. Soils
19, 269–279.
Calfapietra, C., Gielen, B., Galema, A.N.J., Lukac, M., De Angelis,
P., Moscatelli, M.C., Ceulemans, R., Scarascia-Mugnozza, G.,
2003. Free-air CO
2
enrichment (FACE) enhances biomass pro-
duction in a short-rotation poplar plantation (POPFACE). Tree
Physiol. 23, 805–814.
Cardon, Z.G., 1996. Influence of rhizodepositions under ele
v
ated
CO
2
on plant nutrition and soil organic matter. Plant and Soil
187, 277–288.
Cataldo, D.A., Haroon, M., Schrader, L.E., Young, V., 1975.
Rapid colorimetric determination of nitrate in plant tissue by
nitration of salicylic acid. Commun. Soil Sci. Plant Anal. 6,
71–80.
Cheng, W.X., 1999. Rhizosphere feedbacks in elevated CO
2
. Tree
Physiol. 19, 313–320.
Dilly, O., Munch, J.C., 1998. Ratios between estimates of
microbial biomass content and microbial activity in soils. Biol.
Fert. Soils
27, 374–379.
Dommergues, Y., 1960. La notion de coefficient de mine
´
ralisation du carbone dans le sols. L’Agronomie Tropicale XV (1),
54–60.
Harden, T., Joergensen, R.G., Meyer, B., Wolters, V.,
1993a.
Miner-
alization and formation of soil microbial
biomass
in
a soil treated
with
simazine and
dinoterb.
Soil. Biol. Biochem. 25,
1273–1276.
Hoosbeck, M.R., Lukac, M., van Dam, D., Godbold,
D.L.,
Velthorst,
E.J., Biondi, F., Peressotti, A., Cotrufo, M.F., De
Angelis,
P
.,
Scarascia Mugnozza, G., 2004. More new carbon in
the mineral
soil of a poplar plantation under Free Air Carbon Enrichment
(POPFACE): Cause of increased priming effect? Global bio-
geochemical cycles. 18, GB104010.1029/2003GB002127.
Hungate, B.A., Chapin III, F.S., Zhong, H., Holland, E.A., Field,
C.B., 1997. Stimulation of grassland nitrogen cycling under
carbon dioxide enrichment. Oecologia 109, 149–153.
Inubushi, K., Brookes, P.C., Jenkinson, D.D., 1991. Soil microbial
biomass C, N and nynhydrin-N in aerobic and anaerobic soils
measured by the fumigation-extraction method. Soil Biol. Bio-
chem. 24, 737–741.
Janssens, I.A., Crookshanks, M., Taylor, G., Ceulemans, R.,
1998.
Elevated atmospheric CO
2
increases fine root production,
respiration, rhizosphere respiration and soil CO
2
efflux in Scots
pine seedlings. Global Change Biol. 4, 871–878.
Kuzyakov, Y., Friedel, J.K., Stahr, K., 2000. Review of
mechanisms and quantification of priming effects. Soil Biol.
Biochem. 32,
1485–1498.
Moscatelli, M.C., Lagomarsino, A., De Angelis, P., Grego, S., in
press. Effetto dell’elevata concentrazione di CO
2
atmosferica
sulla disponibilita
`
di forme di carbonio ottenute con diverse
modalita
`
di estrazione. Proceedings of the 50th Congress
of Italian Society of Soil Science (SISS).
Nannipieri, P., 1994. The potential use of soil enzymes as indi-
cators of productivity, sustainability and pollution. In: Pan-
khurst, C.E., Doube, B.M., Gupta, V.V.S.R., Grace, P.R.
(Eds.), Soil Biota: Management and Sustainable Farming
Systems. CSIRO, Australia, pp. 238–244.
Pinzari, F., Trinchera, A., Benedetti, A., Sequi, P., 1999. Use of
biochemical indices in the Mediterranean environment:
compar- ison among soils under different forest vegetation. J.
Microbiol. Meth. 36, 21–28.
Sadowsky, M.J., Schortemeyer, M., 1997. Soil microbial responses
to increased concentrations of atmospheric CO
2
. Global Change
Biol. 3, 217–224.
Scholle, G., Wolters, V., Joergensen, R.G., 1992. Effects of meso-
fauna exclusion on the microbial biomass in two moder
profiles. Biol. Fert. Soils 12, 253–260.
Schortmeyer, M., Dijkstra, P., Johnson, D.W., Drake, B.G., 2000.
Effects of elevated atmospheric CO
2
concentration on C and N
pools and rhizosphere processes in a Florida scrub oak com-
munity. Global Change Biol. 6, 383–391.
Springer, U., Klee, J., 1954.
Pru¨
fung der Leistungsfa¨higkeit
von einigen wichtigeren Verfahren zur Bestimmung des
Kohlenst-
offs mittels Chromschwefelsa¨ure sowie Vorschlag einer neuen
Schnellmethode. Z. Pflanzenerna¨hrung Bodenk. 64, 1.
Vance, E.D., Brookes, P.C., Jenkinson, D.S., 1987. An extraction
method for measuring soil microbial biomass C. Soil Biol.
Biochem. 19, 703–707.
Wang, W.J., Dalal, R.C., Moody, P.W., Smith, C.J., 2003.
Relation-
ships of soil respiration to microbial biomass, substrate
availability and clay content. Soil Biol. Biochem. 35, 273–
284.
Wardle, D.A., Ghani, A., 1995. A critique of the microbial
metabolic quotient (qCO
2
) as a bioindicator of disturbance and
ecosystem development. Soil Biol. Biochem. 27 (12), 1601–
1610.
Zak, D.R., Pregitzer, K.S., King, J.S., Holmes, W.E., 2000.
Elevated atmospheric CO
2
, fine roots and the response of soil
micro- organism: a review and hypothesis. New
Phytologist 147,
201–222.