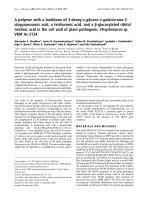
Holcim has strengthened its balance sheet and earning power and positioned itself as an attractive group in the international capital markets
Bạn đang xem bản rút gọn của tài liệu. Xem và tải ngay bản đầy đủ của tài liệu tại đây (2.71 MB, 86 trang )
MD & A
80
This discussion and analysis of the Group’s financial condition
and results of operations should be read in conjunction with
the shareholders’ letter, the individual reports for the Group
regions, the annual financial statements and the notes to the
consolidated financial statements.
Financial developments in the 2004 business year
Sharp rise in sales
Sales volumes in the cement/clinker segment increased signif-
icantly in 2004. All Group regions contributed to the higher
sales volumes. The full consolidation of Alpha Cement in Russia
at the end of 2003 had a key impact. The aggregates business
also showed a positive trend. The Canadian and Bulgarian
Group companies reported the highest absolute growth rates.
Ready-mix concrete sales significantly increased in the Group
regions Asia Pacific and Latin America.
Sales trend marred by a persisting dollar weakness
Sales increased by 8% in local currency terms, but in Swiss
franc terms our performance was impacted by the sharp
depreciation of the US dollar. Sales for the financial year 2004
totaled CHF 13,215 million which represents a 4.9% increase
on the previous year’s figure of CHF 12,600 million.
Operating EBITDA still increasing
Excluding foreign currency translation impacts, Holcim
achieved an improvement in operating EBITDA in all Group
regions. The further increase in the operating EBITDA margin
from 26.3% to 27.2% confirms that the company is gradually
and systematically moving closer to its defined target of 30%.
Positive margins thanks to strong operating result
Consolidated operating profit increased by 16.9%. This brought
internal growth on the level of operating profit to 20.2%,
significantly exceeding the original annual forecast of 8%.
The higher operating profit and the improved operating profit
margin were achieved despite higher energy costs thanks
to improved utilization rates for operating facilities and
further cost-cutting measures in the areas of administration
and production.
Increase in consolidated net income
In 2004, consolidated net income after minorities increased
by CHF 33.2% to CHF 914 million. This represents an increase
of 37.8% in local currency terms. The positive outcome was
mainly the result of higher operating income, a lower tax
burden and a smaller share of minorities in our consolidated
net income.
Sustainable cash flow from operating activities
Once again, cash flow from operating activities of CHF 2,622
million exceeded the previous year’s figure of CHF 2,619 mil-
lion by 0.1%. This was due to the strong operating result and
the decrease in net working capital.
Financial ratios within target range
2004 saw another big improvement in our financial ratios for
credit rating purposes. This applies both to the key figures
relating to interest coverage and to the ratio of funds from
operations to net financial debt. The main factors which con-
tributed to this were the impressive operating performance
and the successful capital increase by mid-2004, which
significantly strengthened the balance sheet. All key figures
exceeded budgeted expectations and are at the target range.
Strategic market expansion
Key features of 2004 were the strategic expansion of market
presence and focusing on the core business. In Europe,
Rohrbach Zement in Southern Germany and the cement plant
Pleven in Bulgaria were successfully integrated into the Group.
In Mexico, Holcim increased its stake in Holcim Apasco to
100% in two stages with a view to taking greater advantage of
the potential regional and financial integration with the rest
of the Group. In addition, Philippine-based Cemco Holdings –
in which Holcim holds a substantial stake – increased its share
in Union Cement Holdings in a transaction which raised
Holcim’s economic share in Holcim (Philippines) Inc. to 65.9%.
In 2004, the stake in Cimpor was reduced. Following the
termination of the total return swap agreement through the
acquisition of a 9.5% stake in Cimpor, a further 7.7% of the
shares were sold, leaving a 1.8% holding in the Portuguese
cement producer in Holcim’s ownership.
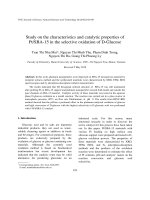
“Holcim has strengthened its balance sheet and
earning power and positioned itself as an attractive
group in the international capital markets.”
Theophil H. Schlatter
81
MD & A
1
Net income before minority interests and depreciation and amortization.
2
Net financial debt divided by shareholders’ equity including interests of minority shareholders.
3
Excludes the amortization of goodwill and other intangible assets.
4
Proposed by the Board of Directors.
5
Income statement figures translated at average rate; balance sheet figures at year-end rate.
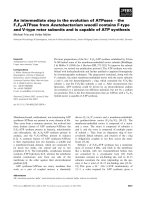
Key Figures Group Holcim
2004 2003 ±% ±% local
currency
Annual production capacity cement million t 154.1 145.2 +6.1
Sales of cement and clinker million t 102.1 94.3 +8.3
Sales of aggregates million t 104.2 95.9 +8.7
Sales of ready-mix concrete million m
3
29.3 27.0 +8.5
Net sales million CHF 13,215 12,600 +4.9 +8.0
Operating EBITDA million CHF 3,588 3,311 +8.4 +12.2
Operating EBITDA margin % 27.2 26.3
EBITDA million CHF 3,619 3,383 +7.0 +10.5
Operating profit million CHF 2,251 1,925 +16.9 +21.2
Operating profit margin % 17.0 15.3
Net income before minority interests
million CHF 1,153 932 +23.7 +27.8
Net income after minority interests million CHF 914 686 +33.2 +37.8
Net income margin % 6.9 5.4
Cash flow from operating activities million CHF 2,622 2,619 +0.1 +3.3
Cash flow margin % 19.8 20.8
RONOA % 14.1 12.2
Net financial debt
million CHF 6,810 8,299 –17.9 –12.9
Funds from operations
1
/net financial debt % 38.1 28.6
Shareholders’ equity including interests
of minority shareholders million CHF 10,708 9,499 +12.7 +18.9
Gearing
2
% 63.6 87.4
Personnel 31.12. 46,909 48,220 –2.7
Earnings per dividend-bearing share CHF 4.32 3.51 +23.1 +27.4
Fully diluted earnings per share CHF 4.28 3.49 +22.6 +27.0
Cash earnings per dividend-bearing share
3
CHF 5.95 4.96 +20.0 +23.5
Gross dividend million CHF 279
4
225 +24.0
Gross dividend per share CHF 1.25
4
1.15 +8.7
Principal key figures in USD (illustrative)
5
Net sales million USD 10,657 9,403 +13.3
Operating EBITDA million USD 2,894 2,471 +17.1
Operating profit million USD 1,815 1,437 +26.3
Net income after minority interests million USD 737 512 +43.9
Cash flow from operating activities million USD 2,115 1,954 +8.2
Net financial debt million USD 5,974 6,693 –10.7
Shareholders’ equity million USD 9,393 7,660 +22.6
Earnings per dividend-bearing share USD 3.48 2.62 +32.8
Principal key figures in EUR (illustrative)
5
Net sales million EUR 8,581 8,289 +3.5
Operating EBITDA million EUR 2,330 2,178 +7.0
Operating profit million EUR 1,462 1,266 +15.5
Net income after minority interests million EUR 594 451 +31.7
Cash flow from operating activities million EUR 1,703 1,723 –1.2
Net financial debt million EUR 4,394 5,320 –17.4
Shareholders’ equity million EUR 6,908 6,089 +13.5
Earnings per dividend-bearing share EUR 2.81 2.31 +21.6
MD & A
82
15,000
13,500
12,000
10,500
9,000
7,500
6,000
4,500
3,000
1,500
0
100
90
80
70
60
50
40
30
20
10
0
Million CHF
Million CHF and as % of net sales
5,000
4,500
4,000
3,500
3,000
2,500
2,000
1,500
1,000
500
0
30%
28%
26%
24%
22%
20%
18%
16%
14%
12%
10%
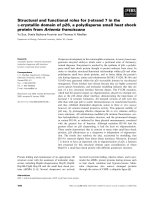
Net Sales
2000 2001 2002 2003 2004
Operating EBITDA
2000 2001 2002 2003 2004
24.9% 24.4% 25.7%
3,365 3,335 3 341 3,588
3,3113,341
27.2%26.3%
Million t
Sales of Cement and Clinker
2000 2001 2002 2003 2004
1,000
900
800
700
600
500
400
300
200
100
0
Million CHF
Net Income after Minority Interests
2000 2001 2002 2003 2004
686812
Million CHF and as % of net sales
2,500
2,250
2,000
1,750
1,500
1,250
1,000
750
500
250
0
30%
28%
26%
24%
22%
20%
18%
16%
14%
12%
10%
Cash Flow from Operating Activities
2000 2001 2002 2003 2004
2,557 2,402 2,388 2,619 2,622
18.9% 18.4% 20.8% 19.8%
17.6%
Million CHF and as % of net sales
2,500
2,250
2,000
1,750
1,500
1,250
1,000
750
500
250
0
30%
28%
26%
24%
22%
20%
18%
16%
14%
12%
10%
Operating Profit
2000 2001 2002 2003 2004
2,001
14.8% 14.3% 14.6%
1,945 1,903 1,925 2,251
17.0%15.3%
506886 914
13,531 13,644 13,010 12,600 13,215
94.384.380.6 90.5 102.1
83
MD & A
Financial strategy and targets
As one of the world’s leading cement producers, Holcim has
set itself ambitious financial targets. A high emphasis is placed
on focusing on the core businesses of cement, aggregates
and concrete. Another priority is to achieve broad geographical
diversification to ensure a healthy and sustainable balance.
Focusing on these points will enable Holcim to continue to
grow and expand its global presence in the future. Efficiency-
boosting measures are other factors which allow the Group
to achieve its financial targets on a global basis.
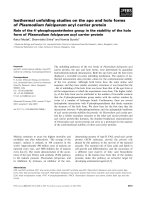
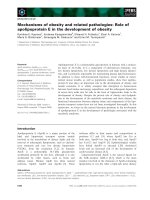
Geographical diversification
In 2004, Holcim once again strengthened its geographical
presence. The three Group regions Africa Middle East, Asia
Pacific and Europe were able to raise their share of overall
sales by 1.3, 0.5 and 0.2 percentage points, respectively.This
further percentage rise in sales is mainly attributable to
increases in construction activity in individual Group regions.
Europe remains the most dominant region based on net sales
with a weighting of 34.8% (2003: 34.6%). Group region Latin
America saw its share of sales decrease by 1.8 percentage
points to 20.4%, while Group region North America decreased
by 0.2 percentage point to 19.3%. In both regions the decline
is mainly due to the decrease in the value of the US dollar,
which reduced the value of sales in Swiss franc terms by 7.9%
and 5%, respectively.
The strategy of focusing our business firmly on growth mar-
kets is reflected in net sales. In 2004, the share of net sales
attributable to emerging markets increased by 1 percentage
point to 48.7%.
As a result of changes in the regional composition of net sales,
the breakdown of operating profit by Group regions reflected
the following trend: Europe’s share increased by 4.8 per-
centage points to 28.8%. Africa Middle East saw its share rise
by 1.8 percentage points to 16.1%. North America’s share
increased by 0.6 percentage point to 14.2%. In contrast,
Group region Latin America saw its share of sales decrease
by 6.8 percentage points to 31.4%, while Group region
Asia Pacific reflected a 0.4 percentage point decline to 9.5%.
1
Beginning 2002 the figures of service companies have been regrouped
from geographical regions to Corporate.
100%
90%
80%
70%
60%
50%
40%
30%
20%
10%
0%
Net Sales Mature versus Emerging Markets
2000 2001 2002
2003 2004
43.9% 45.6% 47.0% 47.7% 48.7%
56.1% 54.4% 53.0% 52.3%
Mature Markets Emerging Markets
51.3%
100%
90%
80%
70%
60%
50%
40%
30%
20%
10%
0%
Net Sales per Group Region
2000 2001 2002 2003 2004
Europe
1
North America
1
Latin America Africa Middle East
Asia Pacific
1
27.2% 27.2% 24.7% 20.4%22.2%
22.9% 22.4% 20.9% 19.3%19.5%
33.3% 32.3% 32.8% 34.8%34.6%
8.7%
8.6%
13.0% 14.2%13.7%
8.2%
11.3%
10.0%
8.4% 9.4%
MD & A
84
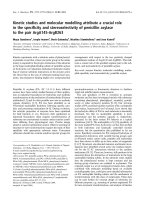
Focusing on our core business
Focusing on the core business and on strategic acquisitions
over the past five years has led to a steady decline in the
segment other products/services. The 0.4 percentage point
decrease in this segment’s share of net sales mainly reflects
the disposal of the Swiss company Eternit on November 10,
2003.
Net sales in the segment cement/clinker increased by 5.7%
(CHF 533 million). Factors which had a positive influence
were the first-time consolidation of Alpha Cement in Russia
(CHF 130 million) and Rohrbach Zement in Southern Germany
(CHF 58 million), the acquisition of the cement plant Pleven in
Bulgaria (CHF 15 million) and internal growth totaling CHF 702
million. The currency translation effect reduced net sales by
CHF 379 million.
The segment aggregates/concrete saw sales grow by 7.1%
(CHF 242 million), thanks mainly to volume increases. Net sales
were negatively affected by the currency translation effect
of CHF 28 million, which was largely due to the decrease in
the value of the US dollar against the Swiss franc. All Group
regions made contributions to the positive price and volume
trends.
Holcim constantly reviews the strategic relevance of its non-
consolidated interests optimizing its portfolio when necessary.
As a result, the Group reduced its shareholding in Cimpor by
8.3% during the financial year. Holcim still holds a 1.8% stake
in the Portuguese cement producer.
The strategic focus on the return on net operating assets
(RONOA) also had a positive impact. A 1.9 percentage points
increase in this key figure to 14.1% bears witness to the solid
performance improvement. Particular mention should be
made of Group region Africa Middle East, which achieved a
very strong improvement in 2004, reaching a figure in excess
of 30%. One particularly crucial factor behind the Group-wide
improvement is the rise in operating profit.
100%
90%
80%
70%
60%
50%
40%
30%
20%
10%
0%
Net Sales per Segment
2000 2001 2002 2003 2004
Cement/Clinker
Aggregates/Concrete
Other products/Services
64.4% 68.4% 69.8% 69.6% 69.6%
24.5% 24.1% 25.4% 25.8%
7.1% 6.1% 5.0%
4.6%
12.3%
23.3%
Clinker capacity utilization
Clinker capacity utilization benefited from improvements in
efficiency and the expansion of production facilities. For the
Group as a whole, the respective figure increased from 79% to
85%.
The improvement in capacity utilization was led by Group
regions Africa Middle East and Asia Pacific with increases of
7.7 and 7.4 percentage points, respectively.
In Group region Africa Middle East, the improvement in capac-
ity utilization was mainly achieved thanks to rising cement
sales in Lebanon and Morocco. The construction of a new
cement mill in Ras El Ma, Morocco, in 2003 and the commis-
sioning of additional silo facilities, including state-of-the-art
packaging lines, made it possible to close down the less
efficient grinding facility in Doukkarat. A further sharp rise in
demand also led to an improvement in capacity utilization in
South Africa. At the Dudfield plant in South Africa, it was pos-
sible to expand the production base and optimize operational
efficiency, which led to an improvement in capacity utilization.
The measures referred to had an impact on a full financial year
for the first time.
The increase in Group region Asia Pacific is mainly attributable
to efficiency enhancements and higher cement sales in the
individual countries.
85
MD & A
Financial ratios
2004 2003 Holcim target
Funds from operations
1
/net financial debt 38.1% 28.6% > 25%
Gearing 63.6% 87.4% 80–100%
EBITDA net interest coverage 7.2u 6.8u > 5u
EBIT net interest coverage 4.3u 3.9u > 3u
1
Net income before minority interests and depreciation and amortization.
Committed to a strong rating
Holcim Ltd’s current credit rating by Standard & Poor’s is
“BBB+” for the long-term and “A-2” for the short-term. In
response to the takeover of Aggregate Industries announced
on January 20, 2005 and the entry into the Indian market,
Standard & Poor’s has placed Holcim on “CreditWatch” status
with negative implications. Holcim still places great importance
on having a strong rating. Following these transactions, the
Group aims to re-achieve its main financial targets by the end
of 2006 at the latest.
The table below shows Holcim’s main financial achievements
for the financial year 2004.
Performance-related profit-sharing based on value
enhancement within the Group
In recent years, Holcim has systematically focused on value
enhancement, introducing instruments which measure per-
formance in the Group and enable its management personnel
to participate directly in the targets set. The twin pillars on
which this concept is founded are the targets for the operat-
ing EBITDA margin and Holcim Value Added (HVA). HVA is an
indicator derived from the difference between earnings before
interest and taxes (EBIT) and standard capital costs (capital
invested multiplied by imputed interest rates).
Since last year, the annual budgeted changes in HVA and the
operating EBITDA margin are the financial targets which have
formed a key part of the performance-related remuneration
of the top 250 executive personnel Group-wide.
These financial targets provide the basis for calculating the
performance-related bonus which is paid partly in the form of
Holcim registered shares which are subject to a three-year
restriction period. Our aim with this program is to achieve a
uniform focus on the common target of a sustainable increase
in the Group’s performance and value.
Key factors influencing the 2004 financial statements
Sales growth and profitability accelerated by internal growth
Net sales increased by CHF 615 million to CHF 13,215 million,
the bulk of the increase (7.2% or CHF 908 million) being attrib-
utable to internal growth. Operating profit advanced by
CHF 326 million or 16.9% to CHF 2,251 million. The gratifying
improvement in profitability was attributable first and fore-
most to the particularly high level of internal growth totaling
CHF 388 million or 20.2%.
Change in the scope of consolidation increased net sales by
CHF 99 million and operating profit by CHF 20 million. Curren-
cy translation effects reduced net sales by CHF 392 million and
operating profit by CHF 82 million. This is mainly due to the
weaker US dollar, which decreased by 7.5% against the Swiss
franc.
Effect of currencies and inflation on operations
The Group operates in more than 70 countries and generates
a predominate part of its results in currencies other than the
Swiss franc. Only about 5% of net sales are generated in Swiss
francs. Statements of income and cash flow statements in
foreign currencies are translated at the average exchange
rate for the year, whereas the balance sheet is translated at
year-end exchange rates.
The once again impressive increase in operating profit and
cash flow, particularly in local currencies, is the result of the
corporate strategy being systematically implemented in recent
years, coupled with the measures taken to improve efficiency.
The negative exchange rate fluctuations of 2004 are reflected
less significantly in the balance sheet positions than in the
income statement. As at the balance sheet date, the US dollar
and the Euro had declined by 8.1% and 0.6%, respectively
against the Swiss franc. Currency movements negatively
impacted shareholders’ equity by CHF 537 million, lowered
minority interests by CHF 49 million and net financial debt
by CHF 419 million.
MD & A
86
2004 2003 ±% ±% in local
currency
Million CHF
Net sales 13,215 12,600 +4.9 +8.0
Operating profit 2,251 1,925 +16.9 +21.2
Net income after minority interests 914 686 +33.2 +37.8
Cash flow from operating activities 2,622 2,619 +0.1 +3.3
In order to reduce the effects of inflation and currency devalu-
ation, Group companies in a number of developing countries
and emerging markets used one of the world’s major curren-
cies, usually the US dollar, for reporting purposes.
Compared with the previous year, the average exchange rate
value of the US dollar against the Swiss franc weakened by
7.5% to CHF 1.24 (2003: 1.34). At a rate of CHF 1.54 (2003: 1.52),
the Euro was slightly stronger (+1.3%) and therefore proved
much more stable than the US dollar. An overview of the
movements of the most important Group currencies against
the Swiss franc can be found in the “Notes to the Consolidated
Financial Statements” on page 111.
An analysis of the results that were achieved therefore calls
for a differentiated approach that excludes the effects of
significant currency movements. The following comments
illustrate the impact of these currency fluctuations on the key
items of the consolidated statement of income and on cash
flow from operating activities.
2004 2003 ±% ±% in local
currency
Million CHF
Shareholders’ equity including minority interests 10,708 9,499 +12.7 +18.9
Net financial debt 6,810 8,299 –17.9 –12.9
Gearing 63.6% 87.4%
87
MD & A
Sensitivity analyses of currency effects in USD and EUR
As explained, the changes in the value of the US dollar and the
Euro had significant implications on the consolidated financial
statements. The currency effect of the US dollar and the Euro
on the most important key figures of the consolidated finan-
cial statements and cash flow from operating activities is pre-
sented on the basis of the following sensitivity analyses.
A hypothetical decline in the US dollar in relation to the Swiss
franc of one centime or 0.81% has a negative effect on net
sales and operating profit of CHF 37 million and CHF 7 million,
respectively. Net income after minority interests and cash flow
from operating activities are reduced by CHF 3 million and
CHF 9 million, respectively.
The same hypothetical decline in the Euro by one centime
or 0.65% has a negative effect on net sales and operating
profit of CHF 24 million and CHF 2 million, respectively. Net
income after minority interests and cash flow from operating
activities are reduced by CHF 1 million and CHF 5 million,
respectively.
Financial ratios in USD USD/CHF USD/CHF ± in
at 1.24 at 1.23 million CHF
Million CHF
Net sales 13,215 13,178 –37
Operating profit 2,251 2,244 –7
Net income after minority interests 914 911 –3
Cash flow from operating activities 2,622 2,613 –9
Financial ratios in EUR EUR/CHF EUR/CHF ± in
at 1.54 at 1.53 million CHF
Million CHF
Net sales 13,215 13,191 –24
Operating profit 2,251 2,249 –2
Net income after minority interests 914 913 –1
Cash flow from operating activities 2,622 2,617 –5
MD & A
88
2004 2003 ± ± due to
changes in
the scope of
consolidation
Million CHF
Sales of cement and clinker million t 102.1 94.3 +7.8 +4.1
Net sales million CHF 13,215 12,600 +615 +99
Operating profit million CHF 2,251 1,925 +326 +20
Cash flow from operating activities million CHF 2,622 2,619 +3 +24
Changes in the scope of consolidation and increase
in shareholdings
Holcim will steadily continue to expand in various markets
and focus on its core businesses. 2004 saw further expansion
of the group of consolidated companies, as well as increases in
the size of shareholdings in individual Group companies.
In Europe, Rohrbach Zement in Southern Germany has been
fully consolidated since January 1, 2004. The plant in Dottern-
hausen has an annual capacity of 0.6 million tonnes of
cement and 0.3 million tonnes of special binding agents.
In May 2004, the cement plant Pleven in Bulgaria was
acquired and integrated into the Group. The transaction has
enabled Holcim to expand its market presence in Bulgaria
decisively. Alpha Cement in Russia, which was consolidated on
December 31, 2003, has been included in the consolidated
income statement over the full year for the first time.
In Mexico, Holcim increased its stake in Holcim Apasco to
100% with a view to taking advantage of the potential
regional and financial integration with the rest of the Group.
In Thailand, Siam City Cement has acquired 12.5 million of
its own shares under a share repurchase scheme, increasing
Holcim’s consolidated shareholding in this Group company
to 35.7%.
In the reporting period, Philippine-based Cemco Holdings,
in which Holcim holds a substantial stake, acquired Union
Cement Holdings shares held directly and indirectly
by the Phinma Group. This was the final step in a complex
transaction related to the merger of our two Philippine
Group companies and increased Holcim’s economic stake in
Holcim (Philippines) Inc. to almost two-thirds.
In August 2004, Holcim US wound up the Holnam Texas
Limited Partnership and bought out the partners in this com-
pany. The Midlothian plant is now fully owned by Holcim US.
Shortly before the year-end, Holcim acquired a majority
holding in Cemento de El Salvador. The company, which was
included in the consolidated financial statements for the first
time as of December 31, 2004, did not yet have any effect on
the consolidated statement of income. The full consolidation
took place in the context of achieving the control as per
December 2004. Cemento de El Salvador owns two cement
plants in the northern part of El Salvador with a total annual
installed capacity of 1.7 million tonnes of cement. With this
transaction Holcim has taken a step toward strategically
strengthening and increasing efficiency of its network of
positions in Central America.
The following table shows the effects of changes in the scope
of consolidation on sales of cement and clinker, net sales,
operating profit and cash flow from operating activities.
89
MD & A
Cement capacity
Cement capacity increased by a total of 8.9 million tonnes or
6.1% to 154.1 million tonnes in financial year 2004. The first-
time consolidation of Cemento de El Salvador led to a rise of
1.7 million tonnes. In Europe, new consolidations of Rohrbach
Zement in Southern Germany (0.6 million tonnes) and of the
Pleven plant in Bulgaria (0.7 million tonnes) as well as the
commissioning of a new mill in the Alesd plant in Romania
(1 million tonnes) resulted in an increase in capacity. This
financial year also saw the commissioning of the Thi Vai
grinding facility in Vietnam, which has an annual capacity of
1.3 million tonnes. The closure of the Geisingen cement plant
in Southern Germany reduced capacity by around 0.6 million
tonnes.
Sales volumes
During the year, sales volumes increased significantly in all
three core businesses (cement, aggregates and ready-mix
concrete). Aggregates recorded the biggest increase, with an
8.7% rise to 104.2 million tonnes. Cement deliveries advanced
by 8.3% to 102.1 million tonnes and ready-mix concrete
deliveries increased by 8.5% to 29.3 million m
3
. Volumes were
significantly affected by the newly consolidated companies
in Group region Europe, which alone accounted for 4.2% of
the increase in cement sales. Newly acquired quarries in the
Canadian province of Ontario led to a 2.6% increase in sales
in aggregates.
Statement of Income of Group Holcim
2004
in % of
2003
in % of ±%
net sales net sales
Million CHF
Net sales 13,215 100.0 12,600 100.0 +4.9
Production cost of goods sold (6,617) (50.1) (6,564) (52.1) –0.8
Gross profit 6,598 49.9 6,036 47.9 +9.3
Distribution and selling expenses (2,980) (22.6) (2,793) (22.2) –6.7
Administration expenses (1,050) (7.9) (1,016) (8.1) –3.3
Other depreciation and amortization (317) (2.4) (302) (2.4) –5.0
Operating profit 2,251 17.0 1,925 15.3 +16.9
Other (expenses) income net (76) (0.5) 12 0.1 –733.3
EBIT 2,175 16.5 1,937 15.4 +12.3
Financial expenses net (512) (3.9) (495) (3.9) –3.4
Net income before taxes 1,663 12.6 1,442 11.4 +15.3
Income taxes (510) (3.9) (510) (4.0) –
Net income before minority interests 1,153 8.7 932 7.4 +23.7
Minority interests (239) (1.8) (246) (2.0) +2.8
Net income after minority interests 914 6.9 686 5.4 +33.2
Consolidated statement of income
MD & A
90
Net Sales, Production Cost of Goods Sold, Gross Profit
2004 in % of 2003 in % of ±% ±% in local
net sales net sales currency
Million CHF
Net sales 13,215 100.0 12,600 100.0 +4.9 +8.0
Material expenses (1,673) (12.7) (1,562) (12.4) –7.1 –9.1
Fuel expenses (549) (4.2) (493) (3.9) –11.4 –17.0
Electricity expenses (715) (5.4) (659) (5.2) –8.5 –13.1
Personnel expenses (1,100) (8.3) (1,063) (8.4) –3.5 –5.3
Depreciation (811) (6.1) (875) (6.9) +7.3 +3.7
Other production expenses
1
(1,769) (13.4) (1,912) (15.2) +7.5 +4.7
Production cost of goods sold (6,617) (50.1) (6,564) (52.1) –0.8 –3.7
Gross profit 6,598 49.9 6,036 47.9 +9.3 +12.6
Net sales
The 4.9% increase in net sales to CHF 13,215 million is primarily
attributable to 7.2% internal growth. However, this increase
was reduced by a negative currency effect of 3.1%. Changes in
the scope of consolidation account for 0.8%. Strong demand
for cement resulted in higher sales in Group regions Africa
Middle East (22.2%) and Asia Pacific (15%). North America post-
ed 8.9% internal growth thanks to continuing strong construc-
tion activity.
In terms of product segments, the segment cement/clinker
accounted for 69.6% of net sales, while aggregates/concrete
and other products/services accounted for 25.8% and 4.6%,
respectively.
Gross profit
In 2004, the gross profit margin improved by 2 percentage
points to 49.9% of net sales. Despite a marked increase in cost
pressure because of higher energy prices, improved utilization
of production facilities and further cost-cutting measures
led to an overall positive result. The US dollar’s devaluation
against the Swiss franc also had a negative impact on gross
profit.
1
Including change in inventory.
Net Sales per Group Region
2004 2003 ±% ±% in local ±% internal
currency growth
Million CHF
Europe 4,744 4,441 +6.8 +5.7 +4.9
North America 2,630 2,507 +4.9 +9.9 +8.9
Latin America 2,785 2,842 –2.0 +5.9 +5.5
Africa Middle East 1,540 1,280 +20.3 +23.4 +22.2
Asia Pacific 1,945 1,760 +10.5 +15.6 +15.0
Corporate/Eliminations (429) (230)
Holcim Group 13,215 12,600 +4.9 +8.0 +7.2
91
MD & A
Operating EBITDA margin
The operating EBITDA margin increased by 0.9 percentage
point from 26.3% to 27.2%. Excluding the negative currency
effect the margin would have come to 27.3%.
In addition to lower production expenses, the Group also
achieved a further 0.2 percentage point reduction in adminis-
trative expenses in relation to net sales. Efficiency-boosting
measures also had an impact, including in particular
the Shared Service Centers introduced for individual Group
regions.
The most significant contributions to the improvement in
margins came from Group regions North America and Europe,
which increased their regional operating EBITDA margins by
1.6 and 1.4 percentage points, respectively. While rising prices
and higher sales volumes enabled North America to report
a better operating EBITDA margin, Europe’s improved results
were attributable in particular to strong growth in eastern
and southeastern Europe and good performances in Spain
and Italy. The first-time consolidation of the company in Russia
had a 0.1 percentage point negative impact on the margin at
Group level.
At 37.2%, Latin America’s operating EBITDA margin is also the
highest for the period under review. However, the 1.5 percent-
age points decrease compared with the previous year had a
0.4 percentage point negative impact on the Group margin.
The decline is mainly attributable to a combination of higher
electricity costs as a result of the rise in gas prices and
stronger price pressure in Brazil and Mexico.
The regional operating EBITDA margin in Africa Middle East
increased by 0.8 percentage point due to the positive effects
of higher sales prices and volumes in Egypt and South Africa.
In Group region Asia Pacific, increases in volumes and higher
sales prices in the Philippines were not sufficient to compen-
sate for the pressure on prices in Thailand and Vietnam.
45%
40%
35%
30%
25%
20%
15%
10%
5%
0%
Operating EBITDA Margin
Europe North America
Latin America Africa Middle East
Asia Pacific Holcim Group
2003 2004 2003 2004 2003 2004 2003 2004 2003 2004 2003 2004
22.6% 24.0% 18.1% 19.7% 38.7% 37.2% 29.1% 29.9% 24.8% 23.2% 26.3% 27.2%
MD & A
92
Operating Profit
2004 2003 ±% ±% in local ±% internal
currency growth
Million CHF
Europe 662 482 +37.3 +36.1 +31.7
North America 325 273 +19.0 +25.6 +24.5
Latin America 723 766 –5.6 +2.3 +2.2
Africa Middle East 370 287 +28.9 +30.0 +29.0
Asia Pacific 219 198 +10.6 +15.2 +20.8
Corporate/Eliminations (48) (81)
Holcim Group 2,251 1,925 +16.9 +21.2 +20.2
Operating profit
The year under review saw operating profit increase by CHF
326 million (2003: +22) to CHF 2,251 million. The strong 21.2%
growth in local currencies was more than enough to offset the
4.3% negative currency influence. At 20.2%, internal growth
on the level of operating profit was well above the 8% forecast
at the beginning of the year.
As a percentage of net sales, distribution and selling expenses
increased to 22.6%. The 0.4 percentage point increase in the
expense ratio is mainly attributable to higher energy prices
and higher sea freight rates.
As a percentage of net sales, administration expenses were
reduced by a further 0.2 percentage point to 7.9%. This decline
reflects ongoing measures to optimize costs.
Other depreciation and amortization relate to intangible and
other operating assets, including goodwill amortization. Good-
will is subject to regular impairment tests. Value adjustments
are stated under this heading in the income statement. There
was no percentage change in other depreciation expenses in
relation to net sales.
Other (expenses) income net
Other (expenses) income net comprise the positions dividend
and interest income on financial assets, depreciation on non-
operating assets and other net income, which includes profits
and losses of associated companies, profits and losses from
the sale of Group companies and associated companies and
non-operating expenses. In overall terms, other expenses were
CHF 88 million higher than the figure for the previous year.
Financial expenses net
There was no change in the ratio of financial expenses as a
percentage of net sales (3.9%) compared with the previous
year which mainly can be explained by the average interest
rate of 4.3% on financial liabilities which has remained
virtually unchanged (2003: 4.2%). In absolute terms, financial
expenses increased by CHF 17 million. The stable and risk-
compatible financing established in previous years paid off
in 2004.
Income taxes
The effective tax rate was reduced to around 31% in 2004
(2003: 35%). This was mainly due to the lower tax burdens
and improved tax planning opportunities at various Group
companies. The anticipated, long-term Group tax rate remains
unchanged at 33%.
Consolidated net income after minorities
Consolidated net income after minorities increased by CHF
228 million or 33.2% to CHF 914 million (2003: 686). In local
currencies, consolidated net income increased by 37.8%.
This further increase is mainly attributable to better operating
results, lower income taxes and the reduction in minority
interests in Mexico and the Philippines.
Earnings per share
Earnings per dividend-bearing registered share increased by
23.1% in the year under review to CHF 4.32. The corresponding
cash earnings per share reached CHF 5.95 (2003: 4.96). This
increase is all the more gratifying in that the capital increase
by mid-2004 led to a roughly 8% increase in the average
number of shares on which these calculations are based.
93
MD & A
Cash flow, capex and financing activity
Cash flow from operating activities
Cash flow from operating activities increased slightly by CHF 3
million or 0.1% to CHF 2,622 million. The 16.9% improvement in
the operating result impacted cash flow positively, while the
increase in income taxes paid of CHF 88 million had a negative
impact.
2004 2003 ±% ±% in local ±% internal
currency growth
Million CHF
Europe 882 878 +0.5 –0.5 –2.4
North America 396 359 +10.3 +15.7 +14.2
Latin America 702 869 –19.2 –12.7 –12.9
Africa Middle East 351 279 +25.8 +26.6 +26.5
Asia Pacific 281 309 –9.1 –4.9 –4.8
Corporate/Eliminations 10 (75)
Holcim Group 2,622 2,619 +0.1 +3.3 +2.4
Cash Flow from Operating Activities
As the above table shows, Group regions Africa Middle East
(25.8%) and North America (10.3%) in particular made key con-
tributions to this welcome development. Excluding negative
currency effects, these two Group regions improved their cash
flow from operating activities by 26.6% and 15.7%, respectively.
Group region Africa Middle East particularly benefited from
the strong operating result. Latin America recorded a decline
of 19.2% or CHF 167 million, followed by Asia Pacific with a
decline of 9.1% or CHF 28 million.
In 2004, the cash flow margin decreased to 19.8% (2003:
20.8%). After the previous year’s decline, Group region Africa
Middle East improved its cash flow margin by 1 percentage
point to 22.8%. North America also saw its cash flow margin
edge 0.8 percentage point higher. By contrast, after strong
results in previous years, margins declined in Group regions
Latin America (
–
5.4 percentage points), Asia Pacific (
–
3.2 per-
centage points) and Europe (
–
1.2 percentage points).
45%
40%
35%
30%
25%
20%
15%
10%
5%
0%
Cash Flow from Operating Activities as % of Net Sales
Europe North America
Latin America Africa Middle East
Asia Pacific Holcim Group
2003 2004 2003 2004 2003 2004 2003 2004 2003 2004 2003 2004
18.6% 15.1% 25.2% 22.8% 14.4% 19.8%19.8% 14.3% 30.6% 21.8% 17.6% 20.8%
MD & A
94
100%
90%
80%
70%
60%
50%
40%
30%
20%
10%
0%
Financing via Group Financial Holdings
69%55%55% 63% 74%
Investments and divestments
In 2004, cash flow from investing activities increased by 38.5%
to CHF 2,402 million (2003: 1,734), most of the higher amount
being attributable to the buyout of minority shareholders
in Mexico and the Philippines as well as the rise of our stake
in El Salvador.
During the financial year 2004, Holcim invested a net CHF
1,123 million (2003: 1,292) in production and other fixed assets,
which represents a decrease of 13.1% compared with the
previous year. The most important investments included new
kiln lines in Slovakia, Costa Rica and Romania as well as a
new grinding facility in Vietnam.
Investments in rationalization, environmental measures and
occupational safety in the workplace amounted to CHF 838
million (2003: 915) and therefore remained at the same
level as the previous year after adjustment for exchange rate
effects.
In connection with the successfully implemented Asset Reduc-
tion Program (ARP) in 2002, additional assets were sold during
the financial year. The book value of the ARP sales amounted
to CHF 654 million (2003: 533), with most transactions taking
place in the second half of the year. A major part of this reduc-
tion was related to the sale of Cimpor shares (see also infor-
mation on page 118).
Financing activity
In order to further optimize the financing structure, the share
of financial debt held at Group level was increased by 5%
to around 74%. The long-term objective is to finance a share
of approximately 70% at Group level.
CHF 1,456 million Capital increase through the issue of
28,740,689 new Holcim Ltd shares
EUR 600 million 4.375% bonds 2004–2014
CHF 419 million Redemption of the
1% convertible bond of
Holcim Overseas Finance Ltd. (1998–2004)
In 2004, Holcim carried out its financing activities through
various capital market transactions. Of particular importance
are the following:
These transactions were for the purpose of refinancing exist-
ing debt, extending the average term of financial liabilities
and switching from bank loans to capital market transactions.
2000 2001 2002 2003
2004
95
MD & A
Consolidated balance sheet
In 2004, consolidated shareholders’ equity increased by
CHF 1,697 million or 24.8% to CHF 8,530 million. The increase
is attributable in particular to the successful capital increase
carried out in the first half of 2004. The cash inflow amount-
ing to CHF 1,456 million was used to finance the buyouts of
minority interests in Mexico and the Philippines and underpin
the financial investments made since the last capital increase
with approximately 50% shareholders’ equity. This leaves us
with a substantially stronger balance sheet. The currency
effect on consolidated shareholders’ equity was once again
negative and amounted to CHF 537 million (2003:
–
313).
At the end of the financial year, minority interests reached
CHF 2,178 million (2003: 2,666), which represents a decrease of
CHF 488 million (2003:
–
201). The decrease is mainly due to the
buyouts of minority interests in Mexico and the Philippines.
Minority interests decreased by around CHF 49 million as a
result of currency translation effects.
Net financial debt decreased further to CHF 6,810 million
(2003: 8,299). The 17.9% decrease is essentially due to the
capital increase in the first half of 2004 and the currency
translation effect of CHF
–
419 million.
The relationship between net financial debt and shareholders’
equity, including minority interests (gearing), improved by
23.8 percentage points to 63.6% at the end of 2004.
Liquidity
In the context of further investments and in view of securing
the Group’s liquidity, the cash position was increased to CHF
3,770 million (2003: 2,518). Unutilized credit lines amounting
to CHF 4,445 million were also available as of December 31,
2004 (see also page 124). This figure also includes in particular
new, confirmed credit lines amounting to just under CHF 1 bil-
lion at holding company level with maturities of at least five
years.
Pension obligations
Most of the pension plans are independent of the company
and operated in separate legal entities (foundations). Both
employees and employers contribute to these pension funds
in order to augment saving balances and cover risks. To cover
these pension liabilities, the pension funds generally have
their separate assets available. Although the Group has no
commitments toward these pension funds other than the
defined contributions, the calculated net liability is recorded
in the Group balance sheet in accordance with International
Financial Reporting Standards (IFRS). Group companies with
unfunded pension plans have recorded provisions in their
books accordingly.
All pension obligations are reviewed and valued by independ-
ent actuaries every one to three years. The pension fund assets
are recorded at their fair value. Actuarial gains or losses
exceeding the corridor of 10% as defined by IFRS are amortized
based on the expected average remaining working lives of the
participating employees.
As at December 31, 2004, the net liability from funded and
unfunded plans amounted to CHF 280 million (2003: 289).
The fair value of the pension funds’ assets increased from
CHF 1,480 million to CHF 1,514 million.
MD & A
96
Group accounting policies
No significant new International Financial Reporting Standards
(IFRS) were introduced in financial year 2004.
The aim of the International Accounting Standards Board is to
bring about worldwide harmonization of accounting practices.
This process of amending, adding to and standardizing world-
wide accounting standards will lead to substantial changes in
the applicable directives over the course of the next few years.
An initial significant series of new regulations was introduced
at the beginning of 2005. Holcim is closely monitoring devel-
opments in this area and playing an active role in helping to
develop future standards through a number of special com-
mittees.
Group principles of consolidation
On January 1, 2005, the International Accounting Standards
Board put into effect an extensive revision of International
Financial Reporting Standards (IFRS). The adoption of these
amended and new standards will have a significant impact on
the accounting policies for the Holcim Group. In addition to
these changes, from January 1, 2005, certain Group companies
underwent a change in functional currency which is discussed
further below.
Goodwill
As set out in the 2004 quarterly reports, the Group has already
applied the new IFRS 3 standard (Business Combinations)
together with IAS 36 (Impairment of Assets, revised 2004) and
IAS 38 (Intangible Assets, revised 2004) for transactions which
took place on or after March 31, 2004. As from January 1, 2005,
the three standards referred to above will also apply to trans-
actions which occurred prior to March 31, 2004. Consequently,
as from January 1, 2005, goodwill will not be amortized but be
subject to an annual impairment test regardless of the date
of acquisition. This change will positively impact the 2005
operating results in that periodic amortization of goodwill will
no longer be permitted. However, impairment losses could
result in future years and this therefore should be taken into
account. Given our previous aggressive amortization policy for
goodwill, the Group is not expecting any major impairments
during the first few years. However, over time impairments are
expected to arise owing to the absence of periodic goodwill
amortization. This change in IFRS accounting practice will lead
to greater volatility in the consolidated income statement.
Remuneration paid in the form of stock options
The introduction of the new IFRS 2 standard will involve
changes to accounting practices relating to employee stock
participation programs. Until December 31, 2004, provisions
for employee stock options were not recognized in the income
statement. The introduction of the new IFRS 2 standard will
result in the cost of stock options being recognized in the
income statement as from January 1, 2005 on. As the Group
operates relatively insignificant stock option programs and
stock participation schemes (see page 133), it is unlikely that
there will be any significant impact on the consolidated
income statement.
CO2 emission rights
As a consequence of the ratification of the Kyoto protocol,
which has also been approved by the European Union, a cap
and trade scheme (which effectively limits the amount of
CO2 emissions a company may emit) was introduced in the
member states as of January 1, 2005. In response to these
developments, the IFRIC (International Financial Reporting
Interpretations Committee) issued accounting rules in Decem-
ber 2004 dealing with the treatment of emission rights for
accounting purposes. These accounting rules, if implemented,
could create significant artificial distortions in the income
statement which would therefore violate the “true and fair
view” principle. This has led to the emergence of widespread
opposition to the accounting rules in question. The EFRAG
(European Financial Reporting Advisory Group) is highly
expected to recommend non-endorsement of this particular
interpretation to the European Commission. As the interpreta-
tion is only applicable for business years commencing on or
after March 1, 2005, Holcim is therefore not required to adopt
IFRIC 3 in 2005. We are confident that an approach more in
line with the underlying economic reality will be found by the
international accounting community.
97
MD & A
Functional currency
As already mentioned, from January 1, 2005, a new functional
currency was adopted for certain Group companies in order to
reflect a change in the underlying economic conditions of the
countries concerned. Previously Holcim had kept the accounts
of certain Group companies operating in countries with high
inflation rates or unstable currencies in US dollar or Euro.
This principle had provided a correct reflection of the econom-
ic conditions and underlying events. As these countries no
longer regard the US dollar or the Euro as appropriate for their
companies, and with a view of taking full account of the eco-
nomic content of the underlying events and circumstances,
most countries will be therefore abandoning this accounting
practice in favor of using the currency of the country in which
the Group company is domiciled.
The functional currency is normally the currency in which the
company mainly earns and spends its cash flows. The impact
of changes in the functional currency need not be presented
retrospectively. The companies concerned will convert all
balance sheet positions into the new functional currency on
the basis of the exchange rate prevailing on the reference
date of January 1, 2005. For non-monetary items, the resulting
translated amounts will represent their historical cost.
Under the Group guidelines, Group companies should as far
as possible be financed in their functional currency. The
financing of the companies concerned will, where possible, be
changed to the new functional currencies. Financial expenses
will be subject to major fluctuations, depending on the trend
of the relevant exchange rates. In future, these currency gains
and losses and higher interest rates are expected to mean that
consolidated net income will exhibit greater volatility.
Events after the balance sheet date
On January 20, 2005, Holcim UK made a friendly takeover and
recommended cash offer to the shareholders of Aggregate
Industries plc to acquire its entire ordinary share capital for
a total amount of approximately GBP 1.8 billion. Aggregate
Industries is a major integrated supplier of aggregates,
asphalt and ready-mix concrete in the UK and the United
States. Holcim UK is offering the ordinary shareholders of
Aggregate Industries 138 pence per share. In addition, Aggre-
gate Industries’ shareholders will also be entitled to a second
interim dividend of 2 pence per share if the offer becomes or is
declared unconditional in all respects. A loan note alternative
will be made available. As of January 20, 2005, Holcim UK holds
29.9% of the ordinary share capital of Aggregate Industries.
On January 20, 2005, Holcim entered into a strategic alliance
with Gujarat Ambuja Cements Ltd to enter the growth market
of India. The alliance will be conducted through Ambuja
Cement India Ltd (ACIL), in which Holcim will hold 67% after
all relevant transactions have been completed. ACIL currently
owns 13.8% of The Associated Cement Companies Ltd (ACC)
and 94.1% of Ambuja Cement Eastern Ltd (ACEL). The two
cement companies have a combined annual cement capacity
of about 20.2 million tonnes. As part of the transaction,
the Holcim Group acting through ACIL will make a public
purchase offer to the shareholders of ACC and ACEL. It will
offer ACC shareholders INR 370 per share with the objective
of increasing its shareholding up to 50.01% and ACEL share-
holders INR 70 per share, subject to the approvals of relevant
government authorities in India.
On January 25, 2005, Holcim concluded the sale of treasury
shares in the amount of about CHF 430 million.
Outlook
For details regarding the outlook for 2005, please refer to the
shareholders’ letter on page 9.
Consolidated Statement of Income
98
Consolidated Statement of Income of Group Holcim
Million CHF Notes 2004 2003
Net sales 5 13,215 12,600
Production cost of goods sold 6 (6,617) (6,564)
Gross profit 6,598 6,036
Distribution and selling expenses 7 (2,980) (2,793)
Administration expenses (1,050) (1,016)
Other depreciation and amortization 8 (317) (302)
Operating profit 9 2,251 1,925
Other (expenses) income net 10 (76) 12
EBIT
1
2,175 1,937
Financial expenses net 11 (512) (495)
Net income before taxes 1,663 1,442
Income taxes 12 (510) (510)
Net income before minority interests 1,153 932
Minority interests (239) (246)
Net income after minority interests 914 686
CHF
Earnings per dividend-bearing share 14 4.32 3.51
Fully diluted earnings per share 14 4.28 3.49
Cash earnings per dividend-bearing share
2
14 5.95 4.96
1
Earnings before interest and taxes.
2
Excludes the amortization of goodwill and other intangible assets.
99
Consolidated Balance Sheet
Consolidated Balance Sheet of Group Holcim
Million CHF Notes 31.12.2004 31.12.2003
Cash and cash equivalents 15 3,730 2,456
Marketable securities 40 62
Accounts receivable 16 2,209 2,161
Inventories 17 1,255 1,175
Prepaid expenses and other current assets 162 174
Total current assets 7,396 6,028
Financial assets 18 1,162 1,862
Property, plant and equipment 21 13,135 13,294
Intangible and other assets 22 4,012 3,478
Deferred tax assets 29 156 163
Total long-term assets 18,465 18,797
Total assets 25,861 24,825
Trade accounts payable 24 1,284 1,245
Current financial liabilities 25 2,709 2,660
Other current liabilities 26 1,357 1,319
Total short-term liabilities 5,350 5,224
Long-term financial liabilities 27 7,871 8,157
Deferred tax liabilities 29 946 1,021
Long-term provisions 30 986 924
Total long-term liabilities 9,803 10,102
Total liabilities 15,153 15,326
Interests of minority shareholders 32 2,178 2,666
Share capital 33 460 402
Capital surplus 3,995 2,628
Treasury shares 33 (488) (448)
Reserves 4,563 4,251
Total shareholders’ equity 8,530 6,833
Total liabilities and shareholders’ equity 25,861 24,825
Statement of Changes in Consolidated Equity
100
Statement of Changes in Consolidated Equity of Group Holcim
Share Capital Treasury
capital surplus shares
Million CHF
Equity as at January 1, 2003 402 2,628 (452)
Net income after minority interests
Currency translation effects
Change in fair value
– Available-for-sale securities
– Cash flow hedges
Realized loss in income statement
– Available-for-sale securities
– Cash flow hedges
Dividends
Change in treasury shares net 4
Equity as at December 31, 2003 402 2,628 (448)
Equity as at January 1, 2004 402 2,628 (448)
Share capital increase 58 1,398
Net income after minority interests
Currency translation effects
Change in fair value
– Available-for-sale securities
– Cash flow hedges
Realized loss in income statement
– Available-for-sale securities
– Cash flow hedges
Dividends
Change in treasury shares net (40)
Repayment of convertible bonds (31)
Equity as at December 31, 2004 460 3,995 (488)
101
Statement of Changes in Consolidated Equity
Retained Available-for-sale Cash flow Currency Total Total
earnings equity reserve hedging translation reserves shareholders’
reserve effects equity
5,678 (178) (82) (1,428) 3,990 6,568
686 686 686
(313) (313) (313)
60 60 60
111
999
13 13 13
(195) (195) (195)
04
6,169 (109) (68) (1,741) 4,251 6,833
6,169 (109) (68) (1,741) 4,251 6,833
0 1,456
914 914 914
(537) (537) (537)
18 18 18
18 18 18
81 81 81
00
(225) (225) (225)
0 (40)
43 43 12
6,901 (10) (50) (2,278) 4,563 8,530
Consolidated Cash Flow Statement
102
102
Consolidated Cash Flow Statement of Group Holcim
Million CHF Notes 2004 2003
Operating profit 2,251 1,925
Depreciation and amortization of operating assets 8 1,337 1,386
Other non-cash items 173 152
Change in net working capital (119) 67
Cash generated from operations 3,642 3,530
Dividends received 72 78
Interest received 47 26
Interest paid (491) (458)
Income taxes paid (622) (534)
Other expenses (26) (23)
Cash flow from operating activities (A) 2,622 2,619
Purchase of property, plant and equipment 36 (1,206) (1,405)
Disposal of property, plant and equipment 36 83 113
Purchase of financial assets, intangible and other assets 36 (2,153) (1,014)
Disposal of financial assets, intangible and other assets 36 874 572
Cash flow used in investing activities (B) (2,402) (1,734)
Dividends paid on ordinary shares (225) (195)
Dividends paid to minority shareholders (150) (157)
Dividends paid on preference shares (17) (16)
Share capital paid-in 1,456 0
Capital paid-in by minority interests 226
Movements of treasury shares net (40) 4
Decrease in current financial liabilities (181) (187)
Proceeds from long-term financial liabilities 1,742 2,359
Repayment of long-term financial liabilities (1,487) (2,848)
Decrease in marketable securities 20 30
Cash flow from (used in) financing activities (C) 1,120 (984)
In(De)crease in cash and cash equivalents (A+B+C) 1,340 (99)
Cash and cash equivalents as at January 1 2,456 2,698
In(De)crease in cash and cash equivalents 1,340 (99)
Currency translation effects (66) (143)
Cash and cash equivalents as at December 31 3,730 2,456
103
Accounting Policies
Basis of preparation
The consolidated financial statements have been prepared in
accordance with International Financial Reporting Standards
(IFRS).
Adoption of new International Financial Reporting Standards
In 2004, the Group adopted the following new standards in
respect of acquisitions for which the agreement date was on
or after March 31, 2004:
IFRS 3 Business Combinations
IAS 36 Impairment of Assets (revised 2004)
IAS 38 Intangible Assets (revised 2004)
Use of estimates
The preparation of financial statements in conformity with IFRS
requires management to make estimates and assumptions that
affect the reported amounts of revenues, expenses, assets, liabili-
ties and related disclosures at the date of the financial statements.
These estimates are based on management’s best knowledge of
current events and actions that the Group may undertake in the
future. However,actual results could differ from those estimates.
Scope of consolidation
The consolidated financial statements comprise those of
Holcim Ltd and of its subsidiaries, including joint ventures
and associated companies. The list of principal companies is
presented in the section “Principal Companies”.
Principles of consolidation
Subsidiaries, which are those entities in which the Group has
an interest of more than one half of the voting rights or
otherwise has the power to exercise control over the opera-
tions, are consolidated. Subsidiaries are consolidated from
the date on which control is transferred to the Group and are
no longer consolidated from the date that control ceases.
All intercompany transactions and balances between Group
companies are eliminated.
The Group’s interest in jointly controlled entities is consoli-
dated using the proportionate method of consolidation.
Under this method, the Group records its share of the joint
ventures’ individual income and expenses, assets and liabili-
ties and cash flows in the consolidated financial statements
on a line-by-line basis. All transactions and balances between
the Group and joint ventures are eliminated to the extent of
the Group’s interest in the joint ventures.
Investments in associated companies are accounted for using
the equity method of accounting. These are companies over
which the Group generally holds between 20 and 50% of
the voting rights and has significant influence but does not
exercise control. Equity accounting is discontinued when the
carrying amount of the investment in an associated company
reaches zero, unless the Group has either incurred or guaran-
teed obligations in respect of the associated company.
Foreign currency translation
Income statements of foreign entities are translated into the
Group’s reporting currency at average exchange rates for
the year and balance sheets are translated at exchange rates
ruling on December 31.
Goodwill arising on the acquisition of a foreign entity is
treated as a local currency asset of the acquirer and recorded
at the exchange rate at the date of the transaction.
Foreign currency transactions are accounted for at the
exchange rates prevailing at the date of the transactions;
gains and losses resulting from the settlement of such
transactions and from the translation of monetary assets and
liabilities denominated in foreign currencies are recognized
in the income statement, except when deferred in equity as
qualifying cash flow hedges.
The functional currency is normally the currency of the coun-
try in which a Group company is domiciled. However, certain
subsidiaries in high inflation countries or companies operat-
ing in economies with unstable currency situations consider
the USD or the EUR to be the more appropriate measurement
currency as it more correctly reflects the economic substance
of the underlying events and circumstances relevant to
that particular enterprise. As a consequence thereof, the USD
or the EUR are used as the functional currency for these
specifically affected companies.
Cash and cash equivalents
Cash and cash equivalents are readily convertible into a
known amount of cash with original maturities of three
months or less. Cash and cash equivalents comprise cash at
banks and on hand, deposits held on call with banks, other
short-term highly liquid investments and bank overdrafts.
Marketable securities
Marketable securities consist primarily of debt and equity
securities which are traded in liquid markets and are classi-
fied as available-for-sale. They are carried at fair value with all
fair value changes recorded in equity until the financial asset
is either impaired or disposed of at which time the cumula-
tive gain or loss previously recognized in equity is transferred
to net income for the period.
Accounting Policies
104
104
Accounts receivable
Trade accounts receivable are carried at original invoice
amount less an estimate made for doubtful debts based
on a review of all outstanding amounts at the year end.
Inventories
Inventories are stated at the lower of cost and net realizable
value. Cost is determined by using the weighted average
cost method. The cost of finished goods and work in progress
comprises raw materials and additives, direct labor, other
direct costs and related production overheads. Cost of inven-
tories includes transfers from equity of gains or losses on
qualifying cash flow hedges relating to inventory purchases.
Financial assets
Financial assets consist of (a) investments in associates
(b) investments in third parties (c) long-term receivables from
associates (d) long-term receivables from third parties and
(e) long-term derivative assets. Investments in associates are
accounted for using the equity method of accounting (for
more details, please refer to “Principles of consolidation”).
Investments in third parties are classified as available-for-sale
and long-term receivables from associates and third parties
are classified as loans originated by the Group. Long-term
derivative assets are regarded as held for hedging unless they
do not meet the strict hedging criteria under IAS 39 Financial
Instruments: Recognition and Measurement, in which case
they will be classified as held for trading.
All purchases and sales of investments are recognized on
trade date, which is the date that the Group commits to pur-
chase or sell the asset. Purchase cost includes transaction
costs. Loans originated by the Group are measured at amor-
tized cost. Available-for-sale investments are carried at
fair value, while held-to-maturity investments are carried at
amortized cost using the effective interest method. Gains
and losses arising from changes in the fair value of available-
for-sale investments are included in equity until the financial
asset is either impaired or disposed of, at which time the
cumulative gain or loss previously recognized in equity is
transferred to net profit and loss for the period. Where no
reliable information to value investments at equity value or
fair value is available, these investments are carried at the
lower of cost and net realizable value.
Property, plant and equipment
Property, plant and equipment is valued at acquisition or
construction cost less depreciation and impairment loss.
Cost includes transfers from equity of any gains or losses on
qualifying cash flow hedges. Depreciation is charged so as
to write off the cost of property, plant and equipment over
their estimated useful lives, using the straight-line method,
on the following bases:
Land No depreciation except on land
with raw material reserves
Buildings and installations 20 to 40 years
Machinery 10 to 30 years
Furniture, vehicles and tools 3 to 10 years
Repair and maintenance expenses are usually charged to
the income statement but costs incurred are capitalized
if one or more of the following conditions are satisfied:
the original useful life of the asset is extended, the original
production capacity is increased, the quality of the product
is materially enhanced or production costs are reduced
considerably.
Costs incurred to gain access to mineral reserves are capital-
ized and depreciated over the life of the quarry, which is
based on the estimated tonnes of raw material to be extract-
ed from the reserves.
Interest cost on borrowings to finance construction projects
which last longer than one year are capitalized during
the period of time that is required to complete and prepare
the asset for its intended use. All other borrowing costs are
expensed in the period in which they are incurred.
Government grants received are deducted from property,
plant and equipment and reduce the depreciation charge
accordingly.
Leases of property, plant and equipment where the Group
has substantially all the risks and rewards of ownership are
classified as finance leases. Property, plant and equipment
acquired through a finance lease is capitalized at the date of
inception of the lease at the present value of the minimum
future lease payments. The corresponding lease obligations,
excluding finance charges, are included in current or long-
term financial liabilities.
For sale and lease-back transactions, the book value of the
related property, plant or equipment remains unchanged.
Proceeds from a sale are included as a financing liability and
the financing costs are allocated over the term of the lease in
such a manner that the costs are reported over the relevant
periods.