holcim us an overview bernard terver area manager st louis september 14 2010 holcim
Bạn đang xem bản rút gọn của tài liệu. Xem và tải ngay bản đầy đủ của tài liệu tại đây (776.25 KB, 29 trang )
© Holcim Ltd 2010
Investor / Analyst Capital Markets Event 2010
Holcim US – an overview
Bernard Terver – Area Manager
St. Louis, September 14, 2010
2
© Holcim Ltd 2010
Investor / Analyst Capital Markets Event 2010
Executive Summary Holcim US (HUS)
• Ste. Genevieve start-up was successful
• HUS has the most modern assets in the industry as well as one of the
broadest geographical coverage due to its large distribution network.
Ste. Genevieve provides cost leadership in ~80% of the river markets
• Our culture is ‘performance driven’, doing our ‘homework’ well with passion
• Our response to the crisis was quick and decisive
Reorganization was carried out in the spirit of “Speed and Simplicity”
Cost reductions of ~$150M were achieved in 2009
Operational performance improved
• We have world class safety results and a standard setting plant for energy
efficiency and environmental performance
• HUS strategy is to “grow the pie” through promotion and being closer to
customers by providing solutions
• HUS is well set up for recovery and will achieve its 33% EBITDA margin
target
3
© Holcim Ltd 2010
Investor / Analyst Capital Markets Event 2010
Agenda
1
Our US portfolio – broad geographic reach
2
Our response to the crisis – quick and decisive
3
Our performance – empowered employees delivering
4
Our value creation – targets achieved with recovery
4
© Holcim Ltd 2010
Investor / Analyst Capital Markets Event 2010
North Region
South Region
Cement Plant
z
Grinding Plant
S
Cement Terminal
S
S
S
S
S
S
S
S
S
S
S
z
S
S
S
S
S
S
S
S
S
S
S
S
S
S
S
S
S
S
S
S
S
S
S
S
S
S
S
S
S
S
S
S
S
S
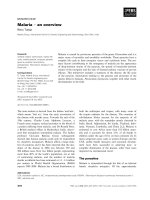
Holcim US (HUS) has the broadest geographical coverage – our plants
and terminals cover ~80% of the US markets
3.2 million
tons
5.6 million
tons
5
© Holcim Ltd 2010
Investor / Analyst Capital Markets Event 2010
North
South
Ontario
Quebec / Atlantique
z
z
z
È
È
È
È
È
È
È
È
È
È
È
È
È
È
È
È
È
È
È
È
È
È
È
È
È
È
ÈÈ
È
È
È
È
È
È
È
È
È
È
È
È
È
È
È
È
È
È
È
È
È
È
È
È
È
È
È
È
È
È
È
ÈÈ
È
È
È
È
È
È
È
È
È
È
È
È
È
È
È
È
È
È
È
È
È
È
È
È
È
È
È
È
È
È
È
È
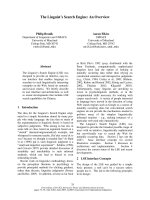
West
Mid West
Mid Atlantic
Northeast
Hagerstow n
Catskill
Theodore
Por tland
Trident
A
da
Holly Hill
Midlothian
Devil's Slide
St. Genevieve
Joliette
Mississauga
Our integrated positions strengthen cement sales in select integrated
markets and provide opportunities for cross selling
6
© Holcim Ltd 2010
Investor / Analyst Capital Markets Event 2010
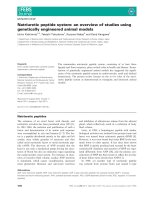
Our asset renewal program ($4.1B since 1993) has created the most
modern assets in the industry
1993 1996 2000 2001 2002 2003 2009
Ste.
Genevieve
on-line
Birmingham
Camden
Expansion
of Portland
plant
Expansion
of Devil's
Slide plant.
Chicago
Skyway
Expansion
of Midlothian
plant
Expansion
of Holly Hill
plant
Box Crow
Cement
(Midlothian
plant) under
Holnam
Texas LP
Acquisitions and Expansions
• HUS has invested the most of all the cement
players resulting in average kiln age of ~15
years
• As more stringent environmental regulations are
passed, HUS’ newer asset base is anticipated to
have a competitive advantage
HUS and main competitors average kiln age
HUS investments Investment timeline
0
5
10
15
20
25
30
35
HUS Competitor Avg
Source: PCA
The average kiln age presented above is capacity weighted
0
100
200
300
400
500
600
700
800
900
1000
1993
1995
1997
1999
2001
2003
2005
2007
2009
$ M
7
© Holcim Ltd 2010
Investor / Analyst Capital Markets Event 2010
Barge is cheaper, cleaner and safer
Ste. Genevieve provides cost leadership in ~80% of river areas which
account for 32% of US cement consumption
15522.71Equivalent
Fatalities (indexed
to barge)
71.626.919.3
CO
2
(tons of CO
2
per million ton-
miles)
26.612.240.72Cost per ton-mile
(cents)
70161Equivalent Units
(Indexed to barge)
TrucksRailBarge
HUS market volumes and Ste. Gen delivery pattern [Mt]
8
© Holcim Ltd 2010
Investor / Analyst Capital Markets Event 2010
Agenda
1
Our US portfolio – broad geographic reach
2
Our response to the crisis – quick and decisive
3
Our performance – empowered employees delivering
4
Our value creation – targets achieved with recovery
9
© Holcim Ltd 2010
Investor / Analyst Capital Markets Event 2010
Actual Consumption and PCA Forecast (M tons)
Supply Demand Balance (M tons)
60
70
80
90
100
110
120
130
2000
2001
2002
2003
2004
2005
2006
2007
2008
2009
2010
2011
2012
2013
2014
Act ual Consumptio n Spring 2008 Summer 2008
Fall 2008 Wint er 2008 Spring 2009
Summer 2009 Fall 2009 Wint er 2009
Spring 2010 Summer 2010
0
20
40
60
80
100
120
140
72
75
7
8
8
1
84
87
90
93
96
99
'02
'
05
'
08
Residential Commercial Infrastructure Other Total
Cement Consumption by Segment (M tons)
0
20
40
60
80
100
120
140
1980
1982
1984
1986
1988
1990
1
992
1994
1996
1998
2000
2002
2004
2006
2008
Clinker Capacity Cement Consumption
Figures above include M asonry
Figures above exclude M asonry
Figures above include M asonry
Holcim (US) realized early that the crisis was deep – the market
trough was elusive (-57M tons since 2005)
• Since the 2005 peak, the residential
sector declined by 30M tons (~52% of
total decline)
• Infrastructure declined by 19M tons
since 2006 as fiscally challenged states
struggled to match Federal funding
10
© Holcim Ltd 2010
Investor / Analyst Capital Markets Event 2010
Holcim US quickly mobilized in response to the demand drop and
reorganized in the spirit of “Speed and Simplicity”
Four business units with
complex corporate
One central
organization
• Sales and manufacturing plants reported
to business units
• Sales organization had 5 levels
• Large centralized distribution group
• Plants report to manufacturing
• 2 sales organizations with three levels
• Field shipping stations in sales
Why did we do this?
• We want a low break-even point and achieve margin targets
• The US is a large country but our business is local
• Lean organization providing transparency and clear accountability
• Proximity to the workforce, markets and customers
• Support process to facilitate operations in the most efficient manner
Speed and Simplify
11
© Holcim Ltd 2010
Investor / Analyst Capital Markets Event 2010
The reorganization drove headcount reduction at all levels and capacity
was rationalized (3.6M tons)
SupportMftg
EXCO
11
Support
Mftg
EXCO
7
• Dundee and Clarksville closures announced
Nov. 2008, Mason City and Artesia
mothballing announced March 2009
• Dec 2008 - Manufacturing reports to one
Head. Smaller logistics working seamlessly
with Sales and Manufacturing
• Mar 2009 – Two sales organizations with three
levels for more transparency, accountability
and closer to customer. Field shipping stations
report to Sales
Sales Sales
20
12 12 8
20 10
Top management employees
63
37
MC (0.9MT)
CV (1.2MT)
AR (0.6MT)
DU (0.9MT)
MC (0.9MT)
CV (1.2MT)
AR (0.6MT)
DU (0.9MT)
Holcim US total employees
1500
1700
1900
2100
2300
2500
2700
2900
3100
Dec 0
8
Feb 09
Apr 09
Jun 09
Aug 09
Oct 09
Dec 0
9
Feb 10
M
ay
10
Jul 10
Closed/mothballed plants
12
© Holcim Ltd 2010
Investor / Analyst Capital Markets Event 2010
Discipline and teamwork reduced average net working capital by
~$70M in 2009 & target of ~$30M in 2010
• Increased forecasting accuracy, teamwork
between logistics, sales and manufacturing and
higher reliability of plants allowed production
plans to be adjusted quickly to changing market
conditions (especially in 2009 when market
visibility was low)
DSO (Days sales outstanding)
Net Working Capital (M $)
Clinker and Cement Inventory (M tons)
0
50
100
150
200
250
300
Jan Feb Mar Apr May Jun Jul Aug Sep Oct Nov Dec
2008
2009 2010
0.0
0.5
1.0
1.5
2.0
2.5
3.0
Jan Feb Mar Apr May Jun Jul Aug Sep Oct Nov Dec
2008 Highest Monthly Sales 2009 Highest Monthly Sales
2008 Inventory
2009 Inventory
2010T Inventory
35
37
39
41
43
45
47
49
Jan Feb Mar Apr May Jun Jul Aug Sep Oct Nov Dec
DSO 08 DSO 09 DSO 10
13
© Holcim Ltd 2010
Investor / Analyst Capital Markets Event 2010
Cost reductions and cash flow initiatives have not hindered
manufacturing performance improvement
• Excellent Ste. Genevieve start-up
• Proper organization with the right people in
the right positions
• Efficiency – “do it right” from the first time
• Preventive Maintenance: right work at right
time
• Explained key performance indicators to the
whole organization – we can’t improve what
we can’t measure
-
100
200
300
400
500
600
700
TR AD1 HT AD2 DS PD CK HH ML2 TH GV
Net Availaibility (12 month rolling)
Kiln MTBF 12 month rolling August 2010
70
75
80
85
90
95
100
PD HH ML DS TH AD GV TR CK HT
Aug-10 2009 2008
Wet Kilns
Dry Kilns
> 400 hr 250->400hr < 250hr
> 300 hr
125->300hr
< 125hr
Ste. Gen. Start-up Net Overall Equip. Efficiency
July 4th start-up
MTBF - Mean time between failure
0%
25%
50%
75%
100%
123456789101112
Net OEE
Months of operation
Ste. Geneviève
Average 13 Kilns
14
© Holcim Ltd 2010
Investor / Analyst Capital Markets Event 2010
333
236
74
142
97
61
0
100
200
300
400
500
600
2008A 2009A
$ mio
Fixed Manufacturing Cost Fixed Distribution Cost Support Process Cost
549
395
A target total fixed cost of $400M was set and achieved in 2009 by
reducing costs by ~$150M
$ M
-154
15
© Holcim Ltd 2010
Investor / Analyst Capital Markets Event 2010
Agenda
1
Our US portfolio – broad geographic reach
2
Our response to the crisis – quick and decisive
3
Our performance – empowered employees delivering
4
Our value creation – targets achieved with recovery
16
© Holcim Ltd 2010
Investor / Analyst Capital Markets Event 2010
Cost reductions allowed HUS to stabilize margins even with severe
volume declines and lower prices
Note: Historical data has not been restated through changes of organization structure and HARP.
• HUS cement sales annual growth of 3.5%
from 2000 to 2007 largely mirrored the overall
US economic growth before declining in the
most recent economic downturn
• Prices increased from 2005 to 2007 and have
gradually declined thereafter
• EBITDA% improved from 22% to 31% from
2002 to 2007 before declining during the
recession.
• The significant reduction in fixed cost of
~$150M has resulted in lower break-even
point for HUS, stabilized the margins and set
up HUS very well for the eventual recovery
Sales [B $]
Key Performance Indicators [%]
-10%
0%
10%
20%
30%
40%
50%
60%
2000
2001
2002
2003
2004
2005
2006
2007
2008
2009
Cash Flow % Ebitda % Ebit %
0.0
0.2
0.4
0.6
0.8
1.0
1.2
1.4
1.6
1.8
2000
2001
2002
2003
2004
2005
2006
2007
2008
2009
Sales
17
© Holcim Ltd 2010
Investor / Analyst Capital Markets Event 2010
We have reenergized innovation in our employees with systems that
allow ideas to be brought forward
• ‘Six Sigma’ – rigorous set of quality management tools with over 60
employees trained as coaches
• ‘Innovation Toolbox’ –
An initiative for hourly and salaried employees
One idea = one person
Innovation team evaluates feasibility and benefit of the idea as well as
the implementation of it.
• Training
Increased commitment to skill development with over 400 courses
available
~1000 equivalent course enrollment with 50k man-hours of training
annually (~25 full time personnel)
Changed our delivery mix to have more e-learning, Webinars and on-
site courses
Over 90% of courses cost less than $100 (direct cost) with no travel and
no lost productivity
18
© Holcim Ltd 2010
Investor / Analyst Capital Markets Event 2010
Our employees have continued to bring ideas forward resulting
improved costs and efficiency
Provides
leverage
with Power
Companies
Midlothian Lighting ($48k savings)
Rail Car Lading Optimization ($2.4M savings) Portland 100KW Solar Pilot ($10k savings)
Portland Idle Time Power Consumption ($135k savings)
20,000
22,000
24,000
26,000
28,000
30,000
32,000
34,000
36,000
12/20/2009
1/3/2010
1/17/2010
1/31/2010
2/14/2010
2/28/2010
3/14/2010
3/28/2010
4/11/2010
4/25/2010
5/9/2010
kwhr/day
19
© Holcim Ltd 2010
Investor / Analyst Capital Markets Event 2010
Our modern assets provide for steady progress in energy efficiency
highlighted by the addition of Ste. Genevieve
• Devil's Slide, Theodore, and Midlothian, have
earned the U.S. Environmental Protection
Agency's (EPA) prestigious ENERGY STAR
• Closure/idling of wet kilns has helped reduce
energy consumption
• Current 2010 trend is to achieve another ~5%
increase in Petcoke consumption
Specific Heat Consumption (MJ/ton of clinker)
0%
5%
10%
15%
20%
25%
30%
35%
2002 2005 2009 2010F
PCA Avg HUS
3,200
3,400
3,600
3,800
4,000
4,200
4,400
4,600
2008 2009 2010 F
% Petcoke of total fuel
116
120
124
128
132
136
140
2008 2009 2010F
Specific Electrical Energy Consumption (kwhr/ton)
20
© Holcim Ltd 2010
Investor / Analyst Capital Markets Event 2010
Ste. Genevieve has a remarkable impact on HUS environmental
performance
• Ste. Gen. has the lowest clinker heat
consumption of all HUS plants and also very
low specific emission/ton clinker
• The dramatically improved environmental
performance comes from state of the art
design of the plant
0
200
400
600
800
1000
1200
Gross CO2 Net CO2 Landfill CKD
4 Closed/mothball plant (2008) Ste. Gen. May 2010 YTD
0.00
1.00
2.00
3.00
4.00
5.00
6.00
7.00
SO2 NOx THC CO Dust
4 Closed/mothball plant (2008) Ste. Gen. May 2010 YTD
Ste. Gen. vs. 4 closed/mothballed plants (kg/t clk)
Ste. Gen. vs. 4 closed/mothballed plants (kg/t clk)
% Reduction from Ste. Gen. on HUS emissions
0%
10%
20%
30%
40%
50%
60%
70%
80%
90%
SO2 NOx THC CO Dust Gross
CO2
Net
CO2
Landfill
CKD
Assumes Ste. Gen replaces 4 closed/mothballed plants in 2008
CKD – cement kiln dust
clk – clinker
21
© Holcim Ltd 2010
Investor / Analyst Capital Markets Event 2010
The transformation to world class safety results
• Near Miss process – working at lost
time incident reduction by seeking out
unsafe conditions and acts and
managing them
• Safety Observation System (SOS) –
Focusing on restricted-duty reportable
reduction via observation and case
management
Lost time frequency rate = No. of LTI cases*1,000,000/actual hours
worked
0.00
0.10
0.20
0.30
0.40
0.50
0.60
0.70
0.80
0.90
1.00
2003 2004 2005 2006 2007 2008 2009
0%
2%
4%
6%
8%
10%
12%
14%
16%
18%
Holcim Experience Mod Rate % improvement
HUS Experience Modifier Rate (Work. Comp. Insurance)
Lost Time
0
5
10
15
20
2003 2004 2005 2006 2007 2008 2009 2010
YTD A
2010
Rate
0.0
0.5
1.0
1.5
2.0
2.5
3.0
3.5
4.0
4.5
Lost Time Cases Lost time frequency rate
EMR (insurance rating) rating of less than 1.0 indicates that the company’s claim
history company is performing better than would be expected.
22
© Holcim Ltd 2010
Investor / Analyst Capital Markets Event 2010
Holcim is anticipated to have a competitive advantage on NESHAP due
to its modern asset base
• EPA has issued final National Emissions Standards on August 9
th
for
Hazardous Air Pollutants (NESHAP) for Mercury (Hg), Hydrochloric Acid
(HCl), Total Hydrocarbons (THC), and Particulate Matter (PM, i.e. dust)
• We believe HUS is well positioned to comply with reasonable NESHAP
regulations based on historic investments in new and existing cement
plants, which in turn, should provide HUS with a competitive advantage
• While it is true that the current NESHAP regulations could change, it is
likely that the final rule will require additional investments in US
• HUS believes that the industry must strive to improve emissions
performance. HUS continues to do so. For example, HUS voluntarily
installed continuous emissions monitors, the only major cement player to
do so
• EPA will ensure a level playing field and we remain hopeful that reasonable
regulations can be achieved
23
© Holcim Ltd 2010
Investor / Analyst Capital Markets Event 2010
HUS strategy is to ‘Grow the Pie’ through promotion and being closer
to customers through providing solutions
• Positioning of concrete as economical, durable and sustainable
Influence policies affecting material selection and procurement
by Regional Promotion Groups
Life Cycle Analysis (MIT study)
• Customer Alignments
Four annual CEO level meetings with key customers
Tech service engineers help customers with mix design
Holcim branded tool to enable customers to calculate recycled
content of material – essential for obtaining LEED (Leadership in
Energy and Environmental Design) projects
Customer training in LEED, Concrete basics, Calorimetry and
Specifications
Green Cement - Envirocore
24
© Holcim Ltd 2010
Investor / Analyst Capital Markets Event 2010
Agenda
1
Our US portfolio – broad geographic reach
2
Our response to the crisis – quick and decisive
3
Our performance – empowered employees delivering
4
Our value creation – targets achieved with recovery
25
© Holcim Ltd 2010
Investor / Analyst Capital Markets Event 2010
PCA is forecasting a relatively sharp recovery
• Before the current downturn, infrastructure
had seen a steady increase based on
highway programs authorized by Congress.
PCA is forecasting a rebound of infrastructure
segment based on a new highway bill and
improved fiscal condition of states
• Residential also saw a big and sustained
increase especially from early 2000’s.
However, the downturn has resulted in an
‘over correction’ of residential segment. PCA
is forecasting a significant rebound
• The non-residential and other segments have
also seen similar reduction in spending in the
current downturn
• The long-term per capita consumption has
hovered around 300 kg/capita till 1990
100
150
200
250
300
350
400
450
1953
1957
1961
1965
1969
1973
1977
1981
1985
1989
1993
1997
2001
2005
2009
2013
Per Capita Consumption (kg/capita)
US Cement Consumption by Segment (M tons)
0
20
40
60
80
100
120
140
72
75
78
81
84
87
90
93
96
99
'02
'05
'08
'11
'14
Residential Commercial Infrastructure Other Total
PCA
Figures above exclude Masonry