sg infrastructure construction building materials conference positioned for future growth marco knuchel investor relations binit sanghvi investor relations may 19 2010 hlcim ltd
Bạn đang xem bản rút gọn của tài liệu. Xem và tải ngay bản đầy đủ của tài liệu tại đây (2.05 MB, 29 trang )
SG – Infrastructure, Construction & Building
Materials Conference
Holcim – Positioned for future growth
Marco Knuchel – Investor Relations
Binit Sanghvi – Investor Relations
May 19, 2010
Phu My Bridge, Vietnam
© Holcim Ltd 2010
Agenda
1
Strategy and positioning
2
Value driven investment criteria
3
First quarter 2010 results
4
Conclusions
5
Appendix – Maps
2
© Holcim Ltd 2010
SG – Infrastructure, Construction & Building Materials Conference
May 19, 2010
Holcim strategy…
Geographic
Diversification
Product Focus
• Two basic resources
• Cement
• Aggregates
• Value-adding products
and services
• Ready-mix concrete
• Asphalt
• Concrete products
Local Management
Global Standards
• Business – strongly
anchored in local
markets
• Truly global
• Balanced between
• regions
• mature / emerging markets
Net sales1
Op. EBITDA1
25%
29%
34%
37%
8%
6%
15 %
16 %
Europe
North America
8%
22%
Latin America
Africa Middle East
Asia Pacific
• Supported by
global standards
• Policies &
directives
• Exchange of
know how &
best practices /
benchmarking
…effective execution is the base for success
1
3
Reported as per 12M 2009 YTD
© Holcim Ltd 2010
SG – Infrastructure, Construction & Building Materials Conference
May 19, 2010
Holcim Value Chain
Supply
Basic Materials
Processing
Cementitious
Materials
(cement,
mineral
components)
Channels
Transactional
Transformational
End - users
Direct Sales
Ready -mix
Concrete
Traders
General
Contractors
Concrete
Products
Self - builders
Masons
Wholesalers
Mortars
Aggregates
Retailers
(sand, gravel,
stone, recycled
aggregates)
Demand
Applications and
Construction Fields
Asphalt
Direct Sales
Civil
Engineering
A
p
p
l
i
c
a
t
i
o
n
s
Housing
Commercial /
Industrial
Building
Infrastructure
4
© Holcim Ltd 2010
SG – Infrastructure, Construction & Building Materials Conference
May 19, 2010
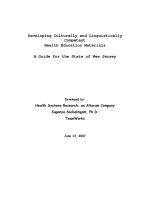
Holcim generates its EBITDA in countries with
GDP growth above average
GDP Growth [%] (excl. China)
2009
World
Mature
Market
2010
3.9%
-1.1%
2012
4.7%
2.7%
-2.3%
Emerging
Market
2011
3.5%
5.4%
0.6%
5.2%
3.9%
6.3%
6.8%
6.4%
6.7%
GDP Growth weighted with Holcim op. EBITDA 2009 per country [%] (excl. China)
2009 Holcim
op. EBITDA split:
Holcim World
Mature: 30%
Mature
Market
Emerging: 70%
Emerging
Market
5.7%
1.3%
3.1%
-1.7%
4.4%
3.8%
8.2%
4.1%
8.8%
9.0%
Source: Nominal GDP per Capita (at PPP) in USD: International Monetary Fund - World Economic Outlook Database (April 2010), Holcim estimates
© Holcim Ltd 2010
SG – Infrastructure, Construction & Building Materials Conference
5
May 19, 2010
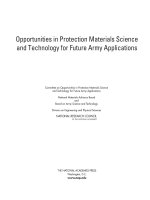
Demand drivers – population growth and
urbanization
World population
Population in rural and urban areas
10
10
10
urban
rural
6.4
5
5
5
Emerging
markets
5.0
3.2
2.4
Mature
markets
0
0
1970
2000
0
2030
2050
3.3
2.8
2.9
1.3
1970
2000
2030
2050
• Likely little or even no population growth in most developed countries
while population growth in emerging countries will continue
• In emerging and mature countries migration from rural areas into
urban agglomerations will continue
Source: United Nations, World Population Prospects, March 2009 – in billion
© Holcim Ltd 2010
SG – Infrastructure, Construction & Building Materials Conference
6
May 19, 2010
Global construction outlook still rock-solid and
dynamic!
Largest construction markets 2009E
Largest construction markets 2020E
Global ranking
USA
China
Japan
Germany
Spain
France
Italy
South Korea
India
UK
Canada
Brazil
Australia
Russia
Indonesia
1
2
3
4
5
6
7
8
9
10
11
12
13
14
15
Global ranking
China
USA
India
Japan
South Korea
Germany
Spain
Russia
UK
Canada
France
Italy
Indonesia
Brazil
Australia
1
2
3
4
5
6
7
8
9
10
11
12
13
14
15
With a presence in 13 out of 15 top construction markets
Holcim is very well positioned to capture growth opportunities
Source: Global Construction 2020, Global Construction Perspectives, Oxford Economics, November 2009
© Holcim Ltd 2010
SG – Infrastructure, Construction & Building Materials Conference
7
May 19, 2010
All BRICs in one basket? Positions and challenges
are very different!
Holcim influenced capacity 2009 (M tonnes)
Europe
North America
Latin America
Africa Middle East
Asia Pacific
51.1
20.6
34.2
27.2
153.1
18%
7%
12%
10%
54%
Total influenced capacity
- of which BRIC
Holcim BRIC pro-forma op. EBITDA 20091
286.2 100%
111.4 39%
Brazil – platform for growth
16%
8%
4%
72%
Brazil
Russia/CIS
India
China
Russia – Shurovo renewal
Southeast – in % of Brazil
Population
GDP
Cement demand
53%
73%
66%
Brasilia
Belo Horizonte
Sao Paulo
1
~130km
~85km
Rio de Janeiro
Pro-forma incl. China (Holcim participation in Huaxin Cement is 39.9 percent – therefore it’s not fully consolidated)
© Holcim Ltd 2010
SG – Infrastructure, Construction & Building Materials Conference
8
May 19, 2010
All BRICs in one basket? Positions and challenges
are very different!
Holcim influenced capacity 2009 (M tonnes)
Europe
North America
Latin America
Africa Middle East
Asia Pacific
51.1
20.6
34.2
27.2
153.1
Total influenced capacity
- of which BRIC
286.2 100%
111.4 39%
Pan-Indian footprint
18%
7%
12%
10%
54%
Holcim BRIC pro-forma op. EBITDA 20091
16%
8%
4%
Brazil
Russia/CIS
India
China
72%
China – focus on provinces
Attractive positions
Rauri in the Himalayas
>3,000 km
Delhi
Calcutta
Mumbai
• Eight provinces along the
Madras
1
Yangtze River
• Market size of 450M t
• Huaxin – capacity 51M tonnes
Pro-forma incl. China (Holcim participation in Huaxin Cement is 39.9 percent – therefore it’s not fully consolidated)
© Holcim Ltd 2010
SG – Infrastructure, Construction & Building Materials Conference
9
May 19, 2010
Not only BRICs – a lot of other emerging markets
show above average growth rates…
CAGR 2010 – 2020 construction output
10%
Markets with
Holcim presence
No Holcim
presence
World
average
5%
0%
a
a
ia co d y ia E ce ia ia a lic es ca d t m ry co e ia ia
ld
zi l s i i a i n
es exi lanurke rab UAree mb an ntin ub pin fri ilan gyp tna ga roc rainlgar iger
or Bra us IndCh
W
on M Po T i A
R
G olo omrge ep ilip th A ha E VieHunMo Uk Bu N
d
nd
C R A h R Ph ou T
I
u
S
Sa
ec
Cz
…and Holcim holds top-three market positions in most of them
Order of other emerging markets according to construction market size.
Source: Global Construction 2020, Global Construction Perspectives, Oxford Economics, November 2009
© Holcim Ltd 2010
SG – Infrastructure, Construction & Building Materials Conference
10
May 19, 2010
Agenda
1
Strategy and positioning
2
Value driven investment criteria
3
First quarter 2010 results
4
Conclusions
5
Appendix – Maps
11
© Holcim Ltd 2010
SG – Infrastructure, Construction & Building Materials Conference
May 19, 2010
Holcim investment criteria –
set to secure long-term above average returns
Geographic
Diversification
Product Focus
• Strategic fit
• Position taking in line
with maturity profile of
the respective market
• Networking possibilities
and partnerships
Local Management
Global Standards
• GDP growth
• Management and
• Favourable demographics manpower resources
• Resource management
• Deficit markets
• Substantial market share • Local culture
embedment
• Networking
Financials
• Value creation
• Financing in line with
Holcim policy
• Investment scorecard
• Accountability
Success factor – rigorous investment analysis and discipline
12
© Holcim Ltd 2010
SG – Infrastructure, Construction & Building Materials Conference
May 19, 2010
Organic expansion – most efficient way to grow
USA: Ste Genevieve
Indonesia: Tuban Java
Mexico: Hermosillo
Know how from past projects applied to new expansions
13
© Holcim Ltd 2010
SG – Infrastructure, Construction & Building Materials Conference
May 19, 2010
Holcim’s cement capacity expansion projects
Cement capacity in million tonnes
2013
2010
2011
Europe
North America
Latin America
Africa Middle East
Asia Pacific
2.1
1.7
3.8
2.3
1.8
4.1
Total Group
8.0
3.6
Total
1.6
3.5
5.2
1.6
13.1
14
© Holcim Ltd 2010
SG – Infrastructure, Construction & Building Materials Conference
May 19, 2010
Agenda
1
Strategy and positioning
2
Value driven investment criteria
3
First quarter 2010 results
4
Conclusions
5
Appendix – Maps
15
© Holcim Ltd 2010
SG – Infrastructure, Construction & Building Materials Conference
May 19, 2010
Key financial figures
Million CHF
(if not otherwise stated)
Full Year
1st Quarter
+/-
2009
2009
2010
LFL
CIS
Sales volumes
- Cement (mt)
131.9
29.7
31.0
3.4%
1.0%
4.4%
- Aggregates (mt)
143.4
25.1
29.5
-2.8%
20.3%
17.5%
- Ready-mix (mm3)
41.8
8.7
9.5
-4.6%
13.8%
9.2%
21,132
4,523
4'741
-3.3%
6.3%
1.8%
4.8%
Operating EBITDA
4,630
763
909
12.7%
4.7%
1.7%
19.1%
Operating profit
Net income before
minorities
Net income (loss)
Holcim shareholders
Cash flow
2,781
343
460
27.7%
3.2%
3.2%
34.1%
1,958
195
66
-51.3%
0.5% -15.4%
-66.2%
1,471
74
3,888
-161
-257
4.93
0.26
-0.21
Net sales
EPS in CHF 1
1
-68 -154.1%
-72.7%
Calculated on the weighted average number of shares outstanding
Based on IAS 33 the average number of shares was retrospectively increased by 8.8%
© Holcim Ltd 2010
SG – Infrastructure, Construction & Building Materials Conference
FX
Total
1.4% -39.2% -191.9%
1.9%
11.2%
-59.6%
-180.8%
16
May 19, 2010
Operating EBITDA by region
Million CHF
424
1
119
-14
-54
Q1 2008
Q1 2009
Q1 2010
137
507
-29
403
78
419
91
105
284
253
248
Δ Q1 09/Q1 10
Europe
North America
Latin America
Africa Middle East
Asia Pacific
Total
LFL Change in Currency
structure
14.3%
2.5%
-1.7%
40.7%
0.0%
5.6%
-2.4%
0.0%
0.4%
28.2%
-3.8%
-7.7%
8.4%
8.8%
3.8%
12.7%
4.7%
1.7%
Total
15.1%
46.3%
-2.0%
16.7%
21.0%
19.1%
17
© Holcim Ltd 2010
SG – Infrastructure, Construction & Building Materials Conference
May 19, 2010
Outlook 2010 – confirmed
• Europe – markets will recover but only slowly
• North America – no rapid recovery in the construction market
• Latin America and Africa Middle East – expect business to develop
on a stable footing
• Asia Pacific – markets will remain on track for growth
• Australia – the acquisition will make a solid contribution
• Cost savings – the savings implemented in 2009 will be retained
Holcim will start the next upturn from a stronger position
18
© Holcim Ltd 2010
SG – Infrastructure, Construction & Building Materials Conference
May 19, 2010
Agenda
1
Strategy and positioning
2
Value driven investment criteria
3
First quarter 2010 results
4
Conclusions
5
Appendix – Maps
19
© Holcim Ltd 2010
SG – Infrastructure, Construction & Building Materials Conference
May 19, 2010
Conclusions
• Early internationalization – today, Holcim is truly global with strong
positions in the most attractive construction markets worldwide
• Holcim built up a balanced portfolio – approximately 70 percent of
operating EBITDA is generated in fast growing countries
• BRICs account for approximately 30 percent of Holcim’s pro-forma
operating EBITDA
• Challenges in the BRICs are very different and need customized
approaches
• Value driven investment criteria – leverage know how from former
projects to new expansions globally
• Good performance in the first quarter 2010 – organic growth
achieved
Holcim’s strategy has successfully executed on the
opportunities offered by the emerging markets
20
© Holcim Ltd 2010
SG – Infrastructure, Construction & Building Materials Conference
May 19, 2010
Agenda
1
Strategy and positioning
2
Value driven investment criteria
3
First quarter 2010 results
4
Conclusions
5
Appendix – Maps
21
© Holcim Ltd 2010
SG – Infrastructure, Construction & Building Materials Conference
May 19, 2010
Positions in Europe
1
Cement plant
Grinding plant/
terminal
Aggregates
Participation:
1
Cement plant
1
Under construction
Cement capacity: 49.4 million t; further 1.7 million t with partners
22
© Holcim Ltd 2010
SG – Infrastructure, Construction & Building Materials Conference
May 19, 2010
Positions in North America
Cement plant
Grinding plant/
terminal
Aggregates
Cement capacity: 20.6 million t
23
© Holcim Ltd 2010
SG – Infrastructure, Construction & Building Materials Conference
May 19, 2010
Positions in Latin America
1
1
Cement plant
1
Grinding plant/terminal
Aggregates
Participation:
Cement plant
Grinding plant/terminal
Aggregates
1
Under construction
Cement capacity: 31.0 million t; further 3.2 million t with partners
24
© Holcim Ltd 2010
SG – Infrastructure, Construction & Building Materials Conference
May 19, 2010
Positions in Africa Middle East
Cement plant
Grinding plant/terminal
Aggregates
Participation:
Cement plant
Grinding plant/terminal
Aggregates
Cement capacity: 11.2 million t; further 16.0 million t with partners
25
© Holcim Ltd 2010
SG – Infrastructure, Construction & Building Materials Conference
May 19, 2010