holcim in south asia asean paul hugentobler member of the executive committee 2012 holcim ltd
Bạn đang xem bản rút gọn của tài liệu. Xem và tải ngay bản đầy đủ của tài liệu tại đây (2.05 MB, 48 trang )
Strength. Performance. Passion.
© 2012 Holcim Ltd
Holcim in South Asia / ASEAN
Paul Hugentobler, Member of the Executive Committee
© 2012 Holcim Ltd
© 2012 Holcim Ltd
Agenda
Regional Overview and Trends 2
Business Subregion India 12
Business Subregion Lower Mekong Subregion 19
Business Subregion Indonesia 24
Regional Contribution to the Holcim Leadership Journey 31
Concluding Remarks 45
Investor and Analyst Day 2012
2
© 2012 Holcim Ltd
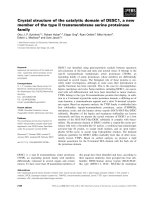
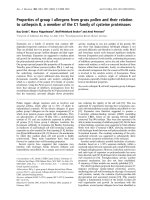
Holcim footprint in South Asia / ASEAN*
• Cement sales 42 mt
• FTEs 34’014
• Net Sales CHF 3.4 bn
• EBITDA CHF 0.9 bn
• Cash Flow CHF 0.5 bn
Key Figures H1 2012
Source: Corporate Controlling
* Association of Southeast Asian Nations
Investor and Analyst Day 2012
3
Integrated Plant
Grinding Station
Under construction
Terminal
© 2012 Holcim Ltd
A relatively young history within Holcim Group
0
10
20
30
40
50
60
70
1912 1920 1930 1940 1950 1960 1970 1980 1990 2010
Qatar
Dubai
India
United Kingdom
Norway
Ireland
Serbia
Croatia
China
New Caledonia
Tanzania
Sri Lanka
Bulgaria
Romania
Honduras
Poland
Kosovo
Madagascar
Mauritius
Guinea
Angola
Iran
Malaysia
Thailand
El Salvador
Dom. Republic
Indonesia
Nicaragua
Guatemala
French Guyana
Azerbaijan
Austria
Ivory Coast
Nigeria
Namibia
La Réunion
Fiji
Haiti
Carib. Islands
Panama
Bangladesh
Yemen
Singapore
Vietnam
Switzerland
France
Belgium
Netherlands
Egypt
Lebanon
Germany
South Africa
Canada
Brazil
USA
Mexico
Costa Rica
Italy
Colombia
New Zealand
Philippines
Ecuador
Chile
Australia
Cyprus
Venezuela
Spain
Hungary
Czech Republic
Greece
Slovak Republic
Morocco
Peru
Argentina
Russia
Europe
Africa Middle East
Asia Pacific
North America
Latin America
Number
of countries
Investor and Analyst Day 2012
4
© 2012 Holcim Ltd
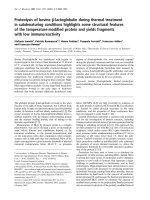
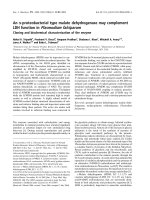
Solid platform: 53% Holcim CEM volume, 27% of Net Sales,
33% of EBITDA in 2011
OpCo
Sales 2011 (t cem /m3 RMX)
EBITDA 2011 (CHF) at actual
2011 constant FX rates
Holcim Lanka
1.5 mt
CHF 21 m
Holcim Bangladesh
0.9 mt
CHF 8 m
Siam City Cement:
11.8 mt / 2.7 mm3
CHF 168 m
Ambuja Cement
21.5 mt
CHF 382 m
Holcim Vietnam
3.7 mt / 0.8 mm3
CHF 47 m
Holcim Malaysia
0.7 mt / 0.3 mm3
CHF 14 m
Holcim Philippines
5.3 mt / 0.1 mm3
CHF 99 m
Holcim Singapore
1.3 mm3
CHF 13 m
Holcim Indonesia
8.0 mt / 1.5 mm3
CHF 235 m
ACC
24.0 mt / 1.8 mm3
CHF 390 m
Source: Corporate Controlling
Quoted companies
Investor and Analyst Day 2012
5
Integrated Plant
Grinding Station
Under construction
Terminal
© 2012 Holcim Ltd
Regional network of manufacturing sites and markets
Holcim
United Arab
Emirates
Middle East,
Holcim Madagascar
Holcim
Reunion
Australia
Australia
Investor and Analyst Day 2012
6
Integrated Plant
Grinding Station
Under construction
Terminal
© 2012 Holcim Ltd
Our regional management approach…
• Robust business growth strategy for every country;
coordinated across region to optimize capacity utilization and
flows of clinker and cement
• Lean Regional Management structure and strong local
management teams
• De-centralized but standardized philosophy deploys making
and accountability to the local management teams
• Focus on functional excellence through faster
multiplication of best practices across the region
• Focus on people development and capability building
Investor and Analyst Day 2012
7
© 2012 Holcim Ltd
…is based on a blend of skills and emotional engagement
Principles
• Ensure leadership development at both the front-line and management level
• Deploy large efforts to internationalize talent across the region and the Group
• Rely on formal levers to achieve alignment (within OpCo’s and across the region),
while focusing on informal levers to mobilize the human capital
• Identify the “pride builders” within the organization and leverage their ability to
energize people
Alignment
Motivation
Vision
Values
Strategy
Integrating
Mechanisms
Purpose
Pride
Commit-
ment
Top
Leaders
Team
Members
Rational
Compliance
Emotional
Commitment
Pride Bell Curve
Energize
Pride Score Indicator (PSI)
Pride
builders
Achieving Alignment and Motivation
Investor and Analyst Day 2012
8
© 2012 Holcim Ltd
Best practice multiplication to accelerate delivery of bottom
line impact
OpCo Leadership OpCo Leadership OpCo Leadership
RMX, LIP (Large and Infrastructure Projects)
Finance
OH&S, Geocycle, Procurement, Manufacturing
People Exchanges
Customer Excellence (CRM, M&S)
Cross-
Regional
Bench-
marking and
Best
Practices
Sharing
Contribution to Holcim Leadership Journey
Investor and Analyst Day 2012
9
© 2012 Holcim Ltd
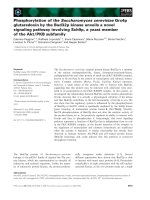
In the past ten years Holcim Group rapidly increased its
exposure to South Asia and ASEAN…
Indexed development of Holcim Group vs. Holcim South Asia / ASEAN (excl. the
Philippines), (2002=100)
Cement Capacity Cement Volumes Sold
Net Sales Operating EBITDA
2002 2004 2006 2008 2010 2012
1′000
800
600
400
200
0
Holcim South Asia / ASEAN Holcim Group
2002 2004 2006 2008 2010 2012
1′000
800
600
400
200
0
2002 2004 2006 2008 2010 2012
1′000
800
600
400
200
0
2002 2004 2006 2008 2010 2012
1′000
800
600
400
200
0
India acquisitions India acquisitions
India acquisitions India acquisitions
Source: Corporate Controlling
Investor and Analyst Day 2012
10
© 2012 Holcim Ltd
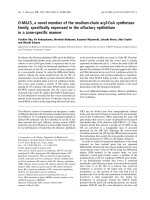
…paying back in increasing Operating EBITDA contribution
359
311
301
285
243
249
350
311
297
298
235
257
234
182
291
237
248
291
225
264
234
229
7%*
2012 2011 2010 2009 2008 2007
Q4 Q3 Q2 Q1
Development of operating EBITDA in South Asia / ASEAN (excl. the Philippines), (CHF m,
at constant exchange rates per 30.6.2012)
* CAGR of H1 results
Source: Corporate Controlling
Investor and Analyst Day 2012
11
© 2012 Holcim Ltd
Agenda
Regional Overview and Trends 2
Business Subregion India 12
Business Subregion Lower Mekong Subregion 19
Business Subregion Indonesia 24
Regional Contribution to Holcim Leadership Journey 31
Concluding Remarks 45
Investor and Analyst Day 2012
12
© 2012 Holcim Ltd
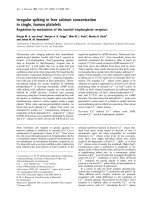
India’s short-term macro environment is challenging…
Population
GDP
Foreign
Exchange
• Subdued real GDP growth at 6 - 6.5% in 2012 as a result of acute
policy paralysis and odds of the World / Euro crisis
• Upside potential to 7% with elections approaching in 2014 and a
push to implement domestic reform
• Continuous population growth of around 2% per annum on a
current base of more than 1.2 billion raises sustainability issues
• Millions of young people aspire to be integrated into the workforce
• Rupee depreciation erodes current factor market benefits
Inflation
• Inflation remains at a high level of around 7%
• Government’s 5% inflation target un-realistic unless major reforms
ease supply pressure and infrastructure development gets pushed
Investor and Analyst Day 2012
13
© 2012 Holcim Ltd
…but long-term growth fundamentals are robust
7.5%
2010-20E
7-8%
2000-10
Sustainable GDP growth
(real GDP CAGR)
1/5 more people in India
(million people)
100 m more in cities
(million urban population)
Trade volume quadruples
(USD m)
HH Consumption doubles
(USD bn)
Infra spending doubles
(USD bn; 5 year plan)
~1,400
~18%
2020E 2010
1,185
365
~475
~110
2020E 2010
583
~2,500
~4.3x
2020E 2010
534
~1,000
~2x
2020E 2010
514
800-1,000
1.5-2x
12
th
Plan 11
th
Plan
Source: McK Consumer India; Urbanisation, EIU, Planning Commission of India, 2012
Investor and Analyst Day 2012
14
© 2012 Holcim Ltd
Cement demand to grow at 8-9% p.a. over the next years
• Overall cement demand expected to reach around 341 mt in 2016
• More conservative growth assumptions in 2012/13 due to overall macro situation;
upcoming election cycle push expected in 2014
Cement demand of India 2006-2016E (mt)
341
312
286
263
242
224
212
193
174
160
146
2016E 2015E 2014E 2013E 2012E 2011 2010 2009 2008 2007 2006
+8.9%
+8.7%
10.1 9.3 9.0 10.8 5.6 7.8 8.9 9.2
x Y-o-y growth
9.1 8.6
Source: ACC / ACL D/S workshops, CRISIL 2012, McK 2011
Investor and Analyst Day 2012
15
© 2012 Holcim Ltd
Supply surplus situation remains, however, demand / supply
ratio is improving
• Slow down in available supply growth as most capacities from the 2007 up-cycle are
commissioned by now
• New projects get delayed due to lack of financing availability, difficult land acquisition
and lengthy processes to obtain permits
• Roughly 70% excess supply is located in the South
All India demand / supply 2011-2016E (mt)
341
312
286
263
242
224
400
380
352
331
310
290
2016E
2015E
2014E
2013E
2012E
2011
Demand / available
supply
77% 78% 79% 81%
Available supply
Demand
82% 85%
Source: ACC / ACL D/S workshops, CRISIL 2012, McK 2011
Investor and Analyst Day 2012
16
© 2012 Holcim Ltd
Holcim is competitively positioned in core growth markets
Investor and Analyst Day 2012
17
Integrated Plant
Grinding Station
Terminal
Existing ACL
Existing ACC
Under construction
• Holcim presence through ACC Ltd and
Ambuja Cements Ltd
► 11 plants and 13 grinding units with a
total capacity of ~58 mio t cement
► 50+ Ready-mix concrete plants
► Terminals along the West cost to
serve core markets
► Projects in implementation stage
include Jamul, Sindri, Kharagphur,
Mangalore, Sankrail; others in
planning
• Total sales 2011 of ~45 mt
• CHF ~3.5 bn net sales, CHF ~773 m
EBITDA (2011)
• ~23‘400 FTE (2011)
© 2012 Holcim Ltd
• “Zero Harm to People” to become a license to lead
• Capturing growth potential and sustaining our competitive position
• Capacity expansion of approx. 15 mtpa over the next 5 years
• Attractive acquisition target where available for sale
• Identification of new raw material sources to ensure tomorrow’s growth (e.g.
limestone, clay, slag, fly-ash)
• Most agile and efficient supply chain of the industry to reduce costs-to-
serve
• Energy, e.g. fuels, AFR, clinker factor, operational efficiencies
• Logistics (in- and outbound)
• Customer-centricity and front end-innovation across all market segments
• People and Leaders
• Attracting and retaining talent remains an ongoing challenge
• Training and development of people and leaders to ensure skills at all levels
• Top quartile financial performance in the Indian cement industry
Strategic priorities for India
Investor and Analyst Day 2012
18
© 2012 Holcim Ltd
Agenda
Regional Overview and Trends 2
Business Subregion India 12
Business Subregion Lower Mekong Subregion 19
Business Subregion Indonesia 24
Regional Contribution to Holcim Leadership Journey 31
Concluding Remarks 45
Investor and Analyst Day 2012
19
© 2012 Holcim Ltd
*
Five heterogeneous countries constitute the LMS*…
Thailand
Vietnam
Cambodia
Myanmar
Laos
Naypyidaw
Bangkok
Vientiane
Hanoi
Ho Chi Minh City
Phnom Penh
6.3
48.3
14.3
87.8
69.5
LA MM KH VN TH
Population per Country, 2011
(million)
GDP, 2011
(USD bn)
Source: World Bank, IMF
7.9
51.9
12.9
122.7
345.6
LA MM KH VN TH
Yangon
* Lower Mekong Subregion
Investor and Analyst Day 2012
20
© 2012 Holcim Ltd
…however, united through economic corridor approach
• Introduction of Greater Mekong
Subregion Program by ADB (Asian
Development Bank) in 1992 to
enhance economic cooperation /
development
• Economic corridor approach since
1998 to leverage potential of specific
geographic areas
• Corridors based on cross-border
physical transport linkages opening up
various development opportunities
• Physical links well progressed as of
today, economic integration has yet to
be achieved
Investor and Analyst Day 2012
21
© 2012 Holcim Ltd
Cement demand expected at more than 120 mtpa by 2020
9
8
8
7
2
2
2
2
1
1
1
1
1
1
1
1
+5.1%
+4.8%
20E
+4.6%
123
37
71
4
3
19E
118
35
68
4
3
18E
113
34
64
4
2
17E
108
33
61
3
2
16E
103
32
58
3
7
15E
98
32
55
3
6
14E
93
31
52
3
6
13E
89
30
49
3
5
12E
84
29
46
3
5
11
81
28
44
3
5
10
79
27
43
3
5
09
72
25
40
2
4
08
68
26
36
3
3
07
68
29
34
2
3
06
65
30
30
2
2
05
61
30
27
2
2
Thailand Vietnam Cambodia Myanmar Laos
Cement demand of Lower Mekong Subregion 2005-2020E (in mtpa)
• Infrastructure demand as main driver for cement demand growth in next decade
(hydropower dams, bridges and tunnels for railway projects, deep sea ports etc.)
• Urbanization and development of 2
nd
and 3
rd
tier cities will be main drivers
Source: Holcim estimates
Investor and Analyst Day 2012
22
© 2012 Holcim Ltd
Competitive positions in South Vietnam and Thailand
SCCC / Holcim Vietnam’s positions in the Lower Mekong Subregion
SCCC / HVL Integrated Plant
SCCC / HVL Grinding Station
SCCC / HVL Terminal
Cost Competitive Position (Core)
Border Sales
Holcim Vietnam
We still need to network
these regions with an
expanded asset
footprint
Investor and Analyst Day 2012
23
© 2012 Holcim Ltd
Agenda
Regional Overview and Trends 2
Business Subregion India 12
Business Subregion Lower Mekong Subregion 19
Business Subregion Indonesia 24
Regional Contribution to Holcim Leadership Journey 31
Concluding Remarks 45
Investor and Analyst Day 2012
24
© 2012 Holcim Ltd
Indonesia is growing faster and gaining confidence
Middle class population is growing fast
GDP growth is promising Infrastructure investment priorities are set
205
2
Rail
37
Airport
4
Energy
78
Port
13
Road
39
Total Others
4
ICT
28
Utility
(USD bn)
Indonesia’s investment ratings upgraded
• Moody’s Baa3 (investment grade)
• Fitch’s BBB- (investment grade)
• Standard & Poor’s BB+ (one notch
to investment grade)
600
400
200
0
5.9%
6.3%
5.8%
5.5%
2020 2011 2002
Real GDP per capita
2020
269
171
98
2011
246
72
174
10%
-6%
1%
CAGR
(millions)
Middle Class Others
(USD bn at 2005 prices)
Source: Central Statistics Bureau, MP3EI, HIL analysis
Investor and Analyst Day 2012
25