we have strengthened our position in asia half year report holcim 2002
Bạn đang xem bản rút gọn của tài liệu. Xem và tải ngay bản đầy đủ của tài liệu tại đây (339.93 KB, 18 trang )
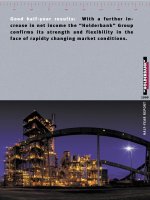
We have strengthened our position in Asia.
Half-Year
Report
2002
Operating
targets
achieved
–
strong
Swiss
franc
hurts
results
Sales volumes increased again in our three core segments cement, aggregates and re
ady-mix concrete. Practi-
cally all Group companies achieved their operating targets as measured in local curre
ncy, partly because the
selective restructurings of recent years have started to bear fruit. Consolidated net sa
les of CHF 6,441 million
(first half 2001: 6,582) fell just short of the strong results in the first six months of 20
01 owing to currency
movements. Main factors were the weakness of the US dollar as well as the euro. In a
ddition, a number
of local currencies in Latin America, the South African rand and the Egyptian pound a
ll fell substantially.
Adjusting for currency movements, consolidated sales exceeded the results in the cor
responding year-back
period, and also consolidated operating profit of CHF 935 million (first half 2001: 997)
compared favorably
with the same period in the previous year. EBITDA at CHF 1,706 million (first half 200
1: 1,789) held up well.
Cash flow from operating activities rose by 26.6 percent to CHF 781 million (first half
2001: 617), which is
a gratifying result. However, Group net income after minority interests posted a drop
to CHF 292 million
in the first half of 2002 (first half 2001: 397). The reason for this is additional ordinary
income. It fell from
CHF 102 million in the first half of 2001 to CHF -18 million in the first half of 2002, lar
gely due to depreciation
and amortization of non-operating assets of CHF 63 million related to the unresolved
crisis in Argentina,
lower interest income owing to market developments and a fall in dividend income fr
om affiliated companies.
Increased
efficiency
in
Europe
Developments in the economic environment in Europe did not hold any surprises. W
hile building activity
remained brisk in Spain, the crisis in the German construction industry worsened. Mo
st countries in central
and eastern Europe reported solid demand for building materials. Consolidated ceme
nt sales and deliveries of
aggregates were both up. Only sales of ready-mix concrete came in slightly below
the figure for the previous
year. Operating profit for Group region Europe posted an above-average gain of 12.3
percent to reach CHF 274
million (first half 2001: 244). This substantial improvement reflects the success of rati
onalization measures in
the preceding years.
Production
bottleneck
in
Colorado
(USA)
removed
In the Portland plant, clinker production started on schedule in the second quarter of
2002. This gradually
removed the production bottleneck that had existed in the US Midwest for the previo
us year. The commission-
Key
Figures
Group
Holcim
January–June 2002 2001 ±%
Annual cement production capacity
million t
139.7 121.2
+15.
3
Sales of cement and clinker
million t
43.5 42.1 +3.3
Sales of aggregates
million t
42.3 40.0 +5.8
Sales of ready-mix concrete
million m
3
12.2 12.2 –
Personnel
number
50,128 48,022 +4.4
Net sales
million CHF
6,441 6,582 –2.1
Operating profit
million CHF
935 997 –6.2
EBITDA
million CHF
1,706 1,789 –4.6
Cash flow from operating activities
million CHF
781 617 +26.
6
Group net income before minority interests
million CHF
427 511 –16.4
Group net income after minority interests
million CHF
292 397 –26.4
Earnings per dividend-bearing bearer share
CHF
7.48 10.56 –29.2
Earnings per dividend-bearing registered
share CHF
1.50 2.11 –28.9
Earnings per bearer share pre goodwill amor
tization CHF
11.22 13.78 –18.6
2 Shareholders’
Letter
Strong
volume
growth
in
Asia
Pacific
Economic recovery in the ASEAN region continues to make good progress. The buildi
ng sector in particular is
expanding robustly on the back of strong growth in residential construction in sever
al countries. Shipments of
cement from our Thai company exceeded expectations, and all plants in Saraburi are
operating at full capacity.
Sales growth in the region was bolstered by the full consolidation of the Indonesian
PT Semen Cibinong, which
we acquired at the end of 2001. The Group’s company in Australia also managed to in
crease sales of cement,
and its aggregates and ready-mix concrete segments reported substantially higher
volumes. However, in the
first half of 2002, operating profit in Group region Asia Pacific declined 6.9 percent to
CHF 81 million (first half
2001: 87), due to the cost of integrating our newly consolidated Indonesian subsidiar
y.
The
flattening
global
economy
and
negative
currency
developments
influence
the
out
look
for
the
year
In recent months, overall economic conditions have deteriorated perceptibly, and so
me countries have had to
revise their growth forecasts downwards. Despite the progress made in our operatio
ns in the first half of 2002,
factors beyond our control remain a source of uncertainty. This applies particularly to
international economic
developments and to currency movements vis-à-vis the Swiss franc. Given the
current economic situation,
it seems unlikely that we will match last year’s results. However, thanks to consistent
programs to improve
efficiency, a general trend of falling interest rates and measures taken to stabilize the
financial markets, we
are confident about the medium-term outlook.
Dr. Willy Kissling Markus Akermann
Chairman of the Board of Directors a.i. CEO
Konzernabschluss
3
Shareholders’
Letter
Consolidated
Statement
of
Income
of
Group
Holcim
Million CHF
Notes
January–
June
2002
Unaudit
January–
June
2001
Unaudit
±% April–
June
2002
Unaudit
April–
June
2001
Unaudit
±%
Net
sales
4
6,441 6,582–2.1 3,594 3,719–3.4
Production cost of goods sold (3,336) (3,438) (1,803) (1,868)
Gross
profit 3,105 3,144–1.2 1,791 1,851–3.2
Distribution and selling expenses (1,421) (1,450) (765) (800)
Administration expenses (602) (577) (325) (318)
Other depreciation and amortization (147) (120) (76) (60)
Operating
profit
5
935 997 –6.2 625 673 –7.1
Additional ordinary income (expenses
) 6
(18) 102 (32) 69
EBIT 917 1,099–16.6 593 742–20.1
Financial expenses
7
(247) (344) (119) (171)
Group
net
income
before
taxes 670 755–11.3 474 571–17.0
Income taxes (243) (244) (176) (180)
Group
net
income
before
minority
int
erests
427 511–16.4 298 391–23.8
Minority interests (135) (114) (83) (76)
Group
net
income
after
minority
inter
ests
292 397–26.4 215 315–31.7
CHF
Earnings per dividend-bearing
bearer share 7.48 10.56–29.2
Fully diluted earnings per bearer shar
e
7.45 10.38–28.2
Earnings per dividend-bearing
registered share 1.50 2.11–28.9
Fully diluted earnings per registered
hare
1.49 2.08–28.4
4
Consolidated
Statement
of
Income
Consolidated
Consolidated
Balance
Sheet
of
Group
Holcim
Million CHF 30.06.20
02
Unaudit
30.06.20
01
Unaudit
31.12.20
01
Audite
Cash and cash equivalents 2,817 1,108 2,137
Marketable securities 90 538 105
Accounts receivable 2,581 3,192 2,456
Inventories 1,325 1,581 1,416
Prepaid expenses and other current assets 264 318 253
Total
current
assets 7,077 6,737 6,367
Financial investments 2,373 3,082 3,312
Property, plant and equipment 14,189 14,610 14,235
Intangible and other assets 3,079 3,321 3,130
Total
long-term
assets 19,641 21,013 20,677
Total
assets 26,718 27,750 27,044
Trade accounts payable 1,088 1,152 1,187
Current financing liabilities 2,678 4,177 2,729
Other current liabilities 1,235 1,519 1,342
Total
short-term
liabilities 5,001 6,848 5,258
Long-term financing liabilities 10,053 8,500 9,281
Deferred taxes 1,119 1,291 1,213
Long-term provisions 880 972 909
Total
long-term
liabilities 12,052 10,763 11,403
Total
liabilities 17,053 17,611 16,661
Interests
of
minority
shareholders 2,694 2,043 2,741
Authorized capital 402 402 402
Reserves 6,569 7,694 7,240
Total
shareholders’
equity 6,971 8,096 7,642
Total
liabilities
and
shareholders’
equity 26,718 27,750 27,044
5
6
Statement
of
Changes
in
Consolidated
Equity
Statement
of
Changes
in
Consolidated
Equity
of
Group
Holcim
January–June
Million CHF
2002
Unaudit
ed
2001
Unaudit
ed
Authorized capital as at January 1 402 377
Capital paid-in 0 25
Authorized
capital
(A) 402 402
Reserves
Capital surplus as at January 1 2,570 1,945
Capital paid-in 0 631
Shareholders’ equity – convertible bonds 54 0
Capital
surplus
(B1) 2,624 2,576
Retained earnings as at January 1 4,665 4,703
Change in treasury shares (5) (369)
Profit distribution (195) (188)
Group net income after minority interests 292 397
Effect of increase in participations (5) (7)
Gain on cash flow hedges 8 0
Gain on available-for-sale securities 20 0
Retained
earnings
(B2) 4,780 4,536
Currency translation adjustments as at January 1 5 75
Currency translation adjustments (840) 507
Currency
translation
adjustments
(B3) (835) 582
Total
reserves
(B1+B2+B3) 6,569 7,694
Total
shareholders’
equity
(A+B1+B2+B3) 6,971 8,096
Consolidated
Consolidated
Cash
Flow
Statement
of
Group
Holcim
January–June
Million CHF
2002
Unaudit
ed
2001
Unaudit
ed
±%
Operating
profit 935 997 –6.2
Depreciation and amortization of operating assets 721 681
Other non-cash items (10) 49
Change in net working capital (375) (662)
Cash
generated
from
operations 1,271 1,065 +19.3
Additional ordinary income 57 97
Interest paid (309) (338)
Income taxes paid (238) (207)
Cash
flow
from
operating
activities
(A) 781 617 +26.6
Investments in property, plant and equipment net (551) (780)
Financial investments net (155) (1,217)
Cash
flow
from
investing
activities
(B) (706) (1,997) +64.6
Dividends paid (314) (290)
Equity capital paid-in 54 656
Movements of treasury shares net (5) (362)
Increase in current financing liabilities 120 309
Proceeds from long-term financing liabilities 1,587 833
Repayment of long-term financing liabilities (631) (494)
Decrease in marketable securities 4 214
Cash
flow
from
financing
activities
(C) 815 866 –5.9
In(De)crease
in
cash
and
cash
equivalents
(A+B+C) 890 (514)
Cash
and
cash
equivalents
as
at
January
1 2,137 1,536
In(De)crease in cash and cash equivalents 890 (514)
Effects of exchange rate movements (210) 86
Cash
and
cash
equivalents
as
at
June
30 2,817 1,108
7
1
Basis
of
Preparation
The unaudited consolidated second quart
er interim financial
statements (hereafter ‘interim financial st
atements’) are pre-
pared in accordance with IAS 34 Interim Fi
nancial Reporting.
The accounting policies used in the prepar
ation of the interim
financial statements and the presentation
are consistent with
those used in the consolidated financial st
atements for the
year ended December 31, 2001 (hereafter ‘
annual financial
statements’). The interim financial statem
ents should be read
in conjunction with the annual financial st
atements as they
provide an update of previously reported i
nformation.
The preparation of interim financial state
ments requires man-
agement to make estimates and assumpti
ons that affect the
reported amounts of revenues, expenses, a
ssets, liabilities and
disclosure of contingent liabilities at the d
ate of the interim
financial statements. If in the future such
estimates and
assumptions, which are based on manage
ment’s best judg-
ment at the date of the interim financial st
atements, deviate
from the actual circumstances, the origina
l estimates and
assumptions will be modified as appropria
te during the period
in which the circumstances change.
There were no significant changes in accounting policies
or estimates or in any provisions or impairment charges
from those disclosed in the annual financial statements.
3
Segment
Information
Information by regi
on
Europ
e
North
Americ
a
Latin
Americ
a
Africa
Middle E
ast
Asia
Pacific
Corporat
e /
Eliminatio
Total
Group
January–June 20022001200220012002200120022001200220012002200120022001
Income
statement
Million CHF
Net sales 2,2572,2181,2441,3711,7311,879537 603 843 675(171)(164)6,4416,582
Operating profit 274 244 77 157 417 425 120 111 81 87 (34) (27) 935 997
Capacity
and
sales
Million t
Production capacity
cement
40.3 37.3 21.3 19.5 32.6 30.9 13.1 12.4 32.4 21.1 0 0 139.7121.2
Sales of cement an
d clinker
12.5 12.0 7.4 7.9 9.1 9.3 5.6 5.6 11.5 7.2 (2.6) 0.1 43.5 42.1
Sales of aggregates23.2 22.1 6.1 5.4 6.3 6.1 4.3 4.3 2.4 2.1 0 0 42.3 40.0
Million m
3
Sales of ready-mix
concrete
5.8 6.1 1.1 1.1 3.6 3.6 0.7 0.7 1.0 0.7 0 0 12.2 12.2
2
Changes
in
the
Scope
of
Consolidation
and
Other
Significant
Acquisitions
The following significant changes were made during the six
months to June 30, 2002:
PT Semen Cibinong Tbk. (Indonesia) was fully consolidated
from January 1, 2002 onwards. It was accounted for as a finan-
cial investment at December 31, 2001 because control was not
effectively transferred to the Holcim Group at that date.
8 Notes
to
the
Consolidated
Financial
Statements
of Cimpor shares, to foreign exchange mo
vements and to
the lower interest rate level. The position “
Depreciation and
and amortization of non-operating assets
in Argentina.
exchange rates and the generally lower interest rate level.
Foreign exchange gain net derived mainly from Latin American
currencies.
January–June
Million CHF
2002 2001
Volume and price 12 9
Change in structure (17) 55
Currency translation adjustments (57) 0
Total (62) 64
4
Change
in
Consolidated
Net
Sales
January–June
Million CHF
2002 2001
Volume and price 32 165
Change in structure 188 232
Currency translation adjustments (361) (62)
Total (141) 335
7
Fi
nancial
Expenses
January–June
Million CHF
2002 2001
Financial expenses (329) (396)
Interest earned on cash and cash equivalents 30 36
Foreign exchange gain (loss) net 38 (5)
Financial expenses capitalized 14 21
Total (247) (344)
6
Additional
Ordinary
Income
(Expenses)
January–June
Million CHF
2002 2001
Dividends earned 28 55
Financial income 3 33
Other ordinary income 19 23
Depreciation and amortization of non-operating assets (68) (9)
Total (18) 102
The reduction in financial income is due to losses on the sale amortization of non-operating assets” includes depreciation
The reduction in financial expenses is due to lower foreign
Notes
to
the
Consolidate
d
Financial
Statements
9
8
Contingent
Liabilities
In the ordinary course of business, the Group is involved in
lawsuits, claims, investigations and proceedings, including
product liability, commercial, environmental and health and
safety matters. No significant changes in the Group’s contin-
gent liabilities have occurred since the last annual financial
statements.
9
Post-Balance
Sheet
Events
There were no significant post-balance sheet events.
10
Principal
Exchange
Rates
Income state
ment
Average exchange rates in C
Balance sh
eet
Closing exchange ra
2002 2001 ±%
30.06.20
02
30.06.20
01
31.12.20
01
1 EUR 1.47 1.53 –3.9 1.47 1.52 1.48
1 USD 1.63 1.72 –5.2 1.48 1.80 1.68
1 CAD 1.04 1.12 –7.1 0.99 1.18 1.05
1 ZAR 0.15 0.22 –31.8 0.14 0.22 0.14
1 AUD 0.87 0.89 –2.2 0.84 0.91 0.86
1 NZD 0.73 0.72 +1.4 0.73 0.73 0.70
10
Notes
to
the
Consolidated
Financial
Statements
Holcim
securities
The shares are listed on SWX Swiss Exchan
ge. The bearer share
has security code No. 1221406 and qualifie
s for Swiss market
index SMI and is traded on virt-x. The
registered share has
security number 1221405 and is traded on
SWX. The bearer
share is also traded on the Frankfurt Stock
Exchange and in
the form of ADRs in the US. Telekurs lists t
he bearer share
under the code HOL and the registered sh
are under HOLN.
Cautionary
statement
regarding
forward-
looking
statements
This document may contain certain forwar
d-looking state-
ments relating to the future Group’s busin
ess, development
and economic performance.
Such statements may be subject to a num
ber of risks, uncer-
tainties and other important factors, such
as but not limited
to (1) competitive pressures; (2) legislative
and regulatory
developments; (3) global, macro-economic
and political trends;
(4) fluctuations in currency exchange rate
s and general finan-
The corresponding codes under Bloomber
g are HOL VX and
HOLN SW, while Reuters uses the abbrevia
tions HOLZ.S
and HOLZn.S. Every share, regardless of wh
ether bearer or
registered, carries one voting right. The ma
rket capitalization
of Holcim Ltd amounted to approximately
CHF 13.7 billion at
June 30, 2002.
cial market conditions; (5) delay or inabilit
y in obtaining
approvals from authorities; (6) technical d
evelopments;
(7) litigation; (8) adverse publicity and new
s coverage, which
could cause actual development and resul
ts to differ mate-
rially from the statements made in this do
cument.
Holcim assumes no obligation to update o
r alter forward-
looking statements whether as a result of
new information,
future events or otherwise.
Financial
Reporting
Calendar
Third
quarter
2002
results
conference
for
press
and
analysts
November
7,
2002
2002
annual
results
conference
for
press
and
analysts
March
19,
2003
First
quarter
2003
results
May
13,
2003
General
Meeting
of
Shareholders
June
04,
2003
Dividend
payment
June
10,
2003
First
half
2003
results
August
28,
2003
Third quarter 2003 results November 12,
2003
11
Holcim Ltd
Zürcherstrasse 156
CH-8645 Jona/Switzerland
Phone +41 58 858 86 00
Fax +41 58 858 86 09
www.holcim.com
Corporate Communications
Roland Walker
Phone +41 58 858 87 10
Fax +41 58 858 87 19
Investor Relations
Bernhard A. Fuchs
Phone +41 58 858 87 20
Fax +41 58 858 86 69
Holcim
Ltd
Zürcherstrasse
156
CH-8645
Jona/Switzerland
Phone
+41
58
858
86
00
Fax
+41
58
858
86
09
www.holcim.com


