Luận văn: Những nhân tố ảnh hưởng đến sản xuất bánh mì ngọt phần 7 pot
Bạn đang xem bản rút gọn của tài liệu. Xem và tải ngay bản đầy đủ của tài liệu tại đây (79 KB, 9 trang )
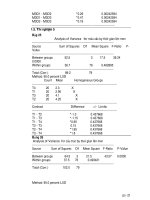
B ng 4
ANOVA Table
Analysis of Variance for v by lo i b t
Source Sum of Squares Df Mean Square F-Ratio
P-Value
Between groups 0.233333 2 0.116667 0.19
0.8261
Within groups 34.7 57 0.608772
Total (Corr.) 34.9333 59
Multiple Range Tests
Method: 95.0 percent LSD
Count Mean Homogeneous Groups
Dai Phong 20 3.85 X
Hong Ha 20 3.8 X
Binh Dông 20 3.95 X
Contrast Difference +/- Limits
Binh Dong Dai phong 0.15 0.494075
Binh Dong Hong Ha 0.1 0.494075
Dai Phong Hong Ha -0.05 0.494075
B ng 5
ANOVA Table
Analysis of Variance for n by lo i b t
Source Sum of Squares Df Mean Square F-Ratio P-Value
Between groups 0.267172 2 0.133586 27959.88 0.0000
Within groups 0.0000286667 6 0.00000477778
Total (
Method: 95.0 percent LSD
pc- 3
Count Mean Homogeneous Groups
Binh Dong 3 1.176 X
Hong Ha 3 1.236 X
Dai Phong 3 1.354 X
Contrast Difference +/- Limits
Binh Dong - Dai Phong *-0.118333 0.00436704
Binh Dong - Hong Ha *-0.41 0.00436704
Dai Phong - Hong Ha *-0.291667 0.00436704
1
1
.
.
2
2
.
.
T
T
h
h
í
í
n
n
g
g
h
h
i
i
m
m
2
2
B ng 6
ANOVA Table
Analysis of Variance for c u trúc by hàm l ng n c
Source Sum of Squares Df Mean Square F-Ratio P-Value
Between groups 51.75 3 17.25 31.07 0.0000
Within groups 42.2 76 0.555263
Total (Corr.) 93.95 79
Multiple Range Tests
Method: 95.0 percent LSD
Count Mean Homogeneous Groups
N1 20 1.85 X
N2 20 2.25 X
N4 20 3.05 X
N3 20 3.95 X
Contrast Difference +/- Limits
N1 - N2 -0.4 0.469319
N1 - N3 *-2.1 0.469319
N1 - N4 *-1.2 0.469319
N2 - N3 *-1.7 0.469319
pc- 4
B ng 7
ANOVA Table
Analysis of Variance for màu s c by hàm l ng n c
Source Sum of Squares Df Mean Square F-Ratio P-Value
Between groups 48.25 3 16.0833 31.10 0.0000
Within groups 39.3 76 0.517105
Total (Corr.) 87.55 79
Method: 95.0 percent LSD
Count Mean Homogeneous Groups
N1 20 2.2 X
N2 20 2.25 X
N4 20 3.15 X
N3 20 4.1 X
Contrast Difference +/- Limits
N1 - N2 -0.05 0.452906
N1 - N3 *-1.9 0.452906
N1 - N4 *-0.95 0.452906
N2 - N3 *-1.85 0.452906
N2 - N4 *-0.9 0.452906
N3 - N4 *0.95 0.452906
B ng 8
Analysis of Variance for mùi by hàm l ng n c
Source Sum of Squares Df Mean Square F-Ratio P-Value
Between groups 41.8 3 13.9333 25.09 0.0000
Within groups 42.2 76 0.555263
Total (Corr.) 84.0 79
pc- 5
Method: 95.0 percent LSD
Count Mean Homogeneous Groups
N1 20 1.95 X
N2 20 2.85 X
N4 20 3.25 X
N3 20 3.95 X
Contrast Difference +/- Limits
N1 - N2 *-0.9 0.469319
N1 - N3 *-2.0 0.469319
N1 - N4 *-1.3 0.469319
N2 - N3 *-1.1 0.469319
N2 - N4 -0.4 0.469319
N3 - N4 *0.7 0.469319
B ng 9
ANOVA Table
Analysis of Variance for v by hàm l ng n c
Source Sum of Squares Df Mean Square F-Ratio P-Value
Between groups 3.1375 3 1.04583 1.95 0.1293
Within groups 40.85 76 0.5375
Total (Corr.) 43.9875 79
pc- 6
Method: 95.0 percent LSD
Count Mean Homogeneous Groups
N1 20 3.25 X
N2 20 3.35 XX
N4 20 3.6 XX
N3 20 3.75 X
Contrast Difference +/- Limits
Col_1 - Col_2 -0.1 0.461751
Col_1 - Col_3 *-0.5 0.461751
Col_1 - Col_4 -0.35 0.461751
Col_2 - Col_3 -0.4 0.461751
Col_2 - Col_4 -0.25 0.461751
Col_3 - Col_4 0.15 0.461751
B ng 10
ANOVA Table
Analysis of Variance for x p by hàm l ng n c
Source Sum of Squares Df Mean Square F-Ratio P-
Value
Between groups 87.0 3 29.0 87.00 0.0000
Within groups 2.66667 8 0.333333
Total (Corr.) 89.6667 11
pc- 7
Method: 95.0 percent LSD
Count Mean Homogeneous Groups
N1 3 63.3333 X
N2 3 65.3333 X
N4 3 68.3333 X
N3 3 70.3333 X
Contrast Difference +/- Limits
N1 - N2 *-2.0 1.08706
N1 - N3 *-7.0 1.08706
N1 - N4 *-5.0 1.08706
N2 - N3 *-5.0 1.08706
N2 - N4 *-3.0 1.08706
N3 - N4 *2.0 1.08706
B ng 11
ANOVA Table
Analysis of Variance for n by hàm l ng n c
Source Sum of Squares Df Mean Square F-Ratio P-
Value
Between groups 0.25266 3 0.0842201 822.33
0.0000
Within groups 0.000819333 8 0.000102417
Total (Corr.) 0.25348 11
pc- 8
Method: 95.0 percent LSD
Count Mean Homogeneous Groups
N1 3 0.96 X
N2 3 1.057 X
N4 3 1.11267 X
N3 3 1.35367 X
Contrast Difference +/- Limits
N1 - N2 *-0.097 0.0190546
N1 - N3 *-0.393667 0.0190546
N1 - N4 *-0.152667 0.0190546
N2 - N3 *-0.296667 0.0190546
N2 - N4 *-0.0556667 0.0190546
N3 - N4 *0.241 0.0190546
1
1
.
.
3
3
.
.
T
T
h
h
í
í
n
n
g
g
h
h
i
i
m
m
3
3
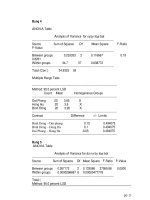
B ng 12
ANOVA Table
Analysis of Variance for c u trúc by n ng b
Source Sum of Squares Df Mean Square F-Ratio P-Value
Between groups 46.1375 3 15.3792 32.15 0.0000
Within groups 36.35 76 0.478289
Total (Corr.) 82.4875 79
Multiple Range Tests
Method: 95.0 percent LSD
Count Mean Homogeneous Groups
C1 20 2.15 X
C2 20 3.3 X
C4 20 3.9 X
C3 20 4.1 X
pc- 9
B ng 13
ANOVA Table
Analysis of Variance for màu s c by n ng b
Source Sum of Squares Df Mean Square F-Ratio P-Value
Between groups 20.7375 3 6.9125 16.29 0.0000
Within groups 32.25 76 0.424342
Total (Corr.) 52.9875 79
Multiple Range Tests
Method: 95.0 percent LSD
Count Mean Homogeneous Groups
C4 20 2.7 X
C1 20 3.15 X
C2 20 3.65 X
C3 20 4.05 X
B ng 14
Analysis of Variance for mùi by n ng b
Source Sum of Squares Df Mean Square F-Ratio P-Value
Between groups 24.0 3 8.0 16.00 0.0000
Within groups 38.0 76 0.5
Total (Corr.) 62.0 79
Method: 95.0 percent LSD
Count Mean Homogeneous Groups
C1 20 2.7 X
C2 20 3.3 X
C4 20 3.9 X
C3 20 4.1 X
Contrast Difference +/- Limits
C1 - C2 *-0.6 0.445352
C1 - C3 *-1.4 0.445352
C1 - C4 *-1.2 0.445352
C2 - C3 *-0.8 0.445352
C2 - C4 *-0.6 0.445352
C3 - C4 0.2 0.445352
pc- 10
B ng 15
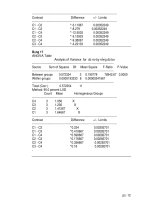
Analysis of Variance for v by n ng b
Source Sum of Squares Df Mean Square F-Ratio P-Value
Between groups 28.25 3 9.41667 20.05 0.0000
Within groups 35.7 76 0.469737
Total (Corr.) 63.95 79
Method: 95.0 percent LSD
Count Mean Homogeneous Groups
C1 20 2.25 X
C4 20 2.7 X
C2 20 3.35 X
C3 20 3.8 X
Contrast Difference +/- Limits
C1 - C2 *-1.1 0.431664
C1 - C3 *-1.55 0.431664
C1 - C4 *-0.45 0.431664
C2 - C3 *-0.45 0.431664
C2 - C4 *0.65 0.431664
C3 - C4 *1.1 0.431664
B ng 16
ANOVA Table
Analysis of Variance for m by n ng b
Source Sum of Squares Df Mean Square F-Ratio P-Value
Between groups 275.226 3 91.741926211984.09 0.0000
Within groups 0.000028 8 0.0000035
Total (Corr.) 275.226 11
Method: 95.0 percent LSD
Count Mean Homogeneous Groups
C1 3 30.1357 X
C2 3 33.2553 X
C3 3 38.4147 X
C4 3 42.636 X
pc- 11