Gear Noise and Vibration Episode 1 Part 6 pps
Bạn đang xem bản rút gọn của tài liệu. Xem và tải ngay bản đầy đủ của tài liệu tại đây (934.85 KB, 20 trang )
80
Chapter
6
100
M Ohm
r^AAAA
470 Ohm
lOkOhm
output
Fig 6.2
Simple circuit
for fixed
gain charge
amplifier.
Where
consistency, robustness
and
reliability matter, these basic
single
purpose circuits
can be
preferable
to the
standard commercial boxes
which
must
cater
for an
extremely wide range
of
operating conditions
and are
correspondingly much more complex.
A
standard
die
cast
box
will take
the
circuit
with
its
mains adaptor
or
batteries
(rechargeable)
and can
easily
be
sealed against showers
so
that
it can
operate outside
in all
weathers.
Any
high input impedance
(>100MQ)
operational amplifier with
a
gain-times-frequency
response
> 1 MHz can be
used.
It
seems wasteful
but a
convenient
amplifier
to use is an
LF444
or
LF347 which have
4
op-amps
on a
single circuit
as
single versions
of
this performance
are not
easily available
and it is
easier
to use one
amplifier
for a
range
of
requirements.
Using
a
standard
[2]
very economical
accelerometer
of
mass about
20
gram,
with
a
typical output
of 27
pC/g (pico Coulombs
of
charge
per g
acceleration),
we
have about
600
mV
per g
acceleration
or 60
mV
per
m
s
2
.
As the
frequency drops,
the
acceleration, which
is
proportional
to
frequency
squared, drops rapidly
so
that
by 5 Hz an
amplitude
of 1
um
is
only giving
0.0001
g and is
well
down into
the
electrical noise level unless special
accelerometers
are
used.
The
electronics
to
deal with
the
small
charges
at
low
frequencies
(below
1 Hz)
start
to
become more complex.
In
addition,
at
low
frequencies the
equal
and
opposite quasi-static forces
at
wheel
and
pinion
bearings tend
to
cancel
so
there
is
negligible vibration
to
measure.
None
of
this
affects
audible noise investigations since
we
cannot hear
vibrations
below 32Hz
(off
the
bottom
of the
piano) unless they
are
incredibly
powerful
and
they
are
then
felt
rather than heard.
As
mentioned previously,
users
who
think
they hear
2 or 3 Hz
noise
are in
fact
hearing modulation
of
much
higher
frequencies.
Measurements
81
200
pF
F303-9936
20
mV/pC
or
101
mV/pC
1
ms
int. time
10
nF
0.33
\\-\
100
kQ
accel
vel
Fig 6.3
Circuit
for
portable vibration testing
box
complete
with
integration
to
velocity.
For
audible noise work where
the low frequencies are
irrelevant
the
parallel
resistor
in the
above circuit
can be
reduced
from 100
MQ,
assisting
stability
of the
output against sudden disturbances.
An
alternative change
is to use a 200 pF (1 %)
capacitor
in
parallel
with
the
100
MQ
resistor
to
increase sensitivity allowing outputs
of 100
mV
per
pC.
Fig.
6.3
shows
a
circuit used
for
typical measurements
(on a
machine
tool) where
one
stage
of
complication (one switch)
has
been added
to
give
either
20
mV/pC
or 101
mV/pC.
The
rolloff(3
dB) frequency at the
lower
end
is
then
due to the
combination
of 200 pF and
100
MQ and so is 8 Hz.
In
addition,
in the
circuit
in
Fig. 6.3, another
of the
op-amps
available
on the
LF444 chip
has
been used
to
give integration
of the
signal
to
velocity which
is
often
more convenient especially
as
noise
is
proportional
to
velocity.
The
time
constant
is the
product
of the
100
kQ
and the
10
nF and so
is 1 ms.
This corresponds
to a
break
frequency of
1000
rad
s"
1
which
is 160
Hz
so at
this
frequency a
sine wave will
be the
same amplitude
at
output
as at
input. When
the
switch
is set to the
higher sensitivity
the
acceleration output
is
about
101
mV/pC
x 25
pC/g
or
2500 mV/g acceleration
and so 250 mV per
m
s"
2
and the
velocity sensitivity
is
then
250 mV per mm
s"
1
.
At
the
other
end of the
scale, high
frequencies
give high
accelerations
and can be
measured
easily,
but
high
frequencies are
often
82
Chapter
6
associated with very
low
masses.
The
problem here
is
that
we
need
to
ensure
that
the
mass
of the
measuring
accelerometer,
typically
20
gm,
does
not
affect
the
vibration. This
can be
relevant when measuring say,
car
body vibrations
on
a
thin
steel panel, 0.75
mm
thick, where
20 gm is
equivalent
to an
area
50
mm
by 50 mm of
panel. Smaller, lighter
accelerometers
weighing about
5
gm
can be
used
but are
less sensitive
and may
still
affect
the
measurement.
The
same problem
can
occur with small
gearboxes.
A
gearbox
20 mm
overall
diameter
with
the
casing made
from
0.75
mm
sheet cannot
be
investigated
with
a
conventional
accelerometer
but may
need
to be
exceptionally
quiet
if
used
in
medical equipment.
The
other problem with
an
accelerometer
at
high
frequencies can be
contact
resonance.
This
is
most likely
to
occur with
a
hand held
accelerometer when investigating mode shapes. Pointed probes should
not be
used with
an
accelerometer
because
the
contact
stiffness
is too low and the
associated resonant
frequency is too
low. Where possible
the
accelerometer
should
be
screwed
or
glued
on. If
not,
a
thin smear
of
thick grease
or
traditional
beeswax between
the
(flat) surface
and the
accelerometer base
gives
a
high contact
stiffness
at
high
frequencies as the
squeeze
film
effects
prevent
relative movement.
If
the
money
is
available
and it is
necessary
to
measure extremely
thin panels
the
best possible method
is to use a
laser
Doppler
vibrometer
which
gives velocity directly
but
this method
is
expensive
and
must
be set
carefully
in
position.
At
one
time there were problems with electronic (valve) equipment
because
it was
necessary
to
have input
and
output impedances matched
(at
600
Q)
to get
maximum power transfer.
input
Fig 6.4
Simple current
to
voltage converter circuit
(1 V per
mA).
Measurements
83
This
is no
longer
a
problem since most modern equipment uses
voltage
outputs with very
low (< 2
kfi)
internal source impedance
and
inputs
have
a
very high
(> 1
MQ)
impedance.
The
exception
is
when long cable
runs
are
required under electrically noisy conditions. Then
a
current drive
may
be
used with
a
zero input impedance receiver
at the far end to
turn
current back into voltage.
This type
of
amplifier
is an
operational
amplifier
with
no
input
resistor
and
simply
a
feedback resistor
to
give
an
output voltage proportional
to
input current
as
shown
in
Fig. 6.4. This circuit will give
1 V per mA but
only
if the
op-amp
is
capable
of
delivering
sufficient
current which
is
typically
up to 10 or 20 mA.
Alternatively
it may be
necessary
to use a
resistor
of low
value
(10
Q)
across
the
inputs
and
then multiply
the
voltage
as
in
Fig. 6.5.
Care should
be
taken when logging data into
a
computer
as the
multiplexing circuits
may
require
low
impedance drives
to
give
fast
settling
times,
so it is not
possible
to use
simple series
RC
circuits
on the
outputs
to
roll
off
high
frequency
noise.
The
logging inputs
will
usually need drive
impedances
of
less than
1
kQ
to
reduce
interactions
between channels
so
that
the
input
amplifier
has
time
to
"forget"
the
level
of the
previous channel
before
taking
its
sample.
If
rolloff
of
high
frequency
noise
is
needed
it is
best
done
by
using
a
capacitor
in
parallel with
the
feedback resistor
of the
amplifier.
input
output
Fig
6.5
Alternative current
to
voltage circuit.
84
Chapter
6
One
method
of
testing internal
and
external
resonances
is to run the
gearbox
and use the
I.E.
as the
excitation source, varying
the
speed
to
vary
tooth
frequency. The
main limitation here
is the
inability
of
some gearboxes
to run
slowly under
full
torque, either because
the
hydrodynamic
(plain)
bearings
will
not
take
full
load
at low
speed
or
because
the
gear teeth surfaces
will
scuff
at low
speed
as the oil
film
is too
thin
in
spite
of the
lower
temperatures increasing
the
viscosity. With plain bearings there
is
also
the
problem
that
the
shaft
position alters with speed under
a
given load
so
alignments
of the
helices
may
alter
as
speed
changes
the
bearing
eccentricities.
As
mentioned previously
in
section 1.6, universities,
if
required,
can
provide equipment, advice
and
guidance, undertake
full
investigations
of
problems,
or can
train personnel.
6.3
Calibrations
Calibration
of
instruments
is in
general
a
worry since many
organisations have become enmeshed
in
bureaucracy
and
request that
any
measurement
is
traceable back
to a
fundamental
reference.
This
is a
waste
of
time (and money)
for
most noise investigation
and
reduction work.
The
only time that
it may be
necessary
to
carry
out an
absolute measurement which
is
guaranteed
to be
accurate
is if
there
is a
legal
requirement
for a
gearbox
to be
below
a
specified noise level.
If
such
a
test
is
needed then
a
calibrated noise meter
is
required
but
otherwise
a
simple
uncalibrated
noisemeter
is all
that
is
needed
as
most
of the
tests
are
comparative,
not
absolute.
The
ultimate criterion
is
still whether
or not the
customer
is
happy, regardless
of
what
the
sound level meter says.
In
some
cases,
such
as
sports
cars,
the
customer
is
most unhappy
if the
system does
not
make
a
noise.
Measurements
of
casing
and
bearing vibrations
are
again
not
important
in
their
own
right
and so do not
have
to be
accurate. Most
of the
time
we are
only interested
in
comparisons between amplitudes. This greatly
simplifies
life
as we can
rely
on
manufacturers' values
for
piezo
accelerometer
sensitivities
as the
figures that they quote
for
charge
per
unit
acceleration
(pC/g)
are
reliable.
Checking electronics performance
is
hardly needed
if
simple circuits
such
as
those described above
are
being used
but may be
needed
if the
boxes
being used
are
over complicated
so
that
the
manufacturer's instructions
are
not
at all
clear.
For
piezo (charge)
accelerometers
it is
simplest
to
test
the
electronics directly
by
injecting
a
known charge into
the
input
and
checking
the
output.
The
input
to a
charge
amplifier
acts
as a
short
to
earth
or
zero
resistance
as the
amplifier
always keeps
its
input
at
zero volts.
If we
have
an
Measurements
85
accurate capacitor,
say
100
pF and
vary
the
voltage
at
input
by 1 V
then
as
the
other terminal
of the
capacitor
is
held
to 0 V and as q = C V
there will
be
a
charge
of 100 pC
injected into
the
charge amplifier. This gives
a
known
input
charge
so we
know what
the
amplifier
output (acceleration) voltage
should
be.
This approach cannot
be
used
for
other types
of
accelerometer
so
unless
they
are the
static type, which
can be
calibrated
by
turning them upside
down,
they
are
best calibrated
on a
vibrating table against
an
accelerometer
with
a
known output.
6.4
Measurement
of
internal
resonances
From
a
theoretical model
(as in
section
5.1)
with
some guesses about
damping
we can
predict
the
internal responses
so
that
we
have
a
transfer
function
between relative displacement between
the
gear teeth (T.E.)
and
bearing transmitted
force.
Such estimates
are
liable
to be
highly inaccurate
but
it is
almost impossible
to
carry
out a
conventional vibration response test
in
situ with
an
electromagnetic vibrator.
The
alternative approach
is to use
the
tooth mesh excitation
(T.E.)
as the
vibration source
to
obtain worthwhile
practical
results.
This depends
on the
fact
that
a
given pair
of
gears
at a
particular
torque will have
a
T.E.
of,
say,
5
um
at
once-per-tooth
meshing
frequency,
regardless
of
rotation
frequency.
B
2/tooth
3/tooth
frequency
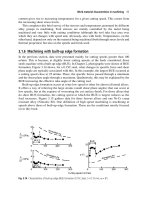
Fig 6.6
Sketch
of
responses
to
T.E. excitation
as
tooth
frequency
varies.
86
Chapter
6
Varying
gear drive speed
(at
constant torque)
will
give
a
constant
relative
displacement between
the
teeth with varying
frequency and if we
measure bearing housing vibration
we
will
then have
the
transfer
characteristic that
we
need between input displacement
(I.E.)
and
output
(bearing) vibration. That
is,
instead
of
sweeping
a
constant exciting
force
through
a frequency
range
to
obtain
a
standard resonance plot,
we
sweep
a
constant
5
\an
displacement
to
obtain
the
plot.
Speed
may be
limited
at the
lower
frequencies by
tribology
problems
as in
section 6.2,
by the
difficulty
of
getting high torques
at low
speeds
on the
loading dynamometers,
or by the
input drive motor cooling problems.
At
high
speed
the
limitation
is
likely
to be to
ensure that
the
equipment
is not
oversped.
There
is
likely
to be a 3:1 or
more range
of
speeds
possible
and we
have
the
fundamental
1/tooth
component
of
excitation staying constant
in
amplitude
but we are
also likely
to
have
the
harmonics
of
tooth
frequency
present
in the
excitation. These harmonics also stay constant
in
amplitude
provided
the
teeth stay
in
contact
so
that
the
system remains reasonably
linear.
Plotting
housing vibration against tooth
frequency
solely
for the
once
per
tooth
frequency
component
will
typically give
us
curve
A in
Fig.
6.6 and
the
same plot
for
twice tooth
frequency may
give curve
B and
thrice tooth
frequency,
curve
C. The
curves
are
similar where they overlap
and the
differences
in
amplitude
are due to the
different
sizes
of the
harmonic
components
in the
T.E. excitation.
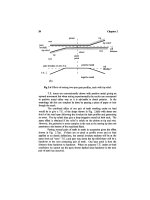
g
f \
composite
curve
frequency
Fig 6.7
Combined curve
for
internal
responses
against harmonic
frequency.
Measurements
87
Adjusting
for the
variation
in
size allows
the
three curves
to be
collapsed into
a
single curve
as in
Fig. 6.7. This
is the
transfer
function
between T.E.
and
bearing housing vibration. Absolute values
are
only known
if
the
sizes
of the T.E
components
are
known,
but it is
usually
the
shape
of the
resonances
and
their position relative
to
forcing
frequencies
that
is of
interest.
When
the
response
is
complicated with overlapping resonances
it is
necessary
to
record relative phase
as
well
as
amplitude because
the
phase
information
is
valuable
for
identifying
the
resonances
and
separating them
by
the
circle methods pioneered
by
Kennedy
and
Pancu
[3,4].
Phase
information
can
also
be
important
if
harmonics
are
being
generated
because
it is the
phase
of the
third harmonic relative
to the
fundamental
which determines whether
a
waveform
is
flat
topped (saturating)
or
peaky. Unfortunately
the
only reference
for
input phase
is
usually
the
once
per
revolution timing signal
in a
rather arbitrary position unless
we
have
taken
the
trouble
to set the
position
of the
timing pulse exactly
to a
known
(pitch
point) position.
Varying
speed used
to
present problems since only
DC
motors were
practicable
but now
that three-phase inverter drives
are
easily available
at
economic
prices,
variable speed
testing
is
relatively easy.
6.5
Measurement
of
external
resonances
Measurement
of the
transmission path
from the
bearing housing
vibrations
to the final
noise
(as
heard)
is
relatively straightforward
as the
components
are
accessible
and
non-rotating.
For
excitation
we
have
the
choice
of
either:
(a)
Using
the
gears
as
excitation,
as
with internal resonances,
and
varying
the
drive speed (using
an
inverter with
an
A.C. motor).
This gives
an
acceleration
"input"
at
I/tooth,
2/tooth,
3/tooth,
etc.,
at
the
bearing housings.
As
four
or
more bearing housings
are
excited simultaneously
it is
difficult
to
sort
out the
paths
and
determine which sources predominate.
The
"output"
can
either
be
the
sound pressure level
or the
vibration level
on a
particular
(noisy) panel.
(b)
Exciting
at
each bearing housing
in
turn
and
measuring
the
responses
from
bearing housing
to the
supporting
feet,
surrounding
structure
or to a
microphone.
See
Chapter
13 for the
various
methods available.
Generally
(b) is
preferable, despite
the
disadvantage that
it
takes
longer
to set up,
because
it is
easier
to
separate
the
vibration paths.
If,
however, internal resonances
are
also being investigated
it may be
simpler
to
run
the
gearbox with
a
poor
set of
gears
under constant torque
and
measure
88
Chapter
6
the
combined internal
and
external resonances
by
measuring
the
bearing
vibrations
and the
noise simultaneously. This gives T.E.
to
bearing vibration
as
well
as
bearing vibration
to
noise. Whether
the
bearing housing response
is
high
or low at a
resonance checks whether
a
given resonance
is
internal
or
external.
6.6
Isolator transmission
A
gearbox
will
often
be
mounted
on
vibration isolators
in an
attempt
to
limit
transmission
of
vibration away
from the
gearbox, e.g.,
in a car the
combined
engine
and
gearbox
is
rubber mounted
to
reduce vibration into
the
body shell.
Unfortunately
isolators
are
often
rather
ineffective
either
because:
(a)
They were designed
to
isolate
1/revolution
(often
24.5
Hz) so
they
perform
badly
at
24/revolution
(tooth
frequency) due to
internal
resonances (spring surge) (see section 10.3);
or
(b) The
isolator
is
relatively
stiff
and the
support
flexes
rather than
the
isolator.
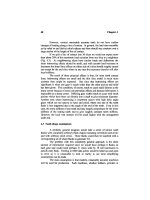
excitation
F
gearcase
foot
combined
stiffness
and
damping
K
isolator
main
body
structure
V
structure
stiffness
Fig
6.8
Model
of an
isolator
in
position under
a
gearcase.
Measurements
89
Conventionally,
it is
customary
to
talk about
the
attenuation achieved
by
an
isolator. This
is
measured simply
by
measuring
the
vibration above
and
below
the
isolator
and
taking
the
ratio
of
amplitudes.
A
little thought shows that this
figure is
almost completely
meaningless
since
if we
mount
the
isolator
on a
massive, rigid support block
there
will
be no
vibration beneath
it and the
"attenuation"
will
be
very high,
regardless
of the
isolator characteristics whereas mounting
on a
very
soft
support
will
always give
no
attenuation through
the
isolator.
The
isolator will have
stiffness
and
damping and, provided
it has not
been designed
for a frequency
much lower than tooth
frequency, the
mass
can
be
ignored. When
the
mass
is
negligible
the
response
at a
single
frequency
can
be
described
as a
ratio
of
amplitude
offeree
to
relative displacement with
a
phase lag.
The
supporting structure, whether
car
chassis, ship's hull,
machine
tool, etc.,
will
also have
a
complex response which
will
involve
damping,
stiffness
and
mass with multiple
resonances.
A
more realistic model
of the
function
of an
isolator
is
shown
in
Fig.
6.8.
There
is no
simple, easy
test
to
measure
the
"effectiveness"
of an
isolator. However,
it is
worthwhile measuring
the
vibration above
and
below
an
isolator because
it can
give
us a
measure
of how
much vibration power
is
being
fed
into
the
structure
via
that isolator.
It
is
relatively easy
to
calibrate
the
dynamic
stiffness
(amplitude
and
phase)
of an
isolator
in a
separate test rig. Care
is
needed
to get the
steady
component
of
load,
the
vibration amplitude
and the frequency
correct since
isolators
are
often
highly non-linear
at
small amplitudes.
Measurement
of
vibration above
and
below, taking
due
regard
of
phase, gives
the
relative displacement
by
vector subtraction and, hence,
the
force
being transmitted
by the
isolator. This force, multiplied
by the
velocity
of
the
supporting point gives
the
vibration power going into
the
support
via
that
route, again taking note
of
phase angles.
As
in
Fig. 6.8,
if the
velocities
of
vibration above
and
below
the
isolator
are
V
l
and
V
2
(complex)
and the
complex isolator
stiffness
was
measured
separately
as K (in
terms
of
force
per
unit velocity,
the
inverse
of
mobility),
then
F
=
K(V
r
V
2
)
and the
power into
the
hull
is F
V
2
.
That
part
of F
which
is in
phase with
V
2
will provide
the
power into
the
main structure (and will average
to
half
the
product
of the
peak values,
i.e.,
0.5 F x
V
2
cos
4»).
It is
often
easier
to see
what
is
happening
by
sketching
out
the
vector (phasor) diagrams.
90
Chapter
6
Isolator design
is
often
difficult
with gearboxes since reaction forces
are
high
in
relation
to the
weight
of the
gearbox.
To
maintain positions
and
alignments
with
high forces requires high stiffnesses whereas vibration
isolation
requires
low
stiffnesses.
Occasionally highly non-linear supports
may
be
used
to
alleviate this clash
of
requirements.
In
the
case
of a car
engine
and
gearbox,
the
supports
to
take
the
torque
reaction
may be
spaced
1 m
apart
and at a
full
engine torque
of 200 N
m
with
4:1
first
gear ratio
and
3.75:1
final
drive ratio,
the
load
on
each would
be
3000
N.
When cruising,
the
load
may be
only
300 N (70
Ibf).
Ideally,
to
isolate
30 Hz firing
frequency
at
idling,
a
natural
frequency of
about
10 Hz
would
be
desirable.
With
an
effective
mass seen
at a
support
of
only about
20
kg
the
stiffness
needed
is 70
kN/m
and the
accelerating torque would then
give
45 mm
deflection,
which would
be
excessive
so a
stiffening
spring
(or
bump
stop)
is
needed
to
limit
travel
at
high torque while
still
isolating
at low
torque.
6.7
Once
per
revolution marker
It
is a
very great advantage
for
detailed noise investigations
to
have
an
accurate
once-per-revolution
marker
on at
least
one
shaft,
and
preferably
all
shafts.
In the
past, magnetic pickups were used
but
they gave
a
rather
indeterminate waveform which varied
in
amplitude with speed
and did not
have
a
clear edge
for
accurate location regardless
of
speed.
Standard
"slotted,
through scan
opto-switch
sensors"
consist
of an
infra-red source
and a
photodetector
with Schmidt trigger,
and are
extremely cheap
so the
only
requirement
on the
rotor
is a
single hole, typically
1.5
mm
diameter
in a
disc
mounted
on the
shaft.
It
is not
advisable
to use a
60-hole
disc
to
generate
an
r.p.m.
count
and to
divide
by 60 to get a
once-per-revolution marker since
position round
the
revolution
is
easily lost
by
stray pulses
and
averaging
is
then
not
reliable.
Two
separate detectors should
be
used
if
60/rev
and
I/rev
are
both required.
An
advantage
of
this type
of
marker
is
that
its
position
can
be set
accurately,
semi-statically
especially
if an
indicator
LED is fitted to
show when
the
signal switches. Alternatively
a
Hall
effect
magnetic probe
is
robust
and is
mounted about
1 mm
away
from a
screw head
or
other
magnetically susceptible once
per rev
marker.
It
will
give
a
fast
acting
and
repeatable marker signal whose angular position does
not
vary with speed.
Having
a
I/rev
marker
is an
asset
because:
(a)
There
is an
exact location
of any
problem round
the
revolution
especially
if
damage
is
suspected. Small
scurfs
and
burrs
can
easily
be
located.
(b)
Time averaging
is
reliable. This
is
essential
if
small
defects
are
being
sought
in a
"noisy"
environment. (Here
the
term
"noisy"
does
not
Measurements
91
pertain
to
audible noise
but is the
confusing
term used
for any
background
irregular vibration, whether electrical
or
mechanical.)
(c)
When recorded, there
is an
exact speed reference
and
when viewed
on
an
oscilloscope
the
signal
can be
synchronised
to
I/rev
to
give easy
and
rapid
identification
of the
position
of
impulses
or
changes round
the
revolution.
An
exact speed reference also allows exact
identification
of
whether vibration
is
linked
to a
particular
shaft.
(d) An
accurate
I/rev
marker allows
a
quick check
on
whether
a
vibration
is
linked
to
I/rev
or to a
harmonic
of the
electrical supply
suggesting
an
electrical
noise
problem.
The
disadvantage
of a
I/rev
marker
is
that
an
additional channel
of
information
must
be
recorded.
A
slight economy
of
channels
can be
achieved
by
putting
two
once-per-rev.
markers
on one
channel, using
+ve
pulses
for
one
(pinion) channel
and -ve
pulses
for the
other (wheel) channel. Addition
is
by an
analog operational amplifier.
If
combined with using pulses
of
different
heights, this allows
four
markers
to be
identified
on one
channel
but
the
pulses should
be
very short
so
that positive
and
negative pulses
do not
mask each other.
At the
same time
the
pulses must
not be so
short that data
sampling
misses some pulses
as
this complicates time averaging routines.
While
adding/subtracting
timing pulses
it is
also advisable
to use an
operational amplifier
to
reduce
the
amplitudes
of the
pulses
(to
about
1 V)
and
to
slow down their rate
of
change
of
voltage. Standard logic
TTL
pulses
from the
sensors rise
and
fall
5 V in
less than
0.5 us and
this sudden change
gives pickup
or
interference between neighbouring conductors
in
ribbon
cables
or the
printed circuit boards
of
data logging cards. Slowing down
the
change
from
rates
of the
order
of
10
7
V/s to
less than
10
4
V/s
greatly reduces
cross
interference. This
is
achieved
by
having
a
capacitor
in
parallel with
the
feedback
resistor
on the
adder, with
a
time constant
of the
order
of a
tenth
of
a
millisecond
or
greater.
References
1.
Digital sound level meter. Model
8928
obtainable
from
A.T.P.,
Tournament Way,
Ashby-de-la
Zouche,
Leics. LE65
2UU,
UK.
2.
Birchall Ltd., Finchley Ave., Mildenhall, IP28 7BG. U.K.
A20
accelerometers.
www.djbirchall.com.
3.
Kennedy,
C. and
Pancu, C.D.P., Journal
of
Aeronautical Sciences,
14,
1947.
p
603.
4.
Ewins,
D.J., Modal testing theory
and
practice,
Bruel
&
Kjaer,
Harrow,
1986,
Research Studies Press,
Letch
worth,
UK.
Error
Measurement
7.1
Original approach
Chapter
6 was
concerned with
the
vibration
and
noise measurements
normally
made
on a
gearbox under operating conditions. However when
problems arise
we
must return
to the
source
of the
vibration
and
measure T.E.
since this
is the
only relevant measurement
of the
basic excitation that drives
all
the
vibration. There
are
many possible approaches
to
measuring T.E. but,
in
practice,
the use of
digital encoders dominates
the field.
A
workable system
was
first
developed
for
laboratory
use by the
National
Engineering Laboratory
at
East
Kilbride.
It was
then redesigned
and
developed
for
industrial
use in the
1960s
by Dr. R. G.
Munro
who
successfully
introduced
the
system
to the
Goulder
(subsequently Gleason)
range
of
gear measuring equipment. Though
the
objective
is to
measure
transmission error,
the
check
is
often
referred
to as a
single
flank
check
[1].
Large
(10")
diameter rotary encoders with
an
accuracy
of
about
1
second
of arc
were mounted
on
precision spindles which also carried
the
meshing gears. When rotated slowly
(<10
rpm),
under
low
torque
sufficient
to
keep
the
teeth
in
mesh,
the 2
encoders each produced
2
strings
of
pulses
(at
72
second intervals) which were processed electronically.
The
system
is
shown
schematically
in
Fig.
7.1
with
the
corresponding block diagram
in
Fig.
7.2.
The
input (pinion)
is
driven
at
exactly constant speed (servo controlled)
and
should produce
a
perfectly regular string
of
(TTL)
pulses and,
with
a
"perfect" gear drive,
the
output (wheel) encoder should produce
a
regular
string
of
pulses
(at a
different
frequency).
The
function
of the
electronics
is to
take
the
steady input pulse string
and
to
generate
the
output pulse string expected
if the
gear drive were
"perfect."
The
4t
perfect"
string
is
then compared with
the
real,
measured
string
and any
variation
in
phase angle between
the two
strings corresponds
to an
angular error
in the
drive.
The
requirement
for a
servo-controlled
steady input speed
is due to the
requirement
for
multiplying
the
input
frequency
by
a
ratio corresponding
to the
number
of
teeth
(W)
on the
output
wheel.
The
phase-lock loop which achieves this cannot deal accurately with
the
rapid variations
in frequency
which would occur with torsional vibration
at
the
input.
93
94
Chapter
7
input
encoder
precision
S7
bearings
pinion
wheel
output
encoder
X
X
Fig 7.1
Sketch
of
setup
of
Goulder type single
flank
tester.
frequency
multiplier
frequency
divider
Fig 7.2
Block diagram
of
original (single
flank)
T.E
tester.
T. E.
Measurement
95
Subsequent
designs used smaller, more robust encoders, usually
made
by
Heidenhain
[2]
which
had
become readily available
and
were used
extensively
for
(static)
rotary positioning systems
on
machine tools
so
that
with
large numbers being produced they were priced economically.
Using interpolation between encoder lines with
the
phase
measurement allowed
finer
discrimination than
the
basic line spacing.
A
typical
encoder line number
of
18,000 lines
per rev
with
a
line spacing
of 72
seconds
of
arc, with interpolation, could easily resolve
to
better than
1
second
of
arc,
sufficient
for
most machine tool
and
gear purposes.
At 200 mm
radius, (400
mm or 16"
diameter)
1
second
of arc
corresponds
to 1
fim
accuracy.
The
main problems with this approach
lay
with
the
need
for a
very
constant speed drive
to
allow
the frequency
multipliers
to
work correctly
and
with
the
severe speed limitations.
The
original pulse strings
from the
pinion
would
be at a
reasonable
frequency of
9,000
Hz if the
pinion
was
rotating
as
fast
as 30
rpm
but if
there were
106
teeth
on the
wheel
the
multiplied
frequency
would
be 954
kHz, which
was
faster
than
the
available electronics
could handle comfortably.
7.2
Batching approach
The
next approach uses
the
same encoders
but
uses interpolation
electronics
to
generate many more pulses
per
rev. Typically there
is
50-fold
interpolation
so
that
an
encoder with 18,000 lines
per rev
gives pulses
at
0.36
seconds
of arc
(0.0001°) spacing. This gives
a fine
resolution since
on 100
mm
dia. this corresponds
to
less than
0.1
pm.
There
is
however possibly
a
loss
in
accuracy compared with
the
original
signals direct
from the
encoders.
Computer
•
Pinion
P
teeth
encoder
Wheel
W
teeth
x
50
x50
/
w
/
P
Compare
to
check equality.
Sum
differences
from equal
Fig 7.3
Block diagram
for
batching approach.
96
Chapter
7
The
system
is
computer-based
and
counts
the
interpolated pulses
from the
pinion
and the
wheel encoders
and
compares
the
expected number
of
pulses
from the
wheel with
the
observed number. This approach avoids
the
need
for
multiplying phase-lock loops
so
there
is no
longer such
a
critical
requirement
for
constant input speed.
The
necessary interpolating interface
cards
can be
obtained directly
from
Heidenhain Ltd.
[2].
In
a
typical case
of a
21
to
106
reduction drive
the
computer could
count
21
pulses
from the
wheel pulse string
and
determine
how
many pulses
there
were
in
that time
from the
pinion
encoder.
The
correct
number
of
pulses, 106, would mean that during that time interval, (corresponding
to
about half
a
minute
of arc
rotation
of the
pinion) there
was no
change
in the
value
of the
transmission error.
Any
variation
from the
expected number
would
raise
or
lower
the
T.E.
by
increments
of
0.36
sec
arc. Fig.
7.3
shows
a
block diagram
of the
principle.
The
diagram
is
similar
to the
original system
but
after
the
initial multiplication
by 50
(instead
of
multiplying
and
dividing
on
one
string) both strings
are
divided.
This interpolation system works well
but
again
suffers
from a
fundamental
speed limitation.
If
interpolation
is to
0.36 second
of arc
then
there
are 360 x 60 x 60 /
0.36 pulses
per rev or
3,600,000
pulses
per
rev.
Typically,
electronic systems
use 0.5
microsecond
TTL
pulses
so, for
reliability,
the frequencies
should
not
exceed
1 MHz and
rotation speeds
are
then limited
to
about 0.25 rev/s
or 15
rpm.
This
is
perfectly satisfactory
for
inspection purposes
but not for
test
and
development. These
frequencies are
sufficiently
high
to
prevent simple programming
of a PC for
on-line
use as
the
computer
is not
happy
if
asked simultaneously
to
accept data, calculate
the
result
and
output data.
The
alternative
is
either
to
record
the
pulse strings
or
to use one
pulse string
to
gate
the
other then process
the
information
off
line.
Both give lower
speeds.
Working
off-line
is
perfectly satisfactory
for
research
or
development
purposes
but may be
restrictive
for
high production
or for
test
bed
development where time available
is
limited
so
immediate answers
are
required.
7.3
Velocity approach
A
further
group
of
T.E. systems work
on a
very
different
approach
as
instead
of
using
the
encoders
for
direct measurement
of
angular errors
the
velocity approach
effectively
measures
the
angular velocities
of
each
shaft,
deduces
the
angular velocity vibrations then integrates
to
find
the
angular
vibrations
and
hence
the
T.E. This approach
is
popular with reseachers
as
though
it is
slow
it is
much less costly than
the
commercial equipment.
A
relatively
coarse
line
spacing
is
used
on the
encoders
and a
high
frequency
timer (100 MHz)
in the
computer measures
the
time between encoder pulses.
T.
£.
Measurement
97
Computer
juinnr-
period
JITLTLT-
multiply
pinion period
by
gear
ratio
and
compare
with wheel
period
to
give velocity change
&
integrate
to
displacement
error
Fig 7.4
Simple block diagram
of one
velocity approach.
The
system then
effectively
calculates instantaneous speeds
for
each
gear separately, subtracts
the
correct (average) speed
of
that gear then
integrates speed errors
to get
angular errors
so
that angular vibration
for
each
gear
is
determined. Input angular vibration
is
then scaled
by the
gear ratio
to
get the
expected output angular vibration
and
this
is
subtracted
from the
observed output angular vibration
to get the
T.E.
An
alternative view
of
these
methods
is
that (instead
of as in
section
7.2
one
encoder pulse
string
being used
to
gate
the
other) each encoder
pulse
string
is
used
to
gate
a
high
frequency
timing signal. There
are
several
variations possible
on
this theme
and
alternatively each encoder pulse train
may
be
demodulated
in the
computer
to
extract
the
torsional vibration.
Sweeney
and
Randall
[3] and
Remond
[4]
describe
different
processing
methods though some
of
their comments about
the
disadvantages
of
alternative
methods
are not
correct.
Tuma
[5] has a
similar system which
again
takes
the
original pulse strings
and
demodulates them
to
determine
vibration
on
each gear separately. Fig.
7.4
shows
the
simplest block diagram
for
a
velocity system.
The
principle
is
shown
diagrammatically
in
Fig.
7.5
which plots
angular displacement against time.
For
each encoder
the
pulses come
at
roughly
equal time intervals
and
measuring
the
interval exactly gives
the
velocity
which
is the
slope
of the
curve.
The
calculated velocities
of the
input
can
be
adjusted
by the
velocity ratio
to
give
the
expected velocities
and
displacements
at
output
and
plotted
on the
same graph
as the
measured output
displacements. Some interpolation
is
required
to
give
the
difference
between
expected
and
observed output displacements which
is the
required T.E.
As
this approach
is
measuring speed variations
it
also gives
the
local
torsional vibrations
of the
individual gears which
may be of use for
research
if
speed variations
are
being matched
to a
computer model.
98
Chapter
7
input
displacements
scaled
by
velocity
ratio
P
time
I
.s
I
output
displacements
Fig
7.5. Sketch
of
velocity approach principle. Points
p
correspond
to
positions
of
input encoder pulses
and the
slope between
two
samples
is
given
by
the
time interval.
The
slope
is
adjusted
by the
velocity ratio. Points
s are
where
the
output encoder pulses rise
and
again
the
slopes
are
given
by the
timer.
The
velocity method
has few
speed
restraints since
if we
have 5000
pulses
per rev and a
typical computer speed
limitation
of 100 kHz
input
the
speed
can
rise
to
1200
rpm.
This
is
less
of an
advantage than
it
might appear
as
vibration
information
above
600 Hz is
very
likely
to be
distorted
by
system
resonances
and
this limits
us to 300 rpm for 5 th
harmonic
of 24
teeth.
In
theory
a low
line spacing
can be
used because
if we
take
the
rough
rule
of
thumb that,
for
easy visualisation,
we
want about
six
data points
to
locate
a
sine cycle then
for 100
teeth
and
information
up to the 5th
harmonic
we
need 3000 data points
per
revolution
(of the
slower gear, i.e.,
the
wheel).
This means that
an
encoder with
as few
pulses
as
3600
/ rev
could
be
used.
However
in
practice accurate
encoders
are
rarely available with
low
numbers
T.
£.
Measurement
99
of
lines
and
computer correction
of
encoder errors
is an
unwanted
complication
with increased
effort
and
possibility
of
errors.
The
approach
can use
simply
the
standard interface board
from
Heidenhain
[2] to
carry
out all the
processing
in the
computer
but
this usually
involves
working
off
line
and so
does
not
give
an
immediate answer.
The
alternative approach
to
work
in
real time
at
speed requires specialist
electronics
for the
initial counting
and
buffering,
and a
computer
to
take
the
acquisition board
and
processing routines
but can be
reasonably portable.
7.4
High
speed
approach
The
systems described above
in
sections
7.1
and 7.2
will work well
and are
suitable
for
production checking provided there
is no
requirement
for
accuracy
at
speed since
the
systems cannot provide accuracy
at
speed,
especially
if the
input speed
is fluctuating. The
systems described
in
section
7.3
have
not
been widely used.
For
troubleshooting, development
and
consultancy work there
was a
requirement about
20
years
ago for
equipment which
was
very compact,
physically
robust
and
highly portable
to
take
to
test
"in
situ"
with
the
ability
to
run at
speed,
so
that bearings could operate correctly
and
teeth would
not
scuff
under
foil
torque.
As
with much urgent development work, data
logging
and the
associated computing were
not
necessary when speed
of
obtaining
results
was the
priority.
The
equipment developed
(at
Cambridge)
would
fit
easily into cabin
hand
luggage
for
flying
and
uses
two
medium-sized
(100
mm, 4",
diameter)
encoders
which
could operate
up to
6000
rpm.
Accuracy
of the
encoders,
made
by
Heidenhain [2],
is
usually about
2
seconds
of arc
peak
to
peak, more
than
sufficient
to
meet
the
requirement
for
noise investigations because
the
encoder accuracy
at frequencies
greater than
20
times
per
revolution
is
better
than
0.1
seconds
of arc
[6].
The
electronic system used
in
practice
is an
extremely simple
and
robust
"double-divide" system with
the
block diagram shown
in
Fig. 7.6.
Complicated
variations with extra multipliers (which
are
temperamental)
could
be
used
[7] but it has not
been
found
necessary
for any
normal drives.
As
usual,
the
encoders
are
mounted
on
support
flanges
attached
to the
gear
casing
and are
driven
from the free
ends
of the
gear
shafts
via flexible
connectors
which
allow
for
slight misalignment
but are
extremely
stiff
torsionally
to
keep
the
torsional natural
frequency
high. Alternatively
the
encoders
can be the
shaft
mounted variety
if
there
is a
sufficiently
robust
shaft
extension
to
support them.