Handbook of Lubrication Episode 1 Part 9 potx
Bạn đang xem bản rút gọn của tài liệu. Xem và tải ngay bản đầy đủ của tài liệu tại đây (2.71 MB, 20 trang )
MINERAL- AND CERAMIC-FILLED RESINS
Mineral-filled resins have been used in a variety of applications to control the viscosity
of the uncured mixture and the hardness, differential thermal expansion, and isothermal
shrinkage of the cured material. These applications include dental restorative materials and
dielectric materials in a multisegmented switch. The dental restorative materials must resist
the abrasive action of food and dirt particles trapped between the teeth during mastication,
resist the grinding of teeth, and resist the mild abrasives in dentifrices. The dielectric material
must be capable of being polished by abrasive action so that the smooth surface will not
cause excessive wear of the graphite composite brushes sliding over the surface.
A study of the polishing of mica-filled epoxy
34
identified two mechanisms of wear. When
the abrasive particles were larger than the mica particles, wear occurred by crushing and
fracturing the mica particles by the rolling and sliding motion. Subsequent abrasive particles
removed the fractured mica and the resin surrounding them. When the abrasive particles
were smaller than the mica particles, wear occurred by erosion of the resin surrounding the
mica. As the support for the mica gradually wore away, the mica particles were removed
by the polishing motions.
The erosive wear mechanism has also been proposed for the wear of dental restorative
materials.
35
These materials were quartz or glass filled BIS/GMA resins. Wear data suggest
the filler volume fraction and the particle size are the most significant parameters affecting
wear resistance. Interaction of these two parameters as they affect packing density is also
important- Scanning electron micrographs of the worn surfaces confirmed the erosion mech-
anism in a simulated tooth-brushing wear test. The study showed that an impact sliding wear
test gave better correlation with in vivo wear of the composites in rabbits than the simulated
tooth brushing.
Wear rates of poly (methacrylate) and BIS/GMA, unfilled and filled with coupled quartz,
when sliding on 180-grit SiC abrasive cloth were all similar in magnitude.
36
These results
suggest that the resin fracture properties govern the wear rates. The negligible correlation
194 CRC Handbook of Lubrication
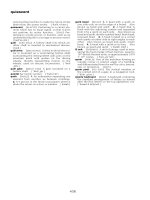
FIGURE 5. Proportionality between volumetric wear and coefficient of
friction, f. (From Moore, D. F., in The Wear of Non-Metallic Materials,
Dowson, D., Godet, M., and Taylor, C. M., Eds., Mechanical Engineering
Publ., London, 1976, 141. With permission.)
Copyright © 1983 CRC Press LLC
of the wear results with hardness of the composites tends to confirm resin wear and erosion
around the filler as the wear mechanism.
Clinical observations also support the erosion mechanism.
37
In a study of the wear char-
acteristics of five experimental resins
38
sliding on SiC, aluminum, and quartz papers, the
highest wear was caused by the SiC and the lowest by quartz. Tests in which a diamond
stylus was slid on the resins showed three failure modes. Ductile failure (as evidenced by
a smooth wear track) was found at low loads; brittle failure (surface cracks, chevron-shaped)
occurred at intermediate loads. Catastrophic failure (gross disruption of the surface) was
observed at the highest loads.
In summary, wear of mineral-filled epoxies occurs by erosion of the resin around the
filler for abrasive particle sizes smaller than the filler. For large abrasive particles, stresses
are high enough to fracture the resin and filler particles, removing both at a rapid rate.
POLYMER SELECTION USING PUBLISHED WEAR DATA
Selection of polymers for wear resistance is usually based on wear data and on measured
load and sliding speed at which the wear rate becomes catastrophic. The latter data are
usually referred to as the PVlimit for the polymer, where Pis the interface pressure and V
is the sliding velocity.
39
The PVlimit is a measure of the energy input to the sliding interface
which is sufficient to cause the polymer to soften or melt. This softening results in high
wear rates which are unacceptable in most applications.
Published wear rate data cannot, however, be used to predict absolute wear rates for
applications in which the conditions are different from those used to obtain the data. In some
circumstances, published data cannot even be used to predict relative wear rates of the
polymers in a different application. One of the major reasons for the poor predictions of
wear based on published data is the strong influence that surface roughness has on wear
rate.
40
Figure 6 shows that an order of magnitude increase in the R
a
of a surface can result
in wear rate increases that range from a factor of 3 to 1000. In addition, relative wear rates
can completely reverse as the roughness changes. For example, at a roughness of 0.1 µm,
the wear rate of polyacetal is about one ninth that of polyethylene. At roughness of 1.0 µm,
the wear rate of polyacetal is about six times that of polyethylene.
Asecond reason why published data may not predict wear performance of polymers is
the different wear rates that result from single traversal and multiple traversal tests. In the
latter, the ability of the polymer to form transfer films on the counterface surface can reduce
the wear rates experienced on single traversals over the same surface.
40
Table 2 shows that
the ratio of steady-state wear to single traversal wear can vary widely. The polymers with
the lower ratios tend to be more ductile than those with the higher ratios.
Athird reason why wear performance may not be predicted from published data is that
different test geometries produce different rankings of polymers. In Figure 6 and Table 2,
Nylon 6/6 has a lower wear rate than polyacetal for both single-traversal and steady-state
wear for a cylinder-on-ring geometry. However, Nylon 6/6 is reported to have a higher wear
rate than that for polyacetal in steady state sliding in a thrust-washer configuration, 0.2 m/
sec sliding speed, 0.20 µm R
a
roughness, and an interfacial pressure of 2.8 × 10
5
Pa.
41
The general conclusion can be drawn that wear rate data in the literature can be useful
in predicting performance of polymers only if the conditions of the test and the application
are very similar.
Published PV limits of polymers must also be used with caution in predicting performance
in a given application. Often a single number is published for the PV limit. The implication
is that any combination of P and V less than the limit will be satisfactory. At low velocities,
however, the pressure is limited by the flow characteristics of the polymer. At low pressures,
the velocity is limited by frictional heating which causes softening of the surface layers and
Volume II 195
Copyright © 1983 CRC Press LLC
conditions of the application are matched as closely as possible must be performed to measure
polymer wear. For applications where minimal wear is desired the engineering model for
wear can be used. Experience with this model has shown that the contact may take larger
loads than calculated and still satisfy the zero wear criterion.
REFERENCES
1. Tabor, D., The wear of non-metallic materials: a brief review, in The Wear of Non-Metallic Materials,
Dowson, D., Godet, M., and Taylor, C. M., Eds., Mechanical Engineering Publ., London, 1976, 3.
2. Tabor, D., Wear, a critical synoplic view, in Wear of Materials — 1977, Glaeser, W. A., Ludema, K.
C. and Rhee, S. K., Eds., American Society of Mechanical Engineers, New York, 1977.
3. Briscoe, B. J. and Tabor, D., The sliding wear of polymers: a brief review, in Fundamentals of Tribology,
Suh, N. P. and Saka, N., Bds., MIT Press, Cambridge, Mass., 1980, 733.
4. Ludema, K. C., Glaeser, W. A., and Rhee, S. K., Eds., Wear of Materials — 1979, American Society
of Mechanical Engineers, New York, 1979.
5. Lee, L. H., Ed., Advances in Polymer Friction and Wear, Plenum Press, New York, 1974.
6. Buckley, D. H., Introductory remarks —friction and wear of polymeric composites, in Advances in Polymer
Friction and Wear, Lee, L. H. Ed., Plenum Press, New York, 1974, 601.
7. Dowson, D., Challen, J. M., Holmes, K., and Atkinson, J. R., The influence of counterface roughness
on the wear rate of polyethylene, in The Wear of Non-Metallic Materials, Dowson, D., Godet, M., and
Taylor, C. M., Eds., Mechanical Engineering Publ., London, 1976, 99.
8. Eiss, N. S., Jr. and Warren, J. H., The Effect of Surface Finish on the Friction and Wear of PCTFE
Plastic on Mild Steel, Paper No. IQ75-125, Society of Manufacturing Engineers, Detroit, Mich., 1975.
198 CRC Handbook of Lubrication
FIGURE 7. Experimentally determined values of τ
max
, at zero wear vs. measured
values of τ′
y
for different plastics. Dry sliding of 302 stainless steel sphere on
platens of plastics for 2000 passes. (From Clinton, W. C., Ku, T. C., and Schu-
macker. R. A., Wear, 7, 354, 1964. With permission.)
Copyright © 1983 CRC Press LLC
9. Eiss, N. S., Jr. and Bayraktaroglu, M. M., The effect of surface roughness on the wear of low density
polyethylene, ASLE Trans., 23, 269, 1980.
10. Lancaster, J. K., Geometrical effect on the wear of polymers and carbons, J. Lubr. Technol., Trans.
ASME. 97, 187, 1975.
11. Ratner, S. B., Farberova, I. I., Radyerkevich, O. V., and Lur’e, E. G., Connection between wear-
resistance of plastics and other mechanical properties, in Abrasion of Rubber, James, D. S., Ed., MacLaren,
London, 1967, 145.
12. Lancaster, J., Abrasive wear of polymers. Wear, 14, 233, 1969.
13. Warren, J. H. and Eiss, N. S., Jr., Depth of penetration as a predictor of the wear of polymers on hard,
rough surfaces, J. Lubr. Technol., Trans. ASME, 100, 92, 1978.
14. Giltrow, J. P., A relation between abrasive wear and the cohesive energy of materials, Wear, 15, 71,
1970.
15. Lontz, J. F, and Kumnick, M. C., Wear studies on moldings of polytetrafluorocthylene resin, consid-
erations of crystailinity and graphite content, ASLF. Trans., 16, 276, 1973.
16. Rabinowicz, E., Friction and Wear of Materials, John Wiley & Sons, New York, 1965, 168.
17. Hollander, A.E. and Lancaster, J. K., An application of topographical analysis to the wear of polymers,
Wear, 25, 155, 1973.
18. Eiss, N. S., Jr., Wood, K. C., Smyth, K. A., and Herold, J. H., Model for the transfer of polymers
on hard, rough surfaces, J. Lubr. Technol., Trans. ASME, 101, 212, 1979.
19. Eiss, N. S., Jr., Warren, J. H., and Quinn, T. F. J., On the influence of the degree of crystailinity of
PCTFE on its transfer to steel surfaces of different roughnesses, in Wear of Non-Metallic Materials, Dowson,
D., Godet, M., and Taylor, C., Eds., Mechanical Engineering Publ. Ltd., London, 1976, 18.
20. Deanin, R. D. and Patel, L. B., Structure, properties, and wear resistance of polyethylene, in Advances
in Polymer Friction and Wear, Lee, L. H., Ed., Plenum Press, New York, 1974, 569.
21. Pooley, C. M. and Tabor, D., Friction and molecular structure: the behavior of some thermoplastics,
Proc. R. Soc. London, Ser. A, 329, 251, 1972.
22. Tanaka, K. and Uchiyama, Y., Friction, wear, and surface melting of crystalline polymers, in Advances
in Polymer Friction and Wear, Lee, L. H., Ed., Plenum Press, New York, 1974, 499.
23. Kar, M. K. and Bahadur, S., Micromechanism of wear at polymer-metal sliding interface, in Wear of
Materials—1977, Glaeser, W. A., Ludema, K. C., and Rhee, S. K., Eds., American Society of Mechanical
Engineers, New York, 1977, 501.
24. Tanaka, K., Uchiyama, Y., and Toyooka, S., The mechanism of wear of polytetrafluoroethylene. Wear,
23, 153, 1973.
25. Suh, N. P., The delaminafion theory of wear. Wear, 25, 111, 1973.
26.
Rabinowicz, E., Friction and Wear of Materials. John Wiley & Sons, New York, 1965, 151.
27. Moore, D. F., Some observations on the interrelationship of friction and wear in elastomers, in The Wear
of Non-Metallic Materials. Dowson, D., Godet, M., and Taylor, C. M., Eds., Mechanical Engineering
Publ., London, 1976, 141.
28. Schallamack, A., Abrasion of rubber by a needle, J. Polym. Sci., 9, 385, 1952.
29. Southern, E. and Thomas, A. G., Some recent studies in rubber abrasions, in The Wear of Non-Metallic
Materials, Dowson, D., Godet, M., and Taylor, C. M., Eds., Mechanical Engineering Publ., London,
1976, 157.
30. Ratner, S. B., and Farberova, I. I., Mechanical testing of plastics — wear, in Abrasion of Rubber, James,
D. S., Ed., MacLaren, London, 1967, 297.
31. Kraghelsky, I. V. and Nepomnyashaki, E. F., Fatigue wear under elastic contact conditions, Wear, 8,
303, 1965.
32. Aharoni, S. M., The wear of polymers by roll formation. Wear, 25, 309, 1973.
33. Hurricks, P. L., The wear and friction of elastomers sliding against paper, in The Wear of Non-Metallic
Materials, Dowson, D., Godet, M., and Taylor, C. M., Eds., Mechanical Engineering Publ., London,
1976, 145.
34. Eiss, N. S., Jr., Lewis, N. E., and Reed, C. W., Polishing of mica-filled epoxy, in Wear of Materials
— 1979, Ludema, K. C., Glaeser, W. A., and Rhee, S. K., Eds., American Society of Mechanical
Engineers, New York, 1979, 589.
35. Lee, H. L., Orlowshi, J. A., Kidd, P. D., and Glace, R. W., Evaluation of wear resistance of dental
restorative materials, in Advances in Polymer Friction and Wear, Lee, L. H., Ed., Plenum Press, New
York, 1974, 705.
36. Wright, K. H. R. and Burton, A. W., Wear of dental tissues and restorative materials, in The Wear of
Non-Metallic Materials, Dowson, D., Godet, M., and Taylor, C. M., Eds., Mechanical Engineering Publ.,
London, 1976, 116.
37. Kusy, R. P. and Leinfelder, K. F., Pattern of wear in posterior composite restorations, J. Dental Res.
56, 544, 1977.
Volume II 199
Copyright © 1983 CRC Press LLC
38. Powers, J. M., Douglas, W. H., and Craig, R. C., Wear of dimelhacrytale resins used in denial
composites, in Wear of Materials — 1979, Ludema, K. C., Giaeser, W. A., and Rhee, S. K., Eds.,
American Society of Mechanical Engineers, New York, 1979, 605.
39. Lewis. R. B., Predicting the wear of sliding plastic surfaces, Mech. Eng., 86, 32, 1964.
40. Lancaster, J. K., Relationships between the wear of polymers and their mechanical properties, Proc. Inst.
Mech. Eng., 183(3P), 98, 1969.
41. Theberge, J. E., A guide to the design of plastic gears and bearings, Mach. Design, 42, 114, 1970.
42. Lancaster, J. K., Estimation of the limiting PV relationships for thermoplastic hearing materials, Tribology,
4, 81, 1971.
43. Lancaster, J. K., Dry bearings: a survey of materials and factors affecting their performance, Tribology,
6, 219, 1973.
44. Bayer, R. G., Clinton, W. C., Nelson, C. W., and Schumacker, R. A., Engineering model for wear,
Wear, 5, 378, 1962.
45. Clinton, W. C., Ku, T. C., and Schumacker, R. A., Extension of the engineering model for wear of
plastics, sintered metals, and platings, Wear, 7, 354, 1964.
200 CRC Handbook of Lubrication
Copyright © 1983 CRC Press LLC
WEAR COEFFICIENTS
Ernest Rabinowicz
INTRODUCTION
Other chapters have revealed that wear is extremely complicated. For example the tem-
perature can rise, thus increasing the thickness or changing the nature of the oxide layer.
Alternatively, plastic deformation or fatigue can damage the material, increasing its tendency
to wear. Thus, prediction of the wear rate to any high degree of accuracy (say ± 10%) has
so far defied all attempts, even in cases where the sliding system is well understood and
well controlled.
However, the task is much easier when we are content with an estimate of the wear rate
within a factor of four or five. In this case the exact contributions of some of the complicating
factors are less significant and leave the order of magnitude of the wear rate unaffected.
Wear predictions, even though imperfect, can be used in a number of ways besides
estimating the wear rate. First, an equation for wear indicates the relative influence of various
parameters, such as load, hardness, velocity, surface roughness and grain size, and suggests
the change in wear that might result if the sliding system is changed. Second, computation
of the wear is also important in failure analysis, or in the study of any worn component of
a system.
Quantitative analysis of wear starts with the concept that, while a sliding system may be
losing material in more than one way, one mechanism will dominate the overall wear rate.
This dominant mechanism is generally identified as one of the following:
1. Adhesive wear — considered as ‘mild’ or ‘severe’ depending on the rate of wear and
the size of the wear debris. In this case wear results from adhesion and pulling out of
regions of one sliding surface by the other (see the chapter on Metallic Wear for further
details of wear mechanisms).
2. Abrasive wear — results from a hard sharp object, which may be a loose abrasive
particle or a sharp projection on one of the sliding surfaces, scratching out a groove
in a sliding surface.
3. Corrosive wear — caused by mechanical removal of a surface layer formed by a
corrosion process.
4. Surface fatigue wear — removal of particles loosened by a growth of surface or
subsurface fatigue cracks arising from stress variations dueing continued sliding.
ADHESIVE WEAR
This principal form of wear is invariably present when two surfaces slide together, and
adhesive wear is predominant in many cases where wear occurs by more than one mechanism.
Adhesive wear has been investigated most intensely, probably because the same interatomic
forces at the interface which cause adhesive wear also cause friction.
Although a number of studies have investigated the mechanism accounting for the for-
mation of adhesive wear particles
1,2,3,4
only one simple quantitative relationship has been
developed for predicting the wear rate. This is the equation derived by Holm
5
and refined
by Archard.
1
(1)
Volume II 201
Copyright © 1983 CRC Press LLC
Here p represents indentation hardness, i.e., the ratio of load applied to area of indentation
produced by plastic yielding, of the softer material being worn. Parameter k is a non-
dimensional constant, the wear coefficient. In Archard’s original derivation with a factor of
three in the denominator of Equation 1, the wear coefficient physically represented the
probability that a sizeable wear particle was produced during the contact of the two surfaces
at an asperity. Data presented in this section are based on Equation 1 (i.e., the wear equation
without the factor of three) for simplicity. Note that such parameters as surface roughness,
grain size, sliding velocity, and apparent pressure do not appear in Equation 1. The wear
is independent of them, except insofar as they influence other parameters (e.g., the distance
slid is proportional to velocity).
The indentation hardness is best measured by a Vickers, Knoop, or Brinell hardness test.
The number given in one of these tests is the hardness in units of kg/mm
2
, and must be
multiplied by 9.8 to convert to N/mm
2
. The various Rockwell scales are arbitrary. Conversion
to N/mm
2
may be made using Figure 1. The hardness of a material is about 3.2 times the
yield stress in uniaxial tension or compression.
All terms in the wear equation, except k, are readily available parameters like load or
material hardness. Thus, the key factor in determining the adhesive wear to be expected in
any sliding situation is a knowledge of the only unknown, the wear coefficient k.
VALUES OF WEAR COEFFICIENT k
Very few investigations have been carried out with the primary aim of generating wear
202 CRC Handbook of Lubrication
FIGURE 1. Diagram to help convert various Rockwell arbitrary hardness numbers into hardness stresses,
p, in units of N/mm
2
.
Copyright © 1983 CRC Press LLC
coefficient data. One experimental study was that of Archard and Hirst
6
and the results are
shown in Table 1. The second
7
consisted of gathering the few wear coefficient values available
from published papers, and this led to the information in Table 2. The utility of these wear
coefficients is leading more and more to their use in reporting specific machine element and
material test results.
8
The two tables represent two different approaches to compiling wear coefficient data.
Table 1 lists typical data, and then a user must find a value that is representative of his
sliding conditions. In view of the endless variety of sliding, such a tabulation would have
to be extremely extensive for general use. The other approach divides all sliding systems
into a limited number of categories, and then gives appropriate wear coefficient data for
each category. This approach is used in the present chapter.
For sliding metals, the two factors which mainly determine the value of the wear coefficient
are the degree of lubrication and the metallurgical compatibility as indicated by the mutual
solubility. The metallurgical compatibility represents the degree of intrinsic attraction of the
atoms of the contacting metals for each other. Such compatibility is best determined from
binary metal phase diagrams, which show the extent of mutual solubility or insolubility in
the liquid or solid states.
Volume II 203
Table 1
WEAR COEFFICIENTS FOR
UNLUBRICATED SURFACES
Material combination Wear coefficient (k)
Low carbon steel on low carbon steel 70 × 10
−4
60/40 Brass on tool steel 6
Teflon
®
on tool steel 0.25
70/30 Brass on tool steel 1.7
Lucite on tool steel 0.07
Molded bakelite on tool steel 0.024
Silver steel on tool steel 0.6
Beryllium copper on tool steel 0.37
Tool steel on tool steel 1.3
Stellite #1 on tool steel 0.55
Ferrilic stainless steel on tool steel 0.17
Laminated bakelite on tool steel 0.0067
Tungsten carbide on low carbon steel 0.04
Polyethylene on tool steel 0.0013
Tungsten carbide on tungsten carbide 0.01
From Archard, J. F. and Hirst, W., Proc. R. Soc. London Ser. A, 236,
397. 1956. With permission.
Table 2
WEAR COEFFICIENTS FOR ADHESIVE WEAR
Metal-on-metal
Metal-on-nonmetal
Lubrication Identical Soluble Intermediate Insoluble Nonmetal-on-nonmetal
None 1500 × 10
–6
500 × 10
–6
100 × 10
–6
15 × 10
–6
3 × 10
–6
Poor 300 100 20 3 1.5
Good 30 10 2 0.3 1
Excellent 1 0.3 0.1 0.03 0.5
Copyright © 1983 CRC Press LLC
The compatibility of a large number of metal pairs is shown in Figure 2.
9
The significance
of the various circles, in terms of metallurgical solubility at room temperature, liquid mis-
cibility, metallurgical compatibility, sliding compatibility, and anticipated wear are shown
in Table 3. The general rule is that the blacker the circle, the better the sliding characteristics
and the lower the adhesive wear coefficient.
204 CRC Handbook of Lubrication
FIGURE 2. Compatibility diagram for metal pairs. The significance of the various circles is shown in Table 3.
Partial circles and blank squares are due to insufficient information.
Table 3
COMPATIBILITY RELATIONSHIPS FOR METALS
Copyright © 1983 CRC Press LLC
Four degrees of lubrication are considered in Table 2. The ‘unlubricated’case assumes
that the sliding surfaces are clean and slide without the presence of any introduced lubricant
or contaminant. The second condition, labeled ‘poor lubrication’, assumes that the surfaces
are covered by a poor lubricant, for example an inert fully fluorinated hydrocarbon, water,
or gasoline. The third condition assumes the presence of a good lubricant such as mineral
oil with lubricity additives. The fourth condition, excellent lubrication, is one in which
excellent lubricants such as those containing zinc dialkyl dithiophosphate are used at moderate
pressures and temperatures, so that surface burnishing occurs rather than wear particle
formation on a large scale.
The wear coefficient values of Table 2 are based on experimental work
10
designed to
generate wear data, as well as on published and unpublished wear data. Note that nonmetals
sliding against metals or against nonmetals give similar wear coefficients, and these are
indicated in the last column.
In applying the data of Table 2 to practical situations, two points come up. First, the
solubility of an alloy is generally that of its major constituent. Thus, the rating of an aluminum
bronze (copper 75%, aluminum 25% by volume) sliding against a stainless steel (iron 74%,
chromium 18%, nickel 8%, by volume) is the same as that of copper against iron, namely
intermediate. Second, when a liquid is heated its performance as a lubricant deteriorates
above a characteristic transition temperature. For mineral oils this temperature is around
160°C. If the interfacial temperature is above 160°C, we use the wear value for the next
higher line (e.g., a good lubricant above 160°C acts like a poor lubricant at room temperature).
To assist in using Equation 1, we show a simple example.
Illustrative Example 1
Problem
A person is writing with a pencil containing a ‘lead’ of Vickers hardness 5 kg/mm
2
. If
the writing force pressing the pencil against the paper is 0.5 N, estimate the volume of wear
in writing a five-page letter (assuming that each page corresponds to 20 m of pencil-paper
sliding).
Solution
The wear coefficient for unlubricated nonmetals is 3 × 10
−6
(Table 2). The total sliding
distance is 5 × 20 × 1000 = 10
5
mm. The hardness of the pencil is 5 × 9.8 or 49 N/
mm
2
. The normal force is given as 0.49 N. On substitution in Equation 1,
Table 2 demonstrates the very large range of wear coefficients encountered in practice,
ranging over about five orders of magnitude. Changes of the compatibilities of the surfaces
may change the wear by two orders of magnitude, while changing the state of lubrication
can affect the wear by as much as three orders of magnitude.
The condition described as excellent lubrication, in which the surfaces experience very
little wear and become burnished, is not readily attainable. For like or compatible metals it
is hardly possible to achieve excellent lubrication except when there is combined rolling
and sliding, as in spur gears. With intermediate and insoluble metals, burnishing is generally
possible if the mean interfacial pressure is less than 0.05 of the hardness stress of the softer
material.
Lubricants have much less effect on the wear coefficient of nonmetals than on metals.
Nonmetals when unlubricated give lower wear coefficients than metals, but the reverse is
true in the presence of excellent lubricants.
Volume II 205
Copyright © 1983 CRC Press LLC
ADHESIVE WEAR OF THE HARDER MATERIAL
For materials of different hardness sliding against each other, Equation 1 gives the wear
of the softer one. There has been relatively little study of the wear of the harder material,
but a good estimate may be obtained by the following procedure. If the harder surface is
harder by less than a factor of three, its wear volume will be less than that of the softer
surface as the hardness ratio squared. If the harder surface is more than a factor of three
harder, its wear will be less by three times the hardness ratio.
Illustrative Example 2
Problem
Ina certain system an aluminum alloy (hardness 60 kg/mm
2
) slides against tungsten
(hardness 480 kg/mm
2
). After a certain period of time 10 mg of aluminum are worn away.
Estimate the wear of the tungsten.
Solution
Since the density of aluminum is 2.7 mg/mm
3
, wear of the aluminum is 3.70 mm
3
.
Tungsten is 8 times harder than aluminum, and hence its wear is less by a factor of 3 ×
8, or 24. Thus, the volume wear of the tungsten is 0.154 mm
3
. Since the density of tungsten
is 18.8 mg/mm
3
, expected weight loss of the tungsten will be 2.9 mg.
ABRASIVE WEAR
Abrasive wear, the removal of material by a plowing, cutting, or scratching process, also
obeys Equation 1. The wear coefficient is determined mainly by the abrasive geometry, i.e.,
the effective sharpness of the abrasive, and to a smaller extent by the lubrication, which
determines the ease with which wear debris can be removed from the sliding interface.
Typical wear coefficient values are shown in Table 4. Abrasive wear only occurs when
the sharp material, present as protuberances or as loose grains, has a higher hardness than
the surface subject to abrasive wear. Abrasive wear coefficients tend to be higher than
adhesive wear coefficients, certainly in the case of lubricated surfaces. Thus, when abrasive
wear and adhesive wear occur together, abrasive wear is generally predominant.
CORROSIVE WEAR
This is a very complicated form of wear, in that corrosion occurs and then the products
of corrosion are worn away. Many corrosion products have some lubricating ability which
also affects the wear rate. Quantitative analyses of corrosive wear have generally resulted
in very complex expressions,
11
and nothing as simple as the wear equation can adequately
characterize corrosive wear.
206 CRC Handbook of Lubrication
Table 4
ABRASIVE WEAR COEFFICIENTS
Coefficient of wear (k)
Loose
File Abrasive paper abrasive Coarse
(new) (new) grains polishing
Dry surfaces 50 × 10
−3
10 × 10
−3
1 × 10
−3
0.1 × 10
−3
Lubricated 100 20 2 0.2
Note: These are maximum rates tor sharp fresh abrasive surfaces. After wear and
clogging, abrasive wear rates are generally reduced by up to a factor of 10.
Copyright © 1983 CRC Press LLC
The least wear coefficient resulting from the combined effects of corrosion and adhesive
wear is about 10
−6
, but as temperature is raised and corrosion becomes rampant, the wear
coefficient increases to 10
−2
and even higher. For well-designed combinations of lubricant,
surfaces, and temperature, corrosive wear coefficient values in the range of 10
−4
to 10
−5
are
frequently observed.
SURFACE FATIGUE WEAR
This is generally observed only in systems undergoing combined sliding and rolling, such
as ball bearings, gears, cams, and automotive valve lifters. It is characterized by an induction
period during which microcracks grow on and under the sliding surfaces without any readily
detectable wear. Then suddenly one or more large wear particles are produced. This process
is not amenable to treatment by expressions such as Equation 1 which assume that wear is
a steady continuous process.
APPENDIX: SOME TYPICALUSES OF WEAR COEFFICIENTS
Three examples from Reference 12 indicate ways in which wear coefficients can be used
in evaluation of worn sliding surfaces. Aknowledge of the wear coefficient value can be
used to eliminate one or more possible modes of wear, and this can frequently be done even
though typically there is an uncertainty factor of Ϯ4 in the value of wear coefficient.
Example 1: Wearof Hollow Jet Engine Turbine Blades
Certain jet engine turbine blades are cast hollow, a soft metal tube is fitted inside each
blade, and cooling air is passed through the space between the tube and the blade. The tube
was wearing away rather rapidly. The first hypothesis was that slip between the tube and
the turbine blade occurred because the turbine blade was vibrating, and consequent sliding
action led to the observed wear. The likely loads, amplitudes, and frequencies suggested a
wear coefficient of 2.4 × 10
−4
. The second theory was that slip occurred as result of a
thermal expansion mismatch between the tube and blade. Knowing the number of thermal
cycles the engine had undergone, one could compute a wear coefficient of 1.1.
Since adhesive wear coefficients of this magnitude do not exist, the thermal expansion
theory was eliminated. If the other theory is correct, then Table 2 suggests that the blade
and tube (which in terms of metallurgical compatibility represented a ‘soluble’ combination)
operated in a region of poor lubrication, or else rampant corrosive wear was occurring.
Actually, the latter was a correct description. The blades and tubes were at very high
temperatures, and the protective oxide layers were being continually worn off.
Example 2: Unusually Severe Wear of Railroad Rails
Excessive wear of railroad track carrying heavily loaded ore cars in Canada was noted.
On a sharply curved section of track, the rail wore down to an unsafe condition in only
about a year.
Approximation of the amount of slip or sliding between the train wheels and the track
(pure rolling causes essentially no adhesive wear) indicated a wear coefficient of 2 × 10
−4
.
Table 2 suggests that for identical metals (in terms of composition, railroad rails and wheels
are very similar steels), this wear coefficient is characteristic of “poor lubrication”. This
seems not unreasonable for marginal lubrication from rainfall and contamination. Thus, it
was not necessary to postulate any new and unusual phenomenon; simply the amount of
traffic and the slippage associated with the sharp curves had produced this large amount of
adhesive wear.
Volume II 207
Copyright © 1983 CRC Press LLC
Example 3: Excessive Wear of the Ways of a Cold Deformation Processing Machine
Sliding occurred between a high-carbon steel die and an aluminum bronze way at rea-
sonably high speeds and loads. A good lubricant was provided. The aluminum bronze was
wearing rather rapidly, the wear coefficient being 5 × 10
−5
.
The combination of iron against copper is of intermediate solubility and the use of a steel
as against iron, and of aluminum bronze as against copper, does not change the rating. For
a combination of intermediate solubility a wear coefficient of 5 × 10
−5
indicates poor
lubrication. In this case the machine design was such that the sliding surfaces became
overheated, and consequently the ‘good’ lubricant behaved like a ‘poor’ one. The remedy:
either improve the cooling, or use a lubricant with better performance at high temperatures.
REFERENCES
1. Archard, J. F., Contact and rubbing of flat surfaces, J. Appl. Phys, 24, 981, 1953.
2. Endo, K. and Fukada, Y., The role of fatigue in wear of metals, Proc. 8th Japan Cong. Testing Materials,
Kyoto, 1965, 69.
3. Suh, N. P., The delamination theory of wear, Wear, 25, 111, 1973.
4. Halling, J., A contribution to the theory of mechanical wear, Wear, 34, 239, 1975.
5. Holm, R., Electric Contacts, Almqvist & Wiksells, Stockholm, 1946, sect. 40.
6. Archard, J. F. and Hirst, W., The wear of metals under unlubricated conditions, Proc. R. Soc. London
Ser. A, 236, 397, 1956.
7. Rabinowicz, E., New coefficients predict wear of metal parts, Product Eng., 29(25), 71, 1958.
8. Peterson, M. B. and Winer, W. O., Eds., Wear Control Handbook, American Society of Mechanical
Engineers, New York, 1980.
9. Rabinowicz, E., The determination of the compatibility of metals through static friction tests, ASLE Trans.,
14, 198, 1971.
10. Rabinowicz, E., The dependence of the adhesive wear coefficient on the surface energy of adhesion, Wear
of Materials — 1977, American Society of Mechanical Engineers, New York, 1977, 36.
11. Uhlig, H. H., Mechanism of fretting corrosion, J. Appl. Mech., Trans. ASME, 76, 401, 1954.
12. Rabinowicz, R., The wear coefficient — magnitude, scatter, uses, J. Lubr. Technol., Trans. ASME, 103,
188, 1981.
208 CRC Handbook of Lubrication
Copyright © 1983 CRC Press LLC
LUBRICATED WEAR
Carleton N. Rowe
INTRODUCTION
The prime function of a lubricant is to reduce friction, wear, and general surface damage
by prevention of solid-solid contact of asperities on opposing surfaces. When the surfaces
are metals, the lubricant must inhibit the formation of any strong metallic junctions that
would lead to adhesive wear. By definition, any gas (vapor), liquid, or solid can serve as
a lubricant as long as it reaches the surface and physically keeps the asperities separated.
Liquid lubricants scavenge wear debris and remove heat from contacting surfaces. The
latter reduces operating temperature, resulting in the formation of thicker oil films and/or a
lower demand on the lubricant additives. Scavenging of wear debris lessens the chance of
interaction of small wear particles to form larger, work-hardened particles which can cause
abrasive wear, higher surface temperatures, and mechanical destruction of the surface an-
tiwear film.
ADHESIVE WEAR
Adhesive wear occurs under lubricated conditions when the hydrodynamic or elastohy-
drodynamic (EHL) film is so thin that surface asperities penetrate the film. Despite the
presence of intervening lubricant between two asperities on a collision path, high hydro-
dynamic pressures elastically deform the metal and squeeze out the lubricant until only a
very thin surface (boundary) film separates the surfaces.
1
Concurrently, asperity contact area
grows due to high normal and tangential stresses on the metal (plastic as well as elastic
deformation can occur) so that the trapped boundary film may be stretched until it ruptures,
thereby allowing the formation of a metal-metal junction. In addition, high-shear stresses
cause considerable local heating, which weakens the adsorption forces of the surface film.
Mineral oil molecules and simple polar compounds desorb under these high temperatures,
again allowing metal-metal contact.
A number of mathematical models for lubricated wear are based on modifications of the
equation for unlubricated adhesive wear. The usual mathematical model for adhesive wear
rate (V/d) may be modified to:
2
(1)
where V is the volume of wear, d is the sliding distance, K
m
is the dimensionless adhesive
wear coefficient for the particular sliding couple free of any surface contamination, A
m
is
the true area of metallic contact within the total true area of contact A, W is the load, H is
the hardness, and α is the fractional defect of the surface film. Lubricant effectiveness in
mitigating wear is expressed entirely by α, although the metal is indirectly involved through
lubricant-metal interactions. Even under nominally dry sliding conditions, adsorbed gas
molecules or oxide film function to some extent as a lubricant so that αK
m
is reduced to a
typical value of 1 × 10
−3
. K
m
for most metals is of the order of 0.1 to 0.2.
3
A model for a defect in the surface film assumes that the energy of adsorption-desorption
is critical to the effectiveness of the lubricant molecule on the surface.
2
Parameter α may
be expressed as
(2)
Volume II 209
Copyright © 1983 CRC Press LLC
where X is the diameter of the area associated with an adsorbed lubricant molecule, t
o
, is
the fundamental time of oscillation of the molecule in the adsorbed state, U is the sliding
velocity, E is the energy of adsorption, T
s
is the surface temperature, and R is the gas
constant. Combining with Equation 1.
(3)
Amodification of the equation for lubrication by gases correlates the wear results of
graphite in the presence of hydrocarbon vapors at varying vapor pressure, and the vapor
pressure for a given wear rate correlates with the heats of adsorption of hydrocarbon, alcohol,
carbon tetrachloride and water vapors.
4
The following expression was derived for the presence of an antiwear additive in a base
oil:
5
(4)
where (V/d)
c
and (V/d)
b
are the wear rates for additive concentration C and for base oil,
respectively, ΔS
o
is the entropy change for the system, and the t
o
′is the ratio of the
fundamental oscillation times of additive and solvent on the surface. Figure 1 plots the wear
rate of a copper pin-on-steel against the quantity in brackets of Equation 4 for stearic acid
solutions at 77°C. From the slope and intercept, the adsorption-desorption equilibrium con-
stant K can be calculated from the expression
(5)
Figure 2 is a plot of the calculated values of the equilibrium constant and ΔE(ΔE = E
a
–
E
b
) from wear tests of n-octadecanol, n-octadecanoic acid, and n-octadecylamine solutions
in n-hexadecane using AISI-1020 steel surfaces in a pin-on-disk machine. The values are
plotted against independently published surface potential measurements of the same additives
on steel surfaces.
6
The order amine > acid > alcohol agrees with friction measurements of
monolayers and wetting measurements of adsorbed films from n-hexadecane on metal
7
and
with four-ball wear results.
8
Collectively, these results support the concept that adsorbed surface films of long-chain
polar compounds reduce adhesive wear and that the magnitude of the energy of adsorption
is a controlling factor. For antiwear additives that function by chemical reaction with the
metal substrate, reaction rates are probably fast compared to desorption of the reaction
product, so that desorption energy of the reaction product is controlling and the model
remains applicable.
CORROSIVE CHEMICAL WEAR
Antiwear and extreme pressure additives generally function by chemical reaction with
surfaces. For example, organic disulfides form an iron mercaptide on steel surfaces under
mild conditions
9
and iron sulfide under more severe operating conditions.
10
Likewise,
organophosphates, such as tricresyl phosphate, react with iron surfaces to produce iron
organophosphate under mild operating conditions and iron phosphate under severe conditions
of high-load and high-surface temperature.
11
210 CRC Handbook of Lubrication
Copyright © 1983 CRC Press LLC
amount required to control adhesive wear. Under normal circumstances, however, the amount
of corrosive wear is only a small fraction of the adhesive wear that would occur if the
antiwear or EPadditive were not present.
Corrosive wear may occur by selective chemical reaction with one component in a bearing
alloy followed by the reaction product dissolving in the oil. An example is the selective loss
of lead in copper-lead connecting rod bearings by halide scavengers from the leaded fuel.
l2
Where corrosion is a problem, additives are added to the oil to prevent the chemical reactions,
either by inhibiting oil oxidation or by surface adsorption of metal deactivators.
ADHESIVE WEAR-CHEMICALWEAR BALANCE
Abalance may be obtained between adhesive and chemical wear under optimum condi-
tions. Under operating conditions in which chemical reactivity of the lubricant is very low
the adhesive wear process will dominate; alternatively, corrosive wear will dominate when
chemical reactivity is excessive. An optimum balance is found as additive concentration is
varied. Figure 3 shows the wear rate of a copper pin as a function of zinc 0,0-diisopropyl-
phosphorodithioate concentration in n-hexadecane.
5
At extremely low-additive concentra-
tions, the surface is only partially protected and adhesive wear predominates. At high-
additive concentrations, an excessively thick chemical reaction film is formed and worn
during sliding.
More severe sliding conditions require greater chemical reactivity or higher additive
concentrations for achieving the optimum balance between adhesive and chemical wear.
Consequently, the curve in Figure 3 will shift to the right, as shown in Figure 4. The
observed wear with reactivity Awill be controlled by chemical wear for severity I, optimum
balance of adhesive and chemical wear in II, and adhesive wear in III. This figure illustrates
the difficulty frequently encountered in rating antiwear additives among various bench wear
tests and field applications arising from the variation in severity at the rubbing interfaces.
Definition and measurement of chemical reactivity at a metal surface is difficult because
reaction rate is exceedingly low under normal ambient conditions. Figure 5 plots wear vs.
corrosion rate of an electrically heated iron wire for a variety of organic phosphites and
phosphates in a refined bright stock oil.
13
Others measured the rate of decomposition of zinc
0,0-dialkylphosphorodithioates and found correlation between the wear rate of a copper pin
sliding against steel vs. the rate of hydrogen sulfide formation.
14
212CRC Handbook of Lubrication
FIGURE 3. Effect of concentration on wear rate of a copper pin with zinc 0,0-
diisopropylphosphorodithioate additive in cetane. (From Rowe, C. N., ASLE
Trans., 13, 179, 1970. With permission.)
Copyright © 1983 CRC Press LLC
k with and without EP additive, and k is the rate of change of radius of the electrically
heated wire. The separate curves for the sulfur- and chlorine-containing compounds suggest
that the effectiveness of the surface reaction product is also an important parameter.
Unfortunately, comprehensive guidelines for achieving maximum wear life are often not
available due to a lack of understanding of many parameters including the following:
1. Local surface temperatures and pressures
2. Catalytic properties of deformed metal and newly created surface
3. Chemical reactions between the additive and the metal
4. Possible role of oxygen in the chemical reactions
5. Surface reaction and diffusion kinetics
6. Lubricant residence time in the contact zone
7. Optimum surface film thickness for maximum antiwear response
8. Properties of the surface film that control its rheology, shear strength, and adherence
to the metal
With a completely formulated lubricant, additive interactions can occur in the bulk phase
as well as in competing reactions with the surface, making the composition of the boundary
film and its properties even more complex. In addition, a given lubricant is frequently
required to lubricate different types of contacts with varying levels of severity and different
metallurgies that can give entirely different surface reaction products. Nevertheless, various
load-carrying and wear test results have led to valuable guidelines for producing effective
additives to satisfy increasingly severe performance demands.
214 CRC Handbook of Lubrication
FIGURE 6. Dependence of load-carrying capacity on chemical reactiv-
ity. (From Sakurai, T. and Sato, K., ASLE Trans., 13, 252, 1970. With
permission.)
Copyright © 1983 CRC Press LLC
From Forbes, E. S., Allum, K. G., Neustadter,
E. L., and Reid, A. J. D., Wear, 15, 341, 1970.
With permission.
Kinetics of Surface Reactions
Kinetics of chemical reactions of antiwear and EPadditives with sliding surfaces are
important for maximum effectiveness. Reaction of radioactive S
35
EPadditives with rubbing
surfaces in a pin-on-disk machine has been investigated, modeled mathematically, and
various rate constants calculated. References 15 to 18 constitute a formidable beginning to
sort out the kinetics of adsorption, chemical reactions, and wear of reaction products in
contact areas.
The adsorption and the configuration of the adsorbed molecule before chemical reaction
takes place are important.
19
Diester sulfides having the structure
[—S—(CH
2
)
n
COOC
2
H
5
]
2
where n = 1, 2, or 3 were found to be effective antiwear compounds at low concentrations.
At high concentrations, however, they possess poor EPproperties, so that wear is adhesive.
Electron probe microanalysis showed appreciable sulfur present on the wear scar at low
concentrations but very little at high. Heats of adsorption in Table 1 show that the ester
groups contribute more to adsorption than do the sulfur atoms. Evidently, at low concen-
trations both sulfur and ester groups lie on the surface and the sulfur is available for forming
iron sulfide. At high concentrations, the more strongly adsorbed ester group displaces the
sulfur atoms, thereby eliminating sulfur from chemical reaction with the surface.
The importance of the kinetics of additive-metal chemical reactions may be illustrated in
comparison of phosphorus and sulfur EPadditives in CRC L-37 and L-42 hypoid gear tests.
Sulfur compounds generally function best at high-speed/low-load test (L-42) conditions while
phosphorus compounds function best at low-speed/high-load test (L-37) conditions. High-
speed operation results in short time intervals between repeated contacts so that the reaction
kinetics of sulfur compounds may be more favorable for the L-42 test.
Temperature
Temperature is the key parameter in many lubrication mechanisms for controlling wear.
Temperature determines the viscosity of the lubricant and its ability to generate a viscous
film for keeping the surfaces separated. As temperature increases, the chance of asperity
interactions increases and greater demand is placed on the surface film.
Surface temperature determines the reaction kinetics of antiwear and EPadditives with
rubbing surfaces. Many EPadditives require some minimum threshold temperature to become
effective. Providing the reaction is endothermic, a further increase in surface temperature
can lead to excessive chemical reaction and possible chemical wear (Figure 4).
At excessively high surface temperatures, however, the following factors can lead to a
loss in additive response: (1) a decrease in adhesion to the metal substrate, (2) increased
Volume II 215
Table 1
HEAT OF ADSORPTION OF
ADDITIVES ON IRON OXIDE
Copyright © 1983 CRC Press LLC
desorption due to greater oil solubility, and (3) a modification of the rheology or shear
properties of the film. As the surface film becomes less effective, the increased metallic
contact leads to higher friction, even higher surface temperatures, and the onset of cata-
strophic wear. This has become known as the transition temperature phenomenon.
20
Load
Wear rate is proportional to load in Equation 1 because the true area of contact is pro-
portional to load under thin film conditions. As the number of asperity contacts increases
with increasing load, a point is eventually reached where the diminishing lubricant film can
no longer support the load. This is the point of transition from mild (acceptable) wear to
ineffective lubrication and catastrophic adhesive wear.
Wear transitions with increasing load are common in the four-ball wear test. The value
of the dimensionless wear coefficient K,
(6)
for a paraffinic oil at 15-kg load and 1 hr was 7.8 × 10
−8
, while at 60- and 70-kg load and
1 min tests the K values are 6.6 × 10
−4
and 6.9 × 10
−4
, respectively.
21
Wear rate above
the transition is about 10,000 times higher.
Aplausible mechanism for the abrupt transition in wear may be found in the behavior of
wear debris. Below the load transition, generated wear particles are able to escape the
geometrical area of contact without extensive interaction with each other. As the number of
metallic contacts and resultant wear particles increase, the rate of generating wear particles
eventually exceeds the rate at which they can escape without interaction and aggregation.
Wear particle interaction then causes a rapid deterioration of the lubricant surface film,
probably by both a mechanical action and a temperature rise at the surfaces.
Sliding Velocity
Sliding velocity can have opposing effects. At low sliding velocity an increase in velocity
decreases wear because of the generation of micro-EHLfilms
1
and the reduced chance of
squeezing the surface film from between colliding asperities.
22
Equation 3 suggests that wear
is inversely proportional to sliding velocity. At high sliding velocities, high surface tem-
peratures may be experienced since temperature rise is proportional to sliding velocity.
Comments made previously on temperature apply.
Wear Coefficients
The value of K (K =αK
m
) for unlubricated AISI-52100 steel is of the order of 1 ×
10
−3
.
23
For antiwear and EPadditives, K values are of the order of 10
−9
to 10
−7
in four-
ball wear tests.
24
Table 2 gives K values for zinc dialkylphosphorodithioates and typical
phosphorus and sulfur compounds in the four-ball wear test and shows that the K ranking
is roughly
These results.show that effective lubricants can reduce wear to about one millionth of that
under unlubricated sliding conditions
ABRASIVE WEAR
Abrasive wear results from a cutting action by (1) a rough, hard surface sliding against
216 CRC Handbook of Lubrication
Copyright © 1983 CRC Press LLC