Data Analysis Machine Learning and Applications Episode 2 Part 6 potx
Bạn đang xem bản rút gọn của tài liệu. Xem và tải ngay bản đầy đủ của tài liệu tại đây (553.76 KB, 25 trang )
424 Joaquin Vanschoren and Hendrik Blockeel
all their parameters. Also, 86 commonly used classification datasets were taken from
the UCI repository and inserted together with their calculated characteristics. Then,
to generate a sample of classification experiments that covers a wide range of con-
ditions, while also allowing to test the performance of some algorithms under very
specific conditions, some algorithms were explored more thoroughly than others.
First, we ran all experiments with their default parameter settings on all datasets.
Secondly, we defined sensible values for the most important parameters of the algo-
rithms SMO (which trains a support vector machine), MultilayerPerceptron, J48 (a
C4.5 implementation), 1R (a simple rule learner) and Random Forests (an ensemble
learner) and varied each of these parameters one by one, while keeping all other pa-
rameters at default. Finally, we further explored the parameter spaces of J48 and 1R
by selecting random parameter settings until we had about 1000 experiments on each
dataset. For all randomized algorithms, each experiment was repeated 20 times with
different random seeds. All experiments (about 250,000 in total) where evaluated
using 10-fold cross-validation, using the same folds for each dataset.
An online interface is available at
/>for
those who want to reuse experiments for their own purposes, together with a full
description and code which may be of use to set up similar databases, for example to
store, analyse and publish the results of large benchmark studies.
4 Using the database
We will now illustrate how easy it is to use this experiment database to investigate
a wide range of questions on the behavior of learning algorithms by simply writing
the right queries and interpreting the results, or by applying data mining algorithms
to model more complex interactions.
4.1 Comparing different algorithms
A first question may be “How do all algorithms in this database compare on a spe-
cific dataset D?” To investigate this, we query for the learning algorithm name and
evaluation result (e.g. predictive accuracy), linked to all experiments on (an instance
of) dataset D, which yields the following query:
SELECT l.name, v.pred_acc
FROM experiment e, learner_inst li, learner l, data_inst di,
dataset d, evaluation v
WHERE v.eid = e.eid and e.learner_inst = li.liid and li.lid = l.lid
and e.data_inst = di.diid and di.did = d.did and d.name=
'
D
'
We can now interpret the returned results, e.g. by drawing a scatterplot. For
dataset
monks-problems-2
(a near-parity problem), this yields Fig. 2, giving a clear
overview of how each algorithm performs and (for those algorithms whose param-
eters where varied) how much variance is caused by different parameter settings.
Only a few algorithms surpass default accuracy (67%) and while some cover a wide
Investigating Classifier Learning Behavior with Experiment Databases 425
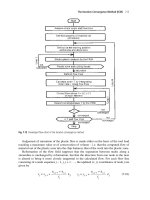
Fig. 2. Algorithm performance comparison on the
monks-problems-2_test
dataset.
spectrum (like J48), others jump to 100% accuracy for certain parameter settings
(SMO with higher-order polynomial kernels and MultilayerPerceptron when enough
hidden nodes are used).
We can also compare two algorithms A1 and A2 on all datasets by joining their
performance results (with default settings) on each dataset, and plotting them against
each other, as shown in Fig. 3. Moreover, querying also allows us to use aggregates
and to order results, e.g. to directly build rankings of all algorithms by their average
error over all datasets, using default parameters:
SELECT l.name, avg(v.mn_abs_err) AS avg_err FROM experiment e,
learner l, learner_inst li, evaluation v WHERE v.eid = e.eid and
e.learner_inst = li.liid and li.lid = l.lid and li.default = true
GROUP BY l.name ORDER BY avg_err asc
Similar questions can be answered in the same vein. With small adjustments, we
canqueryforthevariance, ofeach algorithm’s error (over all or a single dataset),
study how much error rankings differ from one dataset to another, or study how
parameter optimization affects these rankings.
SELECT s1.name, avg(s1.pred_acc) AS A1_acc, avg(s2.pred_acc) AS
A2_acc FROM (SELECT d.name, e.pred_acc FROM WHERE l.name =
'
A1
'
) AS s1 JOIN (SELECT d.name, e.pred_acc FROM WHERE l.name =
'
A2
'
) AS s2 ON s1.name = s2.name GROUP BY s1.name
Fig. 3. Comparing relative performance of J48 and OneR with a single query.
426 Joaquin Vanschoren and Hendrik Blockeel
4.2 Querying for parameter effects
Previous queries generalized over all parameter settings. Yet, starting from our first
query, we can easily study the effect of a specific parameter P by “zooming in” on
the results of algorithm A (by adding this constraint) and selecting the value of P
linked to (an instantiation of) A, yielding Fig. 4a:
SELECT v.pred_acc, lv.value
FROM experiment e, learner_inst li, learner l, data_inst di,
dataset d, evaluation v, learner_parameter lp, learner_parval lv
WHERE v.eid = e.eid and e.learner_inst = li.liid and li.lid = l.lid
and l.name=
'
A
'
and lv.liid=li.liid and lv.pid = lp.pid and lp.
name=
'
P
'
and e.data_inst = di.diid and di.did = d.did and d.name=
'
D
'
Sometimes the effect of a parameter P may be dependent on the value of another
parameter. Such a parameter P2 can however be controlled (e.g. by demanding its
value to be larger than V) by extending the previous query with a constraint requiring
that the learner instances additionally are amongst those where parameter P2 obeys
those constraints.
WHERE and lv.liid IN
(SELECT lv.liid FROM learner_parval lv, learner_parameter lp
WHERE lv.pid = lp.pid and lp.name=
'
P2
'
and lv.value>V)
Launching and visualizing such queries yield results such as in Fig. 4, clearly
showing the effect of the selected parameter and the variation caused by other pa-
rameters. As such, it is immediately obvious how general an observed trend is: all
constraints are explicitly mentioned in the query.
Fig. 4. The effect of the minimal leafsize of J48 on
monks-problems-2_test
(a), after re-
quiring binary trees (b), and after also suppressing reduced error pruning (c)
Investigating Classifier Learning Behavior with Experiment Databases 427
4.3 Querying for the effect of dataset properties
It also becomes easy to investigate the interactions between data properties and learn-
ing algorithms. For instance, we can use our experiments to study the effect of a
dataset’s size on the performance of algorithm A
2
:
SELECT v.pred_acc, d.nr_examples
FROM experiment e, learner_inst li, learner l, data_inst di,
dataset d, evaluation v
WHERE v.eid = e.eid and e.learner_inst = li.liid and li.lid = l.lid
and l.name=
'
A
'
and e.data_inst = di.diid and di.did = d.did
4.4 Applying data mining techniques to the experiment database
There can be very complex interactions between parameter settings, dataset charac-
teristics and the resulting performance of learning algorithms. However, since a large
number of experimental results are available for each algorithm, we can apply data
mining algorithms to model those interactions.
For instance, to automatically learn which of J48’s parameters have the greatest
impact on its performance on
monks-problems-2_test
(see Fig. 4), we queried
for the available parameter settings and corresponding results. We discretized the
performance with thresholds on 67% (default accuracy) and 85%, and we used J48
to generate a (meta-)decision tree that, given the used parameter settings, predicts in
which interval the accuracy lies. The resulting tree (with 97.3% accuracy) is shown
in Fig. 5. It clearly shows which are the most important parameters to tune, and how
they affect J48’s performance.
Likewise, we can study for which dataset characteristics one algorithm greatly
outperforms another. Starting from the query in Fig. 3, we additionally queried for
a wide range of data characteristics and discretized the performance gain of J48
over 1R in three classes: “draw”, “win_J48” (4% to 20% gain), and “large_win_J48”
(20% to 70% gain). The tree returned by J48 on this meta-dataset is shown in Fig. 6,
and clearly shows for which kinds of datasets J48 has a clear advantage over OneR.
Fig. 5. Impact of parameter settings. Fig. 6. Impact of dataset properties.
2
To control the value of additional dataset properties, simply add these constraints to the list:
WHERE and d.nr_attributes>5
.
428 Joaquin Vanschoren and Hendrik Blockeel
4.5 On user-friendliness
The above SQL queries are relatively complicated. Part of this is however a conse-
quence of the relatively complex structure of the database. A good user interface,
including a graphical query tool and an integrated visualization tool, would greatly
improve the usability of the database.
5 Conclusions
We have presented an experiment database for classification, providing a
well-structured repository of fully described classification experiments, thus allow-
ing them to be easily verified, reused and related to theoretical properties of algo-
rithms and datasets. We show how easy it is to investigate a wide range of questions
on the behavior of these learning algorithms by simply writing the right queries and
interpreting the results, or by applying data mining algorithms to model more com-
plex interactions. The database is available online and can be used to gain new in-
sights into classifier learning and to validate and refine existing results. We believe
this database and underlying software may become a valuable resource for research
in classification and, more broadly, machine learning and data analysis.
Acknowledgements
We thank Anneleen Van Assche and Celine Vens for their useful comments and help
building meta-decision trees and Anton Dries for implementing the dataset character-
izations. Hendrik Blockeel is Postdoctoral Fellow of the Fund for Scientific Research
- Flanders (Belgium) (FWO-Vlaanderen), and this research is further supported by
GOA 2003/08 “Inductive Knowledge Bases”.
References
BLOCKEEL, H. (2006): Experiment databases: A novel methodology for experimental re-
search. Lecture Notes in Computer Science, 3933, 72-85.
BLOCKEEL, H. and Vanschoren J. (2007): Experiment Databases: Towards an Improved Ex-
perimental Methodology in Machine Learning. Lecture Notes in Computer Science, 4702,
to appear.
KALOUSIS, A. and HILARIO, M. (2000): Building Algorithm Profiles for prior Model Se-
lection in Knowledge Discovery Systems. Engineering Intelligent Syst., 8(2).
PENG, Y. et al. (2002): Improved Dataset Characterisation for Meta-Learning. Lecture Notes
in Computer Science, 2534, 141-152.
VAN SOMEREN, M. (2001): Model Class Selection and Construction: Beyond the Pro-
crustean Approach to Machine Learning Applications. Lecture Notes in Computer Sci-
ence, 2049, 196-217.
WITTEN, I.H. and FRANK, E. (2005): Data Mining: Practical Machine Learning Tools and
Techniques (2nd edition). Morgan Kaufmann.
KNIME: The Konstanz Information Miner
Michael R. Berthold, Nicolas Cebron, Fabian Dill, Thomas R. Gabriel, Tobias
Kötter, Thorsten Meinl, Peter Ohl, Christoph Sieb, Kilian Thiel and Bernd
Wiswedel
ALTANA Chair for Bioinformatics and Information Mining,
Department of Computer and Information Science, University of Konstanz,
Box M712, 78457 Konstanz, Germany
Abstract. The Konstanz Information Miner is a modular environment, which enables easy
visual assembly and interactive execution of a data pipeline. It is designed as a teaching,
research and collaboration platform, which enables simple integration of new algorithms and
tools as well as data manipulation or visualization methods in the form of new modules or
nodes. In this paper we describe some of the design aspects of the underlying architecture and
briefly sketch how new nodes can be incorporated.
1 Overview
The need for modular data analysis environments has increased dramatically over the
past years. In order to make use of the vast variety of data analysis methods around, it
is essential that such an environment is easy and intuitive to use, allows for quick and
interactive changes to the analysis process and enables the user to visually explore
the results. To meet these challenges data pipelining environments have gathered
incredible momentum over the past years. Some of today’s well-established (but un-
fortunately also commercial) data pipelining tools are InforSense KDE (InforSense
Ltd.), Insightful Miner (Insightful Corporation), and Pipeline Pilot (SciTegic). These
environments allow the user to visually assemble and adapt the analysis flow from
standardized building blocks, which are then connected through pipes carrying data
or models. An additional advantage of these systems is the intuitive, graphical way
to document what has been done.
KNIME, the Konstanz Information Miner provides such a pipelining environment.
Figure 1 shows a screenshot of an example analysis flow. In the center, a flow is
reading in data from two sources and processes it in several, parallel analysis flows,
consisting of preprocessing, modeling, and visualization nodes. On the left a reposi-
tory of nodes is shown. From this large variety of nodes, one can select data sources,
data preprocessing steps, model building algorithms, as well as visualization tools
and drag them onto the workbench, where they can be connected to other nodes. The
320 Berthold et al.
Fig. 1. An example analysis flow inside KNIME.
ability to have all views interact graphically (visual brushing) creates a powerful en-
vironment to visually explore the data sets at hand.
KNIME is written in Java and its
graphical workflow editor is implemented as an Eclipse (Eclipse Foundation (2007))
plug-in. It is easy to extend through an open API and a data abstraction framework,
which allows for new nodes to be quickly added in a well-defined way.
In this paper we describe some of the internals of
KNIME in more detail. More
information as well as downloads can be found at
.
2 Architecture
The architecture of KNIME was designed with three main principles in mind.
• Visual, interactive framework: Data flows should be combined by simple
drag&drop from a variety of processing units. Customized applications can be
modeled through individual data pipelines.
• Modularity: Processing units and data containers should not depend on each other
in order to enable easy distribution of computation and allow for independent de-
velopment of different algorithms. Data types are encapsulated, that is, no types
are predefined, new types can easily be added bringing along type specificren-
derers and comparators. New types can be declared compatible to existing types.
• Easy expandability: It should be easy to add new processing nodes or views and
distribute them through a simple plugin mechanism without the need for compli-
cated install/deinstall procedures.
KNIME: The Konstanz Information Miner 321
In order to achieve this, a data analysis process consists of a pipeline of nodes, con-
nected by edges that transport either data or models. Each node processes the arriv-
ing data and/or model(s) and produces results on its outputs when requested. Fig-
ure 2 schematically illustrates this process. The type of processing ranges from basic
data operations such as filtering or merging to simple statistical functions, such as
computations of mean, standard deviation or linear regression coefficients to compu-
tation intensive data modeling operators (clustering, decision trees, neural networks,
to name just a few). In addition, most of the modeling nodes allow for an interactive
exploration of their results through accompanying views. In the following we will
briefly describe the underlying schemata of data, node, workflow management and
how the interactive views communicate.
2.1 Data structures
All data flowing between nodes is wrapped within a class called
DataTable
, which
holds meta-information concerning the type of its columns in addition to the actual
data. The data can be accessed by iterating over instances of
DataRow
. Each row
contains a unique identifier (or primary key) and a specific number of
DataCell
objects, which hold the actual data. The reason to avoid access by Row ID or index is
scalability, that is, the desire to be able to process large amounts of data and therefore
not be forced to keep all of the rows in memory for fast random access.
KNIME
employs a powerful caching strategy which moves parts of a data table to the hard
drive if it becomes too large. Figure 3 shows a UML diagram of the main underlying
data structure.
2.2 Nodes
Nodes in
KNIME are the most general processing units and usually resemble one node
in the visual workflow representation. The class
Node
wraps all functionality and
Fig. 2. A schematic for the flow of data and models in a KNIME workflow.
322 Berthold et al.
makes use of user defined implementations of a
NodeModel
, possibly a
NodeDialog
,
and one or more
NodeView
instances if appropriate. Neither dialog nor view must be
implemented if no user settings or views are needed. This schema follows the well-
known Model-View-Controller design pattern. In addition, for the input and output
connections, each node has a number of
Inport
and
Outport
instances, which can
either transport data or models. Figure 4 shows a UML diagram of this structure.
2.3 Workflow management
Workflows in
KNIME are essentially graphs connecting nodes, or more formally, a
direct acyclic graph (DAG). The
WorkflowManager
allows to insert new nodes and
to add directed edges (connections) between two nodes. It also keeps track of the
status of nodes (configured, executed, ) and returns, on demand, a pool of exe-
cutable nodes. This way the surrounding framework can freely distribute the work-
load among a couple of parallel threads or – in the future – even a distributed cluster
of servers. Thanks to the underlying graph structure, the workflow manager is able
to determine all nodes required to be executed along the paths leading to the node
the user actually wants to execute.
Fig. 3. A UML diagram of the data structure and the main classes it relies on.
KNIME: The Konstanz Information Miner 323
Fig. 4. A UML diagram of the Node and the main classes it relies on.
2.4 Views and interactive brushing
Each Node can have an arbitrary number of views associated with it. Through re-
ceiving events from a
HiLiteHandler
(and sending events to it) it is possible to
mark selected points in such a view to enable visual brushing. Views can range from
simple table views to more complex views on the underlying data (e. g. scatterplots,
parallel coordinates) or the generated model (e. g. decision trees, rules).
2.5 Meta nodes
So-called Meta Nodes wrap a sub workflow into an encapsulating special node. This
provides a series of advantages such as enabling the user to design much larger,
more complex workflows and the encapsulation of specific actions. To this end some
customized meta nodes are available, which allow for a repeated execution of the
enclosed sub workflow, offering the ability to model more complex scenarios such as
cross-validation, bagging and boosting, ensemble learning etc. Due to the modularity
of
KNIME, these techniques can then be applied virtually to any (learning) algorithm
available in the repository.
Additionally, the concept of Meta Nodes helps to assign dedicated servers to this
subflow or export the wrapped flow to other users as a predefined module.
2.6 Distributed processing
Due to the modular architecture it is easy to designate specific nodes to be run on
separate machines. But to accommodate the increasing availability of multi-core ma-
324 Berthold et al.
chines, the support for shared memory parallelism also becomes increasingly impor-
tant.
KNIME offers a unified framework to parallelize data-parallel operations. Sieb
et al. (2007) describe further extensions, which enable the distribution of complex
tasks such as cross validation on a cluster or a GRID.
3 Repository
KNIME already offers a large variety of nodes, among them are nodes for various
types of data I/O, manipulation, and transformation, as well as data mining and ma-
chine learning and a number of visualization components. Most of these nodes have
been specifically developed for
KNIME to enable tight integration with the frame-
work; other nodes are wrappers, which integrate functionality from third party li-
braries. Some of these are summarized in the next section.
3.1 Standard nodes
• Data I/O: generic file reader, and reader for the attribute-relation file format
(ARFF), database connector, CSV and ARFF writer, Excel spreadsheet writer
• Data manipulation: row and column filtering, data partitioning and sampling,
sorting or random shuffling, data joiner and merger
• Data transformation: missing value replacer, matrix transposer, binners, nominal
value generators
• Mining algorithms: clustering (k-means, sota, fuzzy c-means), decision tree,
(fuzzy) rule induction, regression, subgroup and association rule mining, neural
networks (probabilistic neural networks and multi-layer-perceptrons)
• Visualization: scatter plot, histogram, parallel coordinates, multidimensional scal-
ing, rule plotters
• Misc: scripting nodes
3.2 External tools
KNIME integrates functionality of different open source projects that essentially cover
all major areas of data analysis such as WEKA (Witten and Frank (2005)) for ma-
chine learning and data mining, the R environment (R Development core team (2007))
for statistical computations and graphics, and JFreeChart (Gilbert (2005)) for visual-
ization.
• WEKA: essentially all algorithm implementations, for instance support vector
machines, Bayes networks and Bayes classifier, decision tree learners
• R-project: console node to interactively execute R commands, basic R plotting
node
• JFreeChart: various line, pie and histogram charts
The integration of these tools not only enriches the functionality available in
KNIME but has also proven to be helpful to overcome compatibility limitations when
the aim is on using these different libraries in a shared setup.
KNIME: The Konstanz Information Miner 325
4 Extending KNIME
KNIME already includes plug-ins to incorporate existing data analysis tools. It is usu-
ally straightforward to create wrappers for external tools without having to modify
these executables themselves. Adding new nodes to
KNIME, also for native new op-
erations, is easy. For this, one needs to extend three abstract classes:
•
NodeModel
: this class is responsible for the main computations. It requires to
overwrite three main methods:
configure()
,
execute()
, and
reset()
. The
first takes the meta information of the input tables and creates the definition of
the output specification. The
execute
function performs the actual creation of
the output data or models, and
reset
discards all intermediate results.
•
NodeDialog
: this class is used to specify the dialog that enables the user to ad-
just individual settings that affect the node’s execution. A standardized set of
DefaultDialogComponent
objects allows the node developer to quickly create
dialogs when only a few standard settings are needed.
•
NodeView
: this class can be extended multiple times to allow for different views
onto the underlying model. Each view is automatically registered with a
HiLiteHandler
which sends events when other views have hilited points and
allows to launch events in case points have been hilit inside this view.
In addition to the three model, dialog, and view classes the programmer also needs to
provide a
NodeFactory
, which serves to create new instances of the above classes.
The factory also provides names and other details such as the number of available
views or a flag indicating absence or presence of a dialog.
A wizard integrated in the Eclipse-based development environment enables con-
venient generation of all required class bodies for a new node.
5 Conclusion
KNIME, the Konstanz Information Miner offers a modular framework, which pro-
vides a graphical workbench for visual assembly and interactive execution of data
pipelines. It features a powerful and intuitive user interface, enables easy integration
of new modules or nodes, and allows for interactive exploration of analysis results or
trained models. In conjunction with the integration of powerful libraries such as the
WEKA data mining toolkit and the R-statistics software, it constitutes a feature rich
platform for various data analysis tasks.
KNIME is an open source project available at . The current
release version 1.2.1 (as of 14 May 2007) has numerous improvements over the first
public version released in July 2006.
KNIME is actively maintained by a group of
about 10 people and has more than 6 000 downloads so far. It is free for non-profit
and academic use.
326 Berthold et al.
References
INFORSENSE LTD.: InforSense KDE.
/>.
INSIGHTFUL CORPORATION: Insightful Miner.
/>products/iminer/default.asp
.
SCITEGIC: Pipeline Pilot.
/>.
ECLIPSE FOUNDATION (2007):Eclipse 3.2 Documentation. .
GILBERT, D. (2005): JFreeChart Developer Guide. Object Refinery Limited, Berkeley, Cal-
ifornia. />R DEVELOPMENT CORE TEAM (2007): R: A language and environment for statistical
computing. R Foundation for Statistical Computing, Vienna, Austria. ISBN 3-900051-
07-0. .
SIEB C., MEINL T., and BERTHOLD, M. R. (2007): Parallel and distributed data pipelining
with
KNIME. Mediterranean Journal of Computers and Networks, Special Issue on Data
Mining Applications on Supercomputing and Grid Environments. To appear.
WITTEN, I. H. and FRANK, E (2005): Data Mining: Practical ma-
chine learning tools and techniques. Morgan Kaufmann, San Francisco.
/>On the Analysis of Irregular Stock Market Trading
Behavior
Markus Franke, Bettina Hoser and Jan Schröder
Information Services and Electronic Markets
Universität Karlsruhe (TH), Germany
{franke, hoser, schroeder}@iism.uni-karlsruhe.de
Abstract. In this paper, we analyze the trading behavior of users in an experimental stock
market with a special emphasis on irregularities within the set of regular trading operations. To
this end the market is represented as a graph of traders that are connected by their transactions.
Our analysis is executed from two perspectives: On a micro scale view fraudulent transactions
between traders are introduced and described in terms of the patterns they typically produce
in the market’s graph representation. On a macro scale, we use a spectral clustering method
based on the eigensystem of complex Hermitian adjacency matrices to characterize the trad-
ing behavior of the traders and thus characterize the market. Thereby, we can show the gap
between the formal definition of the market and the actual behavior within the market where
deviations from the allowed trading behavior can be made visible. These questions are for
instance relevant with respect to the forecast efficiency of experimental stock markets since
manipulations tend to decrease the precision of the market’s results. To demonstrate this we
show some results of the analysis of a political stock market that was set up for the 2006 state
parliament elections in Baden-Wuerttemberg, Germany.
1 Introduction
Stock markets do not only attract the good traders but also the ones who try to ma-
nipulate the market. The approaches used by malign traders differ with respect to the
design of the market, but altogether tend to bias its outcome. In this contribution, we
present basic behavior patterns that are characteristic of irregular trading activities
and discuss an approach for their detection. We concentrate on patterns that tend to
appear in prediction markets. In the first section we adopt a micro scale perspec-
tive, describing the traders’ individual motivation for malicious actions and deriving
the characteristics of two basic patterns. The second and third section approach a
market’s transaction records from a broader (macro) view. The market data is ana-
lyzed by means of a clustering method on the results of a certain type of eigensystem
analysis, finding a reliable way of discovering the patterns sought.
356 Markus Franke, Bettina Hoser and Jan Schröder
2 Irregular trading behavior in a market
There are several incentives to act in a fraudulent way which result in the basic
patterns price manipulation and circular trading. In this introductory section, we will
show these basic patterns that constitute the micro scale view of the market activities.
They can be made visible when the money or share flows in the market are used to
generate a graph of traders and flows as shown in section 4.2.
Price manipulation are for instance motivated by idealistic reasons: Members
of parties that may or may not take the hurdle of five percent introduced by German
electoral laws have an incentive to set a price slightly above 5% in order to signal that
every vote given for this party counts. This in turn is expected to motivate electors
to vote who have not yet decided whether to vote at all (see Franke et al. (2006)
and Hansen et al. (2004)). On the other hand, opponents may be induced to lower
the prices for a rivaling party in order to discourage the voters of this party. These
cases are quite easily detectable, since traders without such a bias in their trading
behavior should have an approximately balanced ratio between buy and sell actions
– this includes the number of offers and transactions as well as trading volumes.
Manipulators, on the other hand, have a highly imbalanced ratio, since they become
either a sink (when increasing the price) or a source (when decreasing the price) of
shares of the respective party. Thus, these traders can be found by calculating the
ratios for each trader and each share and setting a cutoff.
The other basic micro pattern, circular trading, is egoistically motivated; its ob-
jective is to increase the trader’s endowment by transferring money (either in mon-
etary units or in undervalued shares) from one or several satellite accounts that are
also controlled by the fraudulent trader to a central account. In its most extreme form,
the pattern leads to many accounts with a balance close to zero that have only traded
with one other account in a circular pattern: shares are sold by the satellite to the cen-
tral account at the lower end of the spread and then bought back at the higher end of
the spread, resulting in a net flow of money from the satellite to the central account.
Often this pattern is preluded by a widening of the spread by buying from and selling
to the traders whose offers form the spread boundary in order to increase the leverage
of each transaction between the fraudulent accounts. We have seen cases where the
order book was completely emptied prior to the money transfer. This pattern is only
present in markets where the cost of opening an account lies below the benefitof
doing so, i.e. the initial endowment given to the trader.
While the most extreme form is easily detectable, we need a criterion for the
more subtle forms. In terms of the flows between traders, circular trading implies
that transferring a similar number of shares in each direction, the amounts of money
exchanged differ significantly. In other words, there is a nontrivial net flow of money
to the fraudulent account from one or several accounts to the central, fraudulent one.
The problem lies here in the definition of net flow. Optimally, it should be calculated
as the deviation from the “true” price at the time of the offer or trade times the number
of shares. Unfortunately, the true price is only known at the close of the market. As
a remedy, the current market price could be used. However, as we have seen, the
market price may be manipulated and thus is quite unreliable, especially during the
Analysis of Stock Markets 357
periods in which fraud occurs. The other, favorable approach is to use the volume of
the trades, i.e. the number of shares times the price, as a substitute. For subsequent
transactions with equal numbers of shares, the net flow is equivalent to the difference
in the volumes, for other types of transactions, this is at least an approximation that
facilitates the detection of circular trading.
3 Analysis of trading behavior with complex valued Eigensystem
analysis
To analyze the market on a macro scale, we use an eigensystem analysis method.
The method is fully described in Geyer-Schulz and Hoser (2005). In the next two
sections we will give a short introduction to the technique and the necessary results
with respect to the following analysis.
3.1 Spectral analysis of Hermitian adjacency matrices
The eigensystem analysis described in Geyer-Schulz and Hoser (2005) results in a
full set of eigenvalues (spectrum) / with O
1
,O
2
, ,O
l
and their corresponding eigen-
vectors X with x
1
,x
2
, ,x
l
where the properties of the flow representation guaran-
tee that the matrix becomes Hermitian and thus the eigenvalues are real while the
components of the eigenvectors can be complex. This eigensystem represents a full
orthonormal system where / and X can be written in the Fourier sum representation
l
k=1
O
k
P
k
= H with P
k
= x
k
x
∗
k
; H denotes the linear transformation H = A
C
·e
−i
S
4
with A
C
= A + i·A
t
and A the real valued adjacency matrix of the graph. The pro-
jectors P
k
are computed as the complex outer product of x
k
and represent a sub-
structure of the graph. We identify the relevant projectors by their covered data vari-
ance which can be calculated from the eigenvalues since the overall data variance
is given as
l
k=1
O
2
k
. We detect the most central vertex in the graph by its absolute
value |x
max,m
| of the eigenvector component corresponding to the largest eigenvalue
|O
max
|. This also holds for the most central vertices in each substructure identified by
the projectors P
k
.
3.2 Clustering within the eigensystem
Given the eigensystem as introduced in the last section we take the set of positive
eigenvalues /
+
with O
+
1
,O
+
2
, ,O
+
t
and their corresponding eigenvectors X
+
with
x
+
1
,x
+
2
, ,x
+
t
and build the matrix R
n×t
=
O
+
1
x
+
1
|O
+
2
x
+
2
| |O
+
t
x
+
t
. With this ma-
trix and its complex conjugate we build the matrix S
n×n
= R∗R
∗
as the scalar product
matrix. Since we work in Hilbert space, distances are defined by the following scalar
products: x−y
2
= x−y | x−y= x
2
+y
2
−2Re(x |y). Distances become
minimal if the real part of the scalar product becomes maximal. Within this matrix
S we find the clusters p
k
by assigning the vertices of the network to the cluster such
that a vertex i belongs to a cluster p
k
if Re(S
i,p
k
)=max
j
Re(S
i, j
). As at least one of
358 Markus Franke, Bettina Hoser and Jan Schröder
the eigenvalues of / has to be negative due to
l
k=1
O
k
= 0, the minimum number
of clusters is at least one, at most l −1 for the analyzed network. For details to this
approach see Hoser and Schröder (2007).
4 Analysis of the dataset
When analyzing an actual market to discover fraudulent traders, the basic patterns
introduced in section 2 reflect these traders’ behavior (or part of it) within the market.
To describe the actions taken by the traders we use the eigensystem analysis together
with the spectral clustering method described in section 3. In order to demonstrate
the use of this powerful method, we transform the transaction data of the market into
a network as detailed in section 4.2. Eigensystem analysis is advantageous for the
analysis here as it takes into account not only the relations from one node to the next,
but computes the status of one node recursively from the information on the status of
all other nodes within the network and is therefore referred to as a centrality measure
(for the idea see Brin and Page (1998)).
4.1 Description of the dataset
We analyze a dataset generated by the political stock market system PSM used for
the prediction of the 2006 state elections in Baden-Wuerttemberg, Germany. The
traders were mainly readers of rather serious and politically balanced newspapers all
over the election region. The market ran from January, 31st 2006 until election day
on March, 26th 2006 for about twelve weeks and was stopped with the closing time
of the polling stations at 18:00 CET when the first official information on the voters’
decision is allowed to be released. More detailed data on the market is given in Table
1.
Table 1. Statistical Data on the 2006 state parliament elections in Baden-Wuerttemberg in
Germany
Number of traders (at least one sell or buy transaction) 306 traders
Number of traders (at least one sell transaction) 190 traders
Number of traders (at least one buy transaction) 291 traders
Number of transactions 10786 transactions
Number of shares 7 shares
Avg. volume per trade 214.6 shares
Avg. money flow per trade 2462.1 monetary units
Money flow in total 26556378 monetary units
Share flow in total 2314197 shares
Traders in the market are given 100.000 monetary units (MU) as initial endow-
ment. The market itself ran a continuous double auction market mechanism where
offers by traders are executed immediately if they match. For each share an order
Analysis of Stock Markets 359
22 161 199 53 29
EV
0.31
0.31
0.077
0.039
0.019
0.018
0.017
0.015
0.012
0.011
0.011
0.0093
0.0090
0.0072
var
23 162 108 63 157
+
sgn
c
1
c
2
c
3
c
4
Fig. 1. Eigenvectors of the traders within the most prominent clusters
book is provided by the system where buy and sell offers are added and subsequently
removed in the case of matching or withdrawal.
4.2 Generating the network
In markets with a central market instance the traders usually communicate only with
this central instance; trades are executed against “the market”, and a direct communi-
cation between traders does not take place. This results in an anonymous two-mode
network perspective where a trader has no information on his counterparts in the
offers as well as in the transaction partners. As the idea of the fraudulent action in
the circular trading pattern from section 2 essentially deals with the knowledge of
the counterpart trader we build the trader-to-trader network where the set of nodes
consists of the traders that appeared in the transaction records. These traders have
issued at least one offer that was matched and executed by the market mechanism.
The edges of the network are set as the monetary flow between each pair of traders
in the network (price times number of shares).
4.3 Results of the analysis
Within an agile market with random and normal distributed matching between the
acting traders, good traders should appear in this analysis with a relatively balanced
money flow as argued in section 2. Acting in fraudulent patterns, on the other hand,
leads to a bias of these flows regarding the fraudulent trader, his counterparts and
their connected traders.
Applying eigensystem analysis to the complex valued adjacency matrix as de-
fined in section 3 reveals the patterns of trading behavior within the data set. The
spectrum of the market shows symmetry since the largest and smallest eigenvalues
have the same absolute value, but different signs. A symmetric spectrum points to-
wards a star-structured graph. The variances given in Figure 1 reveal that the first
360 Markus Franke, Bettina Hoser and Jan Schröder
pattern (first two eigenvalues) already describes about 62% of the data variance. To
reach more than 80% of the data variance it is sufficient to look at the first 14 eigen-
vectors; these are shown in Figure 1. On the top and bottom of the figure the IDs of
the traders are given. On the right hand side the sign of the corresponding eigenvalue
is depicted, since, as explained in section 3.1 positive and negative eigenvalues ex-
ist. On the left hand side the covered data variance for each eigenvector is given. The
eigenvectors are represented as rows from top to bottom, with the eigenvectors corre-
sponding to the highest absolute eigenvalues in the top rows, and those corresponding
to lower absolute eigenvalues listed consecutively. Normally, each eigenvector com-
ponent is represented as a colored square. The color saturation reflects the absolute
value for this component, while the color itself reflects the phase of the absolute val-
ued eigenvector component. In the black and white graphic in Figure 1 both values
had to be combined in the shade of grey.
As can clearly be seen, there are four blocks c
1
- c
4
in this figure. The block
c
1
in the upper left hand corner shows that traders with IDs 1847 und 1969 had an
almost balanced trading communication between them, and the volume was large.
The second block c
2
in the middle of the figure represents the trading behavior of the
group of traders with IDs 1922, 1775, 1898 and 1858. Here it can be stated that the
connection between 1922, 1898 and 1858 is quite strong, and the trading behavior
was nearly balanced between 1922 and 1858, while the behavior between 1922 and
1898 has a stronger outbound direction from 1922 to 1858. Between the first and
second block the eigenvectors 3 and 4 describe normal trading behavior as defined
by the market. The third block c
3
shows the traders with IDs 1924 and 1948. These
again show a nearly balanced behavior, as do the traders with IDs 1816 and 1826 in
the lower right hand corner of the figure.
These results were compared to the trading data in the data base. The result is
given in Figure 2. The setup is similar to Figure 1 and it can easily be verified that
the trading behavior is consistent with the results from the eigensystem analysis.
Whenever the eigensystem analysis revealed a nearly balanced trading behavior this
holds true even if the absolute values of transactions are different, since the order of
magnitude stays approximately the same. The important aspect lies in the difference
between the values, as it shows the transfer of money from one trader to the other.
It can thus be seen that the eigensystem reveals overall information about the
trading behavior on the market, when transformed into a trader to trader network.
On the other hand an analysis of each trader and his or her trading behavior towards
other traders can be detected at the same time. Since the method used is an eigenanal-
ysis the absolute value of each eigenvector component is similar to the eigenvector
centrality used e.g. by Google (Brin and Page (1998)) to define relevant actors in a
graph. Our approach though allows a decomposition of the market in the distinguish-
able trading patterns respectively subgroups of traders.
To visualize and illustrate the results of the eigensystem analysis as a graph, we
have taken the respective subgraph which shows the relevant actors as found by the
eigensystem analysis, embedded into the network of all their trading counterparts in
Figure 3. As can be seen the relevant actors really have many connections within
Analysis of Stock Markets 361
108560
1826
10936026285183
1816
923102151
1948
1234702
1924
3004407900352698
1858
24719892400
1898
26326628200005145
1775
228009039219106010056
1922
704600
1969
9761860
1847
1826181619481924185818981775192219691847
108560
1826
10936026285183
1816
923102151
1948
1234702
1924
3004407900352698
1858
24719892400
1898
26326628200005145
1775
228009039219106010056
1922
704600
1969
9761860
1847
1826181619481924185818981775192219691847
Fig. 2. Reduced adjacency matrix entries for the traders within the most prominent clusters
among themselves
Fig. 3. Unweighted subgraph of the traders within the most prominent clusters to all related
traders
the market and even amongst each other, which again validates the results of the
eigensystem analysis.
5 Conclusion
As manipulation within electronic trading systems is limited to behavioral aspects
and the usual amount of data is quite high, irregular acting is likely to remain hidden
within the mass of data when using naïve fraud analysis techniques. Also structural
362 Markus Franke, Bettina Hoser and Jan Schröder
effects of networks blur a clear view. We found that a recursive network analysis
approach, facilitated by a trader-to-trader network supports the discovery of irregular
patterns. Especially by means of the chosen network those traders are followed who
try to use the network in their own favor and thus break the anonymity assumed by
the market system.
Further research will focus on the analysis of the mix of several patterns, the
detection of plain patterns in very noisy trading data as well as the weight func-
tions for the edges within the network transaction graph. On the side of the analysis
technique, comparison of traditional stock market measurements and the measures
that arise from the approach of analyzing the behavioral aspects in electronic trading
systems in a network analysis context are of special interest.
Acknowledgment. We gratefully acknowledge funding of the two projects SESAM
and STOCCER by the Federal Ministry of Education and Research (BMBF).
References
BRIN, S. and PAGE, L.(1998): The Anatomy of a Large-Scale Hypertextual Web Search En-
gine. Computer Networks and ISDN Systems, 30 (1–7), 107–117.
FRANKE, M., GEYER-SCHULZ, A. and HOSER, B. (2006): On the Analysis of Asymmet-
ric Directed Communication Structures in Electronic Election Markets. In: F. Billari et
al. (Eds.):Agent-Based Computational Modelling. Applications in demography, social,
economic and environmental sciences. Physica, Heidelberg, 37–59.
GEYER-SCHULZ, A. and HOSER, B. (2005): Eigenspectralanalysis of Hermitian Adjacency
Matrices for the Analysis of Group Substructures. Journal of Mathematical Sociology,
29(4), 265–294.
HANSEN, J., SCHMIDT, C. and STROBEL, M. (2004): Manipulation in political stock mar-
kets - preconditions and evidence. Applied Economics Letters, 11, 459–463.
HOSER, B. and SCHROEDER, J. (2007): Automatic Determination of Clusters. In: K
H. Waldmann et al. (Eds.): Operations Research Proceedings 2006. Springer, Berlin-
Heidelberg, 439-444.
Root Cause Analysis for Quality Management
Christian Manuel Strobel
1
and Tomas Hrycej
2
1
University of Karlsruhe (TH), Germany
2
Formerly DaimlerChrysler AG, Germany
Abstract. In industrial practice, quality management for manufacturing processes is often
based on process capability indices (PCI) like C
p
,C
pm
,C
pk
and C
pmk
. These indices measure
the behavior of a process incorporating its statistical variability and location and provide a
unitless quality measure. Unfortunately, PCIs are not able to identify those factors, having the
major impact on quality as they are only based on measurement results and do not consider
the explaining process parameters. In this paper an Operational Research approach, based
on Branch and Bound is derived, which combines both, the numerical measurements and the
nominal process factors. This combined approach allows to identify the main source for minor
or superior quality of a manufacturing process.
1 Introduction
The quality of a manufacturing process can be seen as the ability to manufacture a
certain product within its specification limits U, L and as close as possible to its tar-
get value T, describing the point, where its quality is optimal. In literature, numerous
process capability indices have been proposed in order to provide a unitless quality
measures to determine the performance of a process, relating the preset specification
limits to the actual behavior (Kotz and Johnson (2002)). This behavior can be de-
scribed by the process variation and process location. In order to state future quality
of a manufacturing process based on the past performance, the process is supposed
to be stable or in control. This means, that both, process mean and process varia-
tion has to be, on the long run, in between pre-defined limits. A common technique
to monitor this are control charts, one of the tools, provided by Statistical Process
Control.
The basic idea for the most common indices is to assume, that the considered
manufacturing process follows a normal distribution and the distance between the
upper and lower specification limit should equal 6V. The commonly recognized “ba-
sic“ PCIs C
p
,C
pm
,C
pk
and C
pmk
can be summarized by a superstructure, which was
introduced in Vännman (1995) and is referred to in literature as C
p
(u,v):
406 Christian Manuel Strobel and Tomas Hrycej
C
p
(u,v)=
d −u|z −M|
3
V
2
+ v(z −T )
2
(1)
where V is the process standard deviation, z the process mean, d =(U −L)/2 toler-
ance width, m =(U + L)/2 the mid-point between the two specification limits and T
the target value. The “basic“ PCIs can be obtained by setting u and v to:
C
p
≡ C
p
(0,0); C
pk
≡ C
p
(1,0)
C
pm
≡ C
p
(0,1); C
pmk
≡ C
p
(1,1)
(2)
Estimators for the indices can be obtained by substituting z by the sample mean
¯
X =
n
i=1
X
i
/n and V by the sample variance S
2
=
n
i=1
(X
i
−
¯
X)
2
/(n−1). They provide
stable and reliable point estimators for processes following a normal distribution.
However, in practice, this requirement is hardly met, thus the basic PCIs as defined
in (1) are not appropriated for process with non-normal distributions. What is really
needed are indices which do not depend on any kind of distribution in order to be
useful for measuring quality of a process.
C
p
(u,v)=
d −u|m −M|
3
[
F
99.865
−F
0.135
6
]
2
+ v(m −T )
2
(3)
In Pearn and Chen (1997) a generalization of the PCIs superstructure (1) is intro-
duced, in order to cover those cases, where the underlying data does not follow a
Gaussian distribution. The authors replaced the process standard deviation V by the
99.865 and 0.135 quantiles of the empiric distribution function and z by the median
of the process. The idea behind this substitution is, that the difference between the
quantiles F
99.865
and F
0.135
again equals 6V or C
p
(u,v)=1, assuming the special
case, that the process follows a gaussian distribution. The special PCIs C
p
,C
pm
,C
pk
and C
pk
can be obtained by applying u and v as in (2).
Assuming that the following assumptions hold, a class of non-parametric indices
and a particular specimen thereof can be introduced: every manufacturing process is
defined by two distinct sets. Let Y be the set of influence variables (process param-
eters or process factors) and X the corresponding goal variables or measurements
results, then a class of process indices can be defined as:
Definition 1. Let X and Y describe a manufacturing process. Furthermore, let f(x,y)
be the empirical density of the underlying process and w(x) a kernel function. Then
Q :=
x
y
w(x) f(x,y)dydx
x
y
f (x,y)dydx
(4)
defines a class of empirical process indices.
Obviously, if w(x)=x or w(x)=x
2
we obtain the first and resp. the second moment
of the process, as
x
y
f (x,y)dydx ≡ 1. But, to measure the quality of a process,
we are interested in the relationship of the designed specification limits and the pro-
cess behavior. A possibility is to chose the kernel function w(x) in such way, that it
becomes a function of the designed limits U and L.
Root Cause Analysis for Quality Management 407
Definition 2. Let X, Y and f (x,y) be defined as in definition 1. Let U,L be specifica-
tion limits. The Empirical Capability Index (E
ci
)isdefined as:
E
ci
=
x
y
11
(L≤x≤U)
f (x,y)dydx
x
y
f (x,y)dydx
(5)
The E
ci
measures the percentage of data points which are in between the specification
limits U and L. Therefore, it is more sensitive to outliners compared to the common,
non-parametric indices. A disadvantage is, that for processes, having all data points
within the specification limits, the E
ci
always equals one, and therefore does not
provide a comparable quality measure. To avoid this, the specification limits U and
L have to be modified, in order to get “further into the sample“, by linking them to
the behavior of the process.
However, after measuring the quality of a process, one might be interested if there
are subsets of influence variables values, such that the quality of a process becomes
better, if constraining the process only to this parameters. In the following section a
non-parametric, numerical approach for identify those parameters is derived and an
algorithm, which efficiently solves this problem is presented.
2 Root Cause Analysis
In literature a common technique to identify significant discrete parameters having
an impact on numeric variables like measurement results, is the Analysis of Variance
(ANOVA). As a limiting factor, techniques of the Variance Analysis are only useful,
if the problem is of lower dimension. Additionally these variables should be well
balanced or have a simple structure. Another constraint is the assumption, that the
analyzed data has to follow a multivariate Gaussian distribution. In most applications
these requirements are hardly ever met. The distribution of the parameters describing
the measure variable is in general not Gaussian and of higher dimension. Also the
combinations of the cross product of the parameters are non-uniformly and sparely
populated nor have a simple dependence structure. Therefore, the method of Variance
Analysis is not applicable. What is really needed, is a more general approach to
identify the variables, responsible for minor or superior quality.
A process can be defined as a set of influence variables (i.e. process parameters)
Y =(Y
1
, ,Y
n
) consisting of values Y
i
= y
i
1
, ,y
i
m
i
and a set of corresponding goal
variables (i.e. measurement results) X =(X
1
, ,X
n
). If constraining the influence
variable values to a subset
¯
Y ⊆Y,
¯
Y defines a sub-process of the original process Y.
The support of a sub-process
¯
Y can be written as N(X|
¯
Y) :=
x
y∈
¯
Y
f (x,y)dydx and
consequently, a conditional PCI is defined as Q(X|
¯
Y). Any of the indices defined
in the previous section can be used, whereby the value of the respective index is
calculated on the conditional subset
¯
X ⊆X.
In order to determine those parameters having the greatest impact on quality, an
optimal sub-process, consisting of optimal influence combinations, has to be identi-
fied. A naive approach would be, to maximize Q(X|
¯
Y) over all sub-processes
¯
Y ∈Y .
408 Christian Manuel Strobel and Tomas Hrycej
Unfortunately, in general this yields a sub-process, which would only have a lim-
ited support (N(X|Y
∗
)n). A better approach is to think in economic terms and to
weighten the factors responsible for minor quality, which we want to remove, by the
costs of eliminating them. In practise this is not feasible, as to track the actual costs is
too expensive. But it is likely, that rare factors, which are responsible for lower qual-
ity are “cheaper“ to remove than frequent influences. In other words, sub-processes
with high support are preferable.
Often the available sample set for process optimization is small, having numer-
ous influence variables but only few measurement results. By limiting ourselves only
to combinations of variables, we might get too small sub-process (having low sup-
port). Therefore, we extend the possible solutions to combinations of variables and
their values - the search space for optimal sub-processes is spanned by the power-
set of the influence parameters P(Y). The two sided problem, to find the parameter
set combining on the one hand a optimal quality measure and on the other hand a
maximal support, can be summarized by the the following optimization problem:
Definition 3.
(P)=
⎧
⎨
⎩
N(X|
¯
Y) → max
Q(X|
¯
Y) ≥ q
min
¯
Y ∈ P(Y)
The solution of the optimization problem is the subset of process parameters with
maximal support among those processes, having a better quality than the given thresh-
old q
min
.Often,q
min
is set to the common values for process capability of 1.33 or
1.67.
Due to the nature of the application domain, the investigated parameters are dis-
crete which inhibits an analytical solution but allows the use of Branch and Bound
techniques. In the following we derive an algorithm which solves the optimization
problem (3) by avoiding the evaluation of the exponential amount of possible combi-
nations, spanned by the cross product of the influence parameters. In order to achieve
this, a efficient cutting rule is derived in the next section.
Branch and bound algorithm
To efficiently store and access the necessary information and to apply Branch and
Bound techniques, a multitree was chosen as representing data structure. Each node
of the multitree represents a possible combination of the influence parameters (sub-
process) and is build out of the combination of the parents influence set and a new
influence variable and its value(s). Fig. 1 depicts the data structure, whereby each
nodes stands for all elements of the powerset of the considered variable.
To find the optimal solution to the optimization problem (3), a depth-first search
is applied to traverse the tree using a Branch and Bound principle. The idea, to branch
and bound the traverse of the tree is based on the following thoughts: by descending a
branch of the tree, the number of constraints is increasing, as new influence variables
are added and therefore the sub-process support decreases (compare Fig. 1). Thus,
if a node has a support lower than a given minimum support, there is no possibility