Data Analysis Machine Learning and Applications Episode 2 Part 9 pdf
Bạn đang xem bản rút gọn của tài liệu. Xem và tải ngay bản đầy đủ của tài liệu tại đây (377.65 KB, 25 trang )
468 Marcel Paulssen and Angela Sommerfeld
impact. Breaking a promise and experiencing poor quality of repair work influence
solely satisfaction ratings (J
36
= −.23, p <.01 and J
39
= −.32, p <.01), whereas CIs
classified as showing no goodwill and restriction to basic service lowered customers
trust in the service provider (J
28
= −.14, p <.01 and J
210
= −.14, p <.01). The
incident category which should be primarily avoided is negative behaviors toward
the customer, since it clearly has the most damaging impact on the customer-firm re-
lationship, due to its dual influence on trust (J
211
= −.27, p <.01) and satisfaction
(J
311
= −.26, p <.01). Interestingly, only one of the positive CI categories (offer-
ing additional service) impacts on satisfaction with the repair department (J
33
= .23,
p <.01) and none impacts on trust.
Fig. 1. MIMIC model: CI categories and their impact on relationship measures, significant
path coefficients are depicted.
5 Discussion
Even though several papers in the marketing literature have raised the question
whether and which incidents are really critical for a customer-firm relationship (Ed-
vardsson & Strandvik, 2000) ours is the first study to explicitly address this ques-
tion. In the present study, we conducted CI interviews without restricting valence
Are Critical Incidents Really Critical 469
and number of incidents reported, and assessed their impact on measures of rela-
tionship quality. Our results confirm that positive and negative incidents possess a
partially asymmetric impact on satisfaction and trust. Negative incidents have partic-
ularly damaging effects on a relationship through their strong impact on trust (total
causal effect: 0.58). These results are in stark contrast to Odekerken-Schröder et al.’s
(2000) conclusion, that CIs do not play a significant role for developing trust. Fur-
ther the damage inflicted by negative incidents can hardly be “healed” with very
positive experiences, since the total causal effect of the number of positive incidents
on trust is substantially smaller (0.12). Thus, management should clearly put empha-
sis on avoiding negative interaction experiences. The employed MIMIC approach
followed Gremler’s call (2004, p. 79) to “determine which events are truly critical to
the long-term health of the customer-firm relationship” and revealed which specific
incident categories have a particular strong impact on relationship health and should
be avoided with priority, such as negative behavior toward the customer. The col-
lected vivid verbatim stories from the customer’s perspective provide very concrete
information for managers and can be easily communicated to train customer-contact
personnel (Zeithaml & Bitner, 2003; Stauss & Hentschel, 1992). For further studies,
as pointed out by one of the reviewers, an alternative evaluation possibility would be
to measure the experienced severity of the experienced CI-categories instead of their
mere occurrence.
References
BARON, R. and KENNY, D. (1986): The Moderator-Mediator Variable Distinction in Social
Psychological Research: Conceptual, Strategic and Statistical Considerations. Journal of
Personality and Social Psychology, 51 (6), 1173-1182.
BAUMEISTER, R. F., BRATSLAVSKY, E., FUNKENAUER, C., and VOHS, K. D. (2001):
Bad is Stronger than good. Review of General Psychology, 5 (4), 323-370.
BITNER, M. J., BOOMS, B. H., and TETREAULT, M. S. (1990): The Service Encounter -
Diagnosing Favorable and Unfavorable Incidents. Journal of Marketing, 54(1), 71-84.
BOLLEN, K. A. (1989): Structural Equations with Latent Variables. New York: Wiley.
EDVARDSSON, B. (1992). Service Breakdowns: A Study of Critical Incidents in an Airline.
International Journal of Service Industry Management, 3(4), 17-29.
EDVARDSSON, B., and STRANDVIK, T. (2000): Is a Critical Incident Critical for a Cus-
tomer Relationship? Managing Service Quality, 10(2), 82-91.
EICH E, MACAULAY D., and RYAN L. (1994): Mood Dependent Memory for Events of the
Personal Past. Journal of Experimental Psychology - General, 123 (2), 201-215.
FISKE, S. (1980): Attention and Weight in Person Perception - the Impact of Negative and
Extreme Behaviour. Journal of Personality and Social Psychology, 38 (6), 889-906.
FORGAS, J. P. (1995): Mood and Judgment: The Affect Infusion Model (AIM). Psychological
Bulletin, 117 (1), 39-66.
FORNELL, C., JOHNSON, M. D., ANDERSON, E. W., CHA, J., and BRYANT, B. E. (1996):
The American Customer Satisfaction Index: Nature, Purposes, and Findings. Journal of
Marketing, 60 (October), 7-18.
GEYSKENS, I., STEENKAMP, J-B. E. M., and KUMAR, N. (1999): A Meta-Analysis of Sat-
isfaction in Marketing Channel Relationships. Journal of Marketing Research, 36 (May),
223-238.
470 Marcel Paulssen and Angela Sommerfeld
GREMLER, D. (2004): The Critical Incident Technique in Service Research. Journal of Ser-
vice Research, 7(1), 65-89.
JÖRESKOG, K. and SÖRBOM, D. (2001): LISREL 8: User’s Reference Guide. Chicago:
Scientific Software International.
KAHNEMAN, D. and TVERSKY, A. (1979): Prospect Theory - Analysis of Decision under
Risk. Econometrica, 47(2), 263-291.
MORGAN, R. M. and HUNT, S. D. (1994): The commitment-trust theory of relationship
marketing. Journal of Marketing, 58(3), 20-38.
ODEKERKEN-SCHRÖDER, G., van BIRGELEN, M., LEMMINK, J., de RUYTER, K., and
WETZELS, M. (2000): Moments of Sorrow and Joy: An Empirical Assessment of the
Complementary Value of Critical Incidents in Understanding Customer Service Evalua-
tions. European Journal of Marketing, 34(1/2), 107-125.
ROOS, I. (2002): Methods of Investigating Critical Incidents - A Comparative Review. Journal
of Service Research, 4 (3), 193-204.
SINGH, J. and SIRDESHMUKH, D. (2000): Agency and Trust Mechanisms in Consumer
satisfaction and loyalty judgments. Journal of the Academy of the Marketing Science,28
(1), 150-167.
STAUSS, B. and HENTSCHEL, B. (1992): Attribute-based versus Incident-based Measure-
ment of Service Quality: Results of an Empirical Study in the German Car Service In-
dustry. In: P. Kunst and J. Lemmink, (Eds.), Quality Management in Services (59-78).
STAUSS, B. and WEINLICH, B. (1997): Process-oriented Measurement of Service Quality
- Applying the Sequential Incident Technique. European Journal of Marketing, 31 (1),
33-55.
SZYMANSKI, D. M. and HENARD, D. H. (2001): Customer Satisfaction: A Meta-Analysis
of the Empirical Evidence. Academy of Marketing Science, 29(1), 16-35.
TAYLOR, S. (1991): Asymmetrical Effects of Positive and Negative Events: The
Mobilization-Minimization Hypothesis. Psychological Bulletin, 110 (1), 67-85.
YBARRA, O. and STEFAN, W. G, (1999): Attributional Orientations and the Prediction of
Behavior: The Attribution-Prediction Bias. Journal of Personality and Social Psychology,
76 (5), 718-728.
ZEITHAML, V. A. and BITNER, M. J. (2003): Services Marketing: Integrating Customer
Focus across the Firm (3
rd
ed.). New York: McGraw-Hill.
Building an Association Rules Framework for
Target Marketing
Nicolas March and Thomas Reutterer
Institute for Retailing and Marketing, Vienna University of Economics and Business
Administration, Augasse 2–6, 1090 Vienna, Austria
Abstract. The discovery of association rules is a popular approach to detect cross-category
purchase correlations hidden in large amounts of transaction data and extensive retail assort-
ments. Traditionally, such item or category associations are studied on an ’average’ view of the
market and do not reflect heterogeneity across customers. With the advent of loyalty programs,
however, tracking each program member’s transactions has become facilitated, enabling re-
tailers to customize their direct marketing efforts more effectively by utilizing cross-category
purchase dependencies at a more disaggregate level. In this paper, we present the building
blocks of an analytical framework that allows retailers to derive customer segment-specific
associations among categories for subsequent target marketing. The proposed procedure starts
with a segmentation of customers based on their transaction histories using a constrained ver-
sion of K-centroids clustering. In a second step, associations are generated separately for each
segment. Finally, methods for grouping and sorting the identified associations are provided.
The approach is demonstrated with data from a grocery retailing loyalty program.
1 Introduction
One central goal of customer relationship management (CRM) is to target customers
with offers that best match their individual consumption needs. Thus, the question
of who to target with which range of products or items emerges. Most previous re-
search in CRM or direct marketing concentrates on the issue who to target (for an
extensive literature review see, e.g., Prinzie and Van den Poel (2005)). We address
both parts of this question and introduce the cornerstones of an analytical framework
for customizing direct marketing campaigns at the customer segment level.
In order to identify and to make use of possible cross-selling potentials, the pro-
posed approach builds on techniques for exploratory analysis of market basket data.
Retail managers have been interested in better understanding the purchase interde-
pendency structure among categories for quite a while. One obvious reason is that
knowledge about correlated demand patterns across several product categories can
be exploited to foster cross-buying effects using suitable marketing actions. For ex-
ample, if customers often buy a particular product A together with article B, it could
440 Nicolas March and Thomas Reutterer
be useful to promote A in order to boost sales volumes of B, and vice versa. The ob-
jective of exploratory market basket analysis is to discover such unknown cross-item
correlations from a typically huge collection of purchase transaction data (so-called
market baskets) accruing at the retailer’s point-of-sale scanning devices (Berry and
Linoff (2006)). Among others, algorithms for mining association rules are popular
techniques to accomplish this task (cf., e.g. Hahsler et al. (2006)). However, such
association rules are typically derived for the entire data set of available retail trans-
actions and thus reflect an ’average’ or aggregate view of the market only.
In recent years, many retailers have tried to improve their CRM activities by
launching loyalty programs, which provide their members with bar-coded plastic
or registered credit cards. If customers use these cards during their payment process,
they get a bonus, credits or other rewards. As a side effect, these transactions become
personally identifiable by linking them back to the corresponding customers. Thus,
retailers are nowadays collecting series of market baskets that represent (more or
less) complete buying histories of their primary clientele over time.
2 A segment-specific view of cross-category associations
To exploit the potential benefits offered by such rich information on customers’ pur-
chasing behavior within advanced CRM programs, cross-category correlations need
to be detected on a more disaggregate (or customer segment) level instead of an
aggregate level. Attempts towards this direction are made by Boztug and Reutterer
(2007) or Reutterer et al. (2006). The authors employ vector quantization techniques
to arrive at a set of ’generic’ (i.e., customer-unspecific) market basket classes with
internally more distinctive cross-category interdependencies. In a second step they
generate a segmentation of households based on a majority voting of each house-
hold’s basket class assignments throughout the individual purchase history. These
segments are proposed as a basis for designing customized target marketing actions.
In contrast to these approaches, the procedure presented below adopts a novel
centroids-based clustering algorithm proposed by Leisch and Grün (2006), which
bypasses the majority voting step for segment formation. This is achieved by a cross-
category effects sensitive partitioning of the set of (non-anonymous) market basket
data, which imposes group constraints determined by the household labels associated
with each of the market baskets. Hence, during the iterative clustering process the
single transactions are "forced" to keep linked with all the other transactions of a
specific household’s buying history. This results in segments whose members can be
characterized by distinctive patterns of cross-category purchase interrelationships.
To get a better feeling of the inter-category purchase correlations within the pre-
viously identified segments, association rules derived separately for each segment
and evaluated by calculating various measures of significance and interestingness
can assist marketing managers for further decision making on targeted marketing ac-
tions. Although the within-segment cross-category associations are expected to differ
significantly from those generated for the unsegmented data set (because of the data
compression step employed prior to the analysis), low minimum thresholds of such
Building an Association Rules Framework for Target Marketing 441
measures typically still result in a huge number of potentially interesting associa-
tions. To arrive at a clearer and managerially more traceable overview of the various
segment-specific cross-category purchase correlations, we arrange them based on a
distance concept suggested by Gupta et al. (1999).
The next section characterizes the building blocks of the employed methodology
in more detail. Section 4 empirically illustrates the proposed approach using a trans-
action data set from a grocery retailing loyalty program and presents selected results.
Section 5 closes the article with a summary and an outlook on future research.
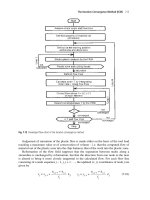
3 Methodology
The conceptual framework of the proposed approach is depicted in Figure 1 and con-
sists of three basic steps: First, a modified K-centroids cluster algorithm partitions
the entire transaction data set and defines K segments of households with an inter-
est in similar category combinations. Secondly, the well-known APRIORI algorithm
(Agrawal et al. (1993)) searches within each segment for specific frequent itemsets,
which are filtered by a suitable measure of interestingness. Finally, the associations
are grouped via hierarchical clustering using a distance measure for associations.
5 6 - 2
5 6 - 2 5 6 - 2 !
K - c e n t r o i d c l u s t e r
a l g o r i t h m h o l d i n g t h e
l i n k a g e t o I p
A s s o c i a t i o n m i n i n g
w i t h i n s e g m e n t k = 1
A s s o c i a t i o n m i n i n g
w i t h i n s e g m e n t k = 2
A s s o c i a t i o n m i n i n g
w i t h
i n s e g m e n t k = K
X
N
F i l t e r i n g , g r o u p i n g
a n d s o r t i n g o f
m i n e d a s s o c i a t i o n s
w i t h i n e a c h
s e g m e n t
Fig. 1. Conceptual framework of the proposed procedure
Step 1: Each transaction or market basket can be interpreted as a J-dimensional
binary vector x
n
=[1,0]
J
with j = 1, 2 J categories. A value of one refers to the
presence and a zero to the absence of an item in the market basket. Integrated into a
binary matrix X
N
, the rows correspond to transactions while each column represents
an item. Let the set I
p
describe a group constraint indicating the buying history of
customer p = 1,2, P with {x
i
∈ X
N
|i ∈ I
p
}. The objective function for a modified
K-centroids clustering respecting group constraints is (Leisch and Grün (2006)):
D(X
N
,C
K
)=
P
p=1
i∈I
p
d(x
i
,c(I
p
)) →min
C
K
(1)
An iterative algorithm for solving Equation 1 requires calculation of the closest
centroid c(.) for each transaction x
i
according to the distance measure d(.) at each
442 Nicolas March and Thomas Reutterer
iteration. To cope with the usually sparse binary transaction data and to make the
partition cross-category effects sensitive, the Jaccard coefficient, which gives more
weight the co-occurrences of ones rather than common zeros, is used as an appropri-
ate distance measure (cf. Decker (2005)). Notice that in contrast to methods like the
K-means algorithm, instead of single transactions groups of market baskets as given
by I
p
(i.e., customer p’s complete buying history) need to be assigned to a minimum
distant centroid. This is warranted by a function f (x
i
) that determines the centroid
closest to the majority of the grouped transactions (cf. Leisch and Grün (2006)).
In order to achieve directly accessible and more intuitively interpretable results,
we can calculate cluster-wise means for updating the prototype system instead of
optimized canonical binary centroids. This results in an ’expectation-based’ cluster-
ing solution (cf. Leisch (2006)), whose centroids are equivalent to segment-specific
choice probabilities of the corresponding categories. Notice that the segmentation
of households is determined such that each customer’s complete purchase history
points exclusively to one segment. Thus, in the present application context the set
of K centroids can be interpreted as prototypical market baskets that summarize the
most pronounced item combinations demanded by the respective segment members
throughout their purchase history. An illustrative example is provided in Table 1 of
the subsequent empirical study.
Step 2: The centroids derived in the segmentation step already provide some
indications on the general structure of the cross-item interdependencies within the
household segments. To get a more thorough understanding, interesting category
combinations (so called itemsets) can be further explored by the APRIORI algorithm
using a user defined support value. For the entire data set, the support of an arbitrary
itemset A is denoted by supp(A)=|{x
n
∈X
N
|A ⊆x
n
}|/ |N |and defines the fraction
of transactions containing itemset A. Notice that in the present context, however,
itemsets are generated at the level of previously constructed segments.
The itemsets are called frequent if their support is above a user-defined thresh-
old value, which implies their sufficient statistical importance for the analyst. To
generate a wide range of associations, rather low minimum support values are usu-
ally preferred. Because not all associations are equally meaningful, an additional
measure of interestingness is required to filter the itemsets for evaluation purposes.
Since our focus is on itemsets, asymmetric measures like confidence or lift are less
useful (cf. Hahsler (2006)). We advocate here the so-called all-confidence measure
introduced by Omiecinski (2003), which is the minimum confidence value for all
rules that can be generated from the underlying itemset. Formally it is denoted by
allcon f(A)=supp(A)/max
B⊂A
{supp(B)} for all frequent subsets B with B ⊂ A.
Step 3: Although the all-confidence measure can assist in reducing the number of
itemsets considerably, in practice it can still be difficult to handle several hundreds of
remaining associations. For an easier recognition of characteristic inter-item corre-
lations within each segment, the associations can be grouped based on the following
Jaccard-like distance measure for itemsets (Gupta et al. (1999)):
D(A,B)=1−
| m(A∪B) |
| m(A) | + | m(B) |−|m(A ∪B) |
(2)
Building an Association Rules Framework for Target Marketing 443
Expression m(.) denotes the set of transactions containing the itemset. From
Equation 2 it should be evident that the distance between two itemsets tends to be
lower if the involved itemsets occur in many common transactions. This property
qualifies the measure to determine specific groups of itemsets that share some com-
mon aspects of consumption behavior (cf. Gupta et al. (1999)).
4 Empirical application
The following empirical study illustrates some of the results obtained from the proce-
dure described above. We analyzed two samples of real-world transaction data, each
realized by 3,000 members of a retailer’s loyalty program. The customers made on
average 26 shopping trips over an observational period of one year. Each transaction
contains 268 binary variables, which represent the category range of the assortment.
To achieve managerially meaningful results, preliminary screening of the data
suggested the following adjustments of the raw data:
1. The purchase frequencies are clearly dominated by a small range of categories,
such as fresh milk, vegetables or water (see Figure 2). Since these categories
are bought several times by almost every customer during the year under in-
vestigation, they provide relatively low information on the differentiated buying
habits of the customers. The opposite is supposed to be true for categories with
intermediate or lower purchase frequencies. Therefore, we decided to eliminate
the upper 52 categories (left side of the vertical line in Figure 2), which occur
in more than 10% of all transactions. The resulting empty baskets are excluded
from the analysis as well.
purchase frequency
0.0
0.1
0.2
0.3
0.4
0.5
Fig. 2. Distribution of relative category purchase frequencies in decreasing order
2. To include households with sufficiently large buying histories, households with
less than six store visits per year were eliminated. In addition, the upper five
percentage quantile of households, which use their customer cards extremely
often, were deleted.
To find a sufficiently stable cluster solution with a minimum within-sum of dis-
tances, the transactions made by the households from the first sample are split into
444 Nicolas March and Thomas Reutterer
three equal sub samples and clustered up to fifteen times each. In each case, the
best solution is kept for the following sub sample to achieve stable results. The con-
verged set of centroids of the third sub sample is used for initialization of the second
sample. Commonly used techniques for determination of the number of clusters rec-
ommended K = 11 clusters as a decent and well-manageable number of household
segments. Given these specifications, the partitioning of the second sample using the
proposed cluster algorithm detects some segments, which are dominated by category
combinations typically bought for specific consumption or usage purposes and other
types of categorical similarities. For example, Table 1 shows an extract of a centroid
vector including the top six categories in terms of highest conditional purchase prob-
abilities in a segment of households denoted as the "wine segment". A typical market
basket arising from this segment is expected to contain red/rosé wines with a proba-
bility of 32.3 %, white wines with a probability of 22.5 %, etc. Hence, the labeling
"wine segment".
Equally, other segments may be characterized by categories like baby food/care
or organic products. On the other hand, there is also a small number of segments with
category interrelationships that cannot be easily explained. However, such segments
might provide some interesting insights into the interests of households which are so
far unknown.
Table 1. Six categories with highest purchase frequencies in the wine segment
No. Category Purchase frequency
1. red / rosé wines 0.3229143
2. white wines 0.2252356
3. sparkling wine 0.1225006
4. condensed milk 0.1206619
5. appetizers 0.1080211
6. cooking oil 0.1066422
According to the second step of the proposed framework, frequent itemsets are
generated from the transactions within the segments. Since we want to mine a wide
range of associations, a quite low minimum support threshold is chosen (e.g., supp=
1%). In addition, all frequent itemsets are required to include at least two categories.
Taking this into account, the APRIORI algorithm finds 704 frequent itemsets for the
transactions of the wine segment. To reduce the number of associations and to focus
on the most interesting frequent itemsets, only the 150 itemsets with highest all-
confidence values are considered for grouping according to step 3 of the procedure.
Grouping the frequent itemsets intends to rearrange the order of the generated
(segment-specific) associations and to focus the view of the decision maker on char-
acteristic item correlations. The distance matrix derived by Equation 2 is used as
input for hierarchical clustering according to the Ward algorithm. Figure 3 shows the
dendrogram for the 150 frequent itemsets within the wine cluster. Again, it is not
straightforward to determine the correct number of groups g
h
. Frequently proposed
heuristics based on plotted heterogeneity measures does not help here. Therefore, we
Building an Association Rules Framework for Target Marketing 445
pass the distance matrix to the partition around medoid (PAM) algorithm of Kauf-
man and Rousseeuw (2005) for several g
h
values. Using the maximum value of the
average silhouette width for a sequence of partitions thirty groups of itemsets are
proposed. In Figure 3 the grey rectangles mark two exemplary chosen clusters of as-
sociations. The corresponding associations of the right hand group are summarized
in Table 2 and clearly indicate an interest of some of the wine households in hard
alcoholic beverages.
Fig. 3. Dendrogram of 150 frequent itemsets mined from transactions of the wine segment
Table 2. Associations of hard alcoholic beverages within the wine segment
No. association support all-confidence
1. {brandy, whisky} 0.011 0.23
2. {brandy, fruit brandy} 0.015 0.18
3. {fruit brandy, appetizers} 0.018 0.17
4. {brandy, appetizers} 0.016 0.15
5. {whisky, fruit brandy} 0.011 0.14
To examine whether the segment-specific associations differ from those gener-
ated within the whole data set, we have drawn and analyzed random samples with
the same amount of transactions as each of the segments. The comparison of the
frequent itemsets mined in the random sample and those from the segment-specific
transactions shows that some segment-specific association groups clearly represent
a unique characteristic of their underlying household segment. Of course, this is not
true in any case. For example, the association group marked by the grey rectangle
on the left-hand side in Figure 3 can be found in almost every random sample or
segment. It denotes correlations between categories of hygiene products.
446 Nicolas March and Thomas Reutterer
5 Conclusion and future work
We presented an approach for identification of household segments with distinc-
tive patterns and subgroups of cross-category associations, which differ from those
mined in the entire data set. The proposed framework enables retailers to segment
their customers according to their past interest in specific item combinations. The
mined segment-specific associations provide a good basis for deriving more respon-
sive recommendations or designing special offers through target marketing activities.
Nevertheless, the stepwise procedure has it’s natural limitations imposed by the
fact that later steps are dependent on the outcome of former stages. A simultaneous
approach would disburden decision makers from determining various model param-
eters (like support thresholds, number of segments) at each stage. Another drawback
is the ad-hoc exclusion of very frequently purchased categories, which could be sub-
stituted in future applications by a data driven weighting scheme.
References
AGRAWAL, R., IMIELINSKI, T. and SWAMI, A. (1993): Mining association rules between
sets of items in large databases. In: Proceedings of the ACM SIGMOD International
Conference on Management of Data. Washington D.C., 207–216.
BERRY, M. and LINOFF G. (2004): Data mining techniques. Wiley, Indianapolis.
BOZTUG, Y. and REUTTERER, T. (2007): A combined approach for segment-specific anal-
ysis of market basket data. In: European Journal of Operational Research, forthcoming.
DECKER, R. (2005): Market Basket Analysis by Means of a Growing Neural Network. The
International Review of Retail, Distribution and Consumer Research, 15, 151–169.
GUPTA, G. K., STREHL, A. and GOSH, J (1999): Distance based clustering of association
rules. In: Intelligent Engineering Systems Through Artificial Neural Networks. ASME
Press, New York, 759–764.
HAHSLER, M., HORNIK, K. and REUTTERER, T. (2006): Implications of Probabilistic
Data Modeling for Mining Association Rules. In: M. Spiliopoulou, R. Kruse, C. Borgelt,
A. Nürnberger, W. Gaul (Eds.): From Data and Information Analysis to Knowledge En-
gineering. Springer, Heidelberg, 598–605.
KAUFMAN, L. and ROUSSEEUW, P. J. (2005): Finding Groups in Data: An Introduction to
Cluster Analysis., Wiley, New York.
LEISCH, F. and GRÜN, B. (2006): Extending standard cluster algorithms to allow for group
constraints. In: A. Rizzi, M. Vichi (Eds.): Compstat 2006, Proceedings in Computational
Statistics. Physica-Verlag, Heidelberg, 885–892.
LEISCH, F. (2006): A toolbox for k-centroids cluster analysis. In: Computational Statistics
and Data Analysis, 51(2), 526–544.
OMIECINSKI, E. (2003): Alternative Interest Measures for Mining Associations in
Databases. In: IEEE Transactions on Knowledge and Data Engineering, 15(1), 57–69.
PRINZIE, A. and VAN DEN POEL, D. (2005): Constrained optimization of data-mining prob-
lems to improve model performance. A direct-marketing application. In: Expert Systems
with Applications, 29, 630–640.
REUTTERER, T., MILD, A., NATTER, M. and TAUDES, A. (2006): A dynamic segmenta-
tion approach for targeting and customizing direct marketing campaigns. In: Journal of
Interactive Marketing, 20(3), 43–57.
Classifying Contemporary Marketing Practices
Ralf Wagner
SVI Chair for International Direct Marketing
DMCC - Dialog Marketing Competence Center,
University of Kassel, Germany
Abstract. This paper introduces a finite-mixture version of the adjacent-category logit model
for the classification of companies with respect to their marketing practices. The classification
results are compared to conventional K-means clustering, as established for clustering market-
ing practices in current publications. Both, the results of this comparison as well as a canonical
discriminant analysis, emphasize the opportunity to offer fresh insights and to enrich empirical
research in this domain.
1 Introduction
Although emerging markets and transition economies are attracting increasing atten-
tion in marketing, Pels and Brodie (2004) argue that conventional marketing knowl-
edge is not valid for these markets per se. Moreover, Burgess and Steenkamp (2006)
claim that emerging markets offer unexploited research opportunities due to their sig-
nificant departures from the assumptions of theories developed in the Western world,
but call for more rigorous research in this domain. But, the majority of studies con-
cerned with marketing in transition economies are either qualitative descriptive or
restricted to simple cluster analysis. This paper seizes the challenge by:
• introducing a finite-mixture approach facilitating the fitting of a response model
and the clustering of observations simultaneously,
• investigating whether or not the Western-type distinction between marketing mix
management and relationship management holds for groups of companies from
Russia and Lithuania, and
• exploring the consistency of the marketing activities.
The remainder of this paper is structured as follows. The next section provides a
description of the research approach, which is embedded in the Contemporary Mar-
keting Practices (CMP) Project. In the third section, a finite-mixture approach is
introduced and criteria for determining the number of clusters in the data are dis-
cussed. The data and the results of this study are outlined in section 4, and section 5
concludes with a discussion of these results.
490 Ralf Wagner
2 Knowledge on interactive marketing
2.1 The research approach
In their review of reasons for the current evolution of marketing Vargo and Lusch
(2004) propose that all economies will change to service economies and that this
change will foster the switch from transactional to relational marketing. Another ar-
gument for emphasizing relational, particularly interactive marketing elements, is
supported by the distinction of B2B from B2C markets. Unfortunately, these claims
are based on deductive argumentation, literature analysis, and case studies, but are
hardly supported by empirical analyses. Subsequently we aim to investigate the man-
ner as to how marketing elements are combined in transition economies.
For this purpose we distinguish the conventional transaction marketing approach
(by means of managing the marketing-mix of product, place, price, and promotion)
from four types of customer relationship and customer dialogue-oriented marketing
(Coviello et al. (2002)):
Transaction Marketing (TM): Companies attract and satisfy potential buyers by man-
aging the marketing mix. They actively manage communication ‘to’ buyers in
a mass-market. Moreover, the buyer-seller transactions are discrete and arm’s-
length.
Database Marketing (DM): Database technology enables the creation of individual
relationships with customer. Companies aim to retain identified customers, al-
though marketing is still ‘to’ the customer. Relationships as such are not close
or interpersonal, but are facilitated and personalized through the use of database
technology.
E-Marketing (EM): Vendors use the Internet and other interactive technologies to
sell products and services. The focus is on creating and mediating the dialogue
between the organization and identified customers.
Interaction Marketing (IM): A Face-to-face interaction between individuals main-
tains a communication process truly ‘with’ the customer. Companies invest re-
sources to develop a mutually beneficial and interpersonal relationship.
Network Marketing (NM): All Marketing activities are embedded in the activities
of a network of companies. All partners commit resources to develop their com-
pany’s position in the network of company level relationships.
For the empirical investigation of the relevance of these marketing types, a survey
approach has been developed. The next subsection describes the results concerning
marketing practices in transition economies already gained through this survey ap-
proach.
2.2 Benchmark: Already known clusters in transition economies
Two studies of marketing practices in emerging markets have been published. The
first study, by Pels & Brodie (2004), points out five distinct clusters of marketing
Classifying Contemporary Marketing Practices 491
practices in the emerging Argentinean economy. This clustering is made up by ap-
plying the K-means algorithm to the respondent’s ratings describing their organiza-
tion’s marketing activities. Working with the same questionnaires and applying the
K-means algorithm, Wagner (2005) revealed three clusters of marketing practices in
the Russian transition economy. In the first study, the number of clusters was cho-
sen with respect to the interpretability of the results, whereas in the second study, the
number of clusters was estimated using the GAP-criterion. Both studies are restricted
to the identification of groups of organizations with similar marketing practices, but
do not address the relationships between particular elements of the marketing and
relationship mix. To tackle these issues, a mixture regression model is introduced in
the next section. In order to provide an assessment of the improvement due to the
employment of more sophisticated methods, we will outline the results of applying
K-means clustering to the data at hand as well.
3 A Finite Mixture approach for classifying marketing practices
3.1 Response Model
Mixture modeling enables the identification of the structure underlying the patterns
of variables and the partition of the observations n (n = 1, ,N) into groups or seg-
ments s (s = 1, ,S) with a similar response structure simultaneously. Assuming
that each group is made up by a different generating process, S
ns
refers to the prob-
ability for the n
th
observation to originate from the generating process of group s.
Let
S
s=1
S
ns
= 1 with S
ns
≥0∀n,s then the density of the observed response data is
given by:
f (y
n
|
˜
x
n
,x
n
,
˜
T,4)=
S
s=1
S
ns
(k = s|
˜
x
n
,
˜
T) f
s
(y
n
|s,x
n
,T
s
) (1)
with
k nominal latent variable (k = 1, ,S)
y
n
scalar response variable
˜
x
n
vector of variables influencing the latent variable k (covariates)
˜
T vector of parameters quantifying the impact of
˜
x
n
on k
x
n
vector of variables influencing y
n
(predictors)
T
s
vector of parameters quantifying the impact of x
n
on y
n
in segment s
4 matrix of parameter vectors T
s
From equation 1, it is obvious, that this model differs from conventional latent class
regression models because of the covariates
˜
x
n
and the corresponding parameter vec-
tor
˜
T, which enable an argumentation of the segment membership. Thus, the covari-
ates
˜
x
n
differ from the x
n
, because the elements
˜
x
n
are assumed to have impact on y
n
by means of causality in the response structure, but only by means of segment mem-
bership. For the application of clustering marketing practices, this feature seems to be
relevant to capture the differences between organizations offering goods or services
and serving B2C or B2B markets.
492 Ralf Wagner
The distribution of conditional densities f
s
(y
n
|s,x
n
,T
s
) might be chosen from
the exponential family, e.g., normal, Poisson, or binomial distribution. For the subse-
quent application of analyzing an ordinal response using a logit approach, the canon-
ical links are binominal (cf. McCullagh and Nelder (1989)). The link function of the
adjacent-category logit model, with r = 1, ,R response categories, is given by:
log
P
s
(y = r + 1|x)
P
s
(y = r|x)
= T
∗
0rs
+ x
n
I
rs
T
s
(r = 2, ,R;s = 1, ,S) (2)
with T
∗
0rs
= T
01s
−T
0rs
∀s. Thus, the comparison of adjacent categories equals the
estimation of binary logits. In order to utilize the information of the ordinal align-
ment of the categories, a score I
rs
for each category r is introduced, so that T
qrs
=
−I
rs
T
q
∀q,s with I
1s
> I
2s
> ···> I
Rs
(Anderson (1984)). Consequently, the prob-
ability of choosing the category k is:
P
s
(Y
n
= r|s, x
n
)=
exp(T
∗
0rs
−x
n
I
rs
T
s
)
R
l=1
exp(T
∗
0ls
−x
n
I
ls
T
s
)
. (3)
Noticeably, the number of parameters to be estimated is highly affected by the num-
berofsegmentsS, but increases just by one for each category.
3.2 Criteria for deciding on the number of clusters
To determine the optimal number of clusters from the structure of a given data set,
distortion-based methods, such as the GAP-criterion or the Jump-criterion, have been
found to be efficient for revealing the correct number (see Wagner et al. (2005) for
a detailed discussion). In contrast to partitioning cluster algorithms, the fitting of
response models usually involves the maximization of the likelihood function.
lnL =
N
n=1
S
s=1
(z
ns
ln f
s
(y
n
|s,x
n
,T
s
)+z
ns
lnS
ns
(k = s|
˜
x
n
,
˜
T)) (4)
with
z
ns
=
1, if observation n in segment s,
0, otherwise
(n = 1, ,N, s = 1, ,S)
Using this likelihood, the optimal number of clusters can be determined by minimiz-
ing the Akaike Information Criterion:
AIC = −2lnL+ 2Q with Q number of parameters (5)
Systematic evaluations of competing criteria revealed that the modified Akaike In-
formation Criterion,
MAIC = −2lnL+ 3Q (6)
outperforms AIC as well as other criteria such as, e.g., BIC or CAIC (Andrews and
Currim (2003)).
Classifying Contemporary Marketing Practices 493
4 Empirical application
4.1 Data description and preprocessing
The data are gathered in using the standardized questionnaires developed within the
CMP project. The first sample of n
1
= 32 observations was generated in the course
of postgraduate management training in Moscow. A second sample of n
2
= 40 obser-
vations was gathered in cooperation with the European Bank for Reconstruction and
Development. This sample differs from the first one because it includes organiza-
tions based in St. Petersburg and a smaller town Yaroslavl located 250 km north-east
of Moscow. A third sample of n
3
= 28 observations was gathered on the lines of
the first sample in the course of postgradual management training, but in Lithuania
covering organizations based in the capital, Vilnius, and the city of Kaunas. Because
of this particular structure of the data under consideration, we expect the data set
to comprise observations from–statistically spoken–different generating processes.
Thus, the mixture approach outlined in section 3.1 should fit the data better than
simple approaches.
Each of the five marketing concepts (as depicted in subsection 2.1) is measured
using nine Likert-type scaled items describing the nature of buyer-seller relations,
the managerial intention, the spending of marketing budgets and the type of staff en-
gaged in marketing activities (cf. Wagner (2005) for details). According to the pro-
ceeding of Coviello et al. (2002), a factor score is computed from each of the nine sets
of indicators. These make up the vectors of predictors x
n
. As outlined in section 2,
two major reasons for introducing the new relational marketing concepts, DM, EM,
IM, and NM, are the increasing importance of service marketing and the differences
between industrial und consumer markets. Therefore, two binary variables indicating
whether the organization n offers services and serves industrial markets are included
as covariates
˜
x
n
according to equation 1. Additionally, the questionnaires comprise
a variable capturing an ordinal rating of the organization’s overall commitment to
transactional marketing. This is the endogenous variable, y
n
, of the response model.
The approach allows the quantification of combinations of marketing concepts as
well as revealing substitutive relations.
4.2 Results
Table 1 depicts the results of fitting the model for 1 to 5 segments.
Table 1. Model’s fit with different numbers of segments
S logL AIC MAIC Class. Err. pseudo R
2
1 -131.49 280.97 289.97 .00 .23
2 -117.04 276.09 297.09 .09 .81
3 -100.96 267.92 300.92 .08 .92
4 -89.76 269.52 314.52 .11 .92
5 -82.62 279.24 336.24 .11 .95
494 Ralf Wagner
It is obvious from the table that the optimal number of segments according to the
AIC und pseudo R
2
is 3. But, the MAIC does not confirm this advice, which holds
for other criteria (e.g., BIC) as well. This result is surprising with respect to the
discussion in subsection 3.2 (see Andrews and Currim (2003) for an explanation of
data scenario’s impact). Table 2 provides the parameter estimates for the predictors
and the covariates of the response model.
Table 2. Parameter estimates for predictors and covariates
Segment 1 Segment 2 Segment 3 Wald-Statistic
inner segment R
2
.87 .81 .89 –
T
01s
-17.01 -2.63 -7.68 19.25
T
02s
-7.96 6.51 1.97 biased
T
03s
5.45 2.76 7.82 biased
T
04s
8.93 2.10 2.59 biased
T
05s
10.59 -8.75 -4.70 biased
TM score 3.67 4.05 .88 10.29
DM score 2.71 1.03 -7.87 8.94
EM score -2.44 64 1.37 6.62
IM score 1.15 .23 6.52 5.17
NM score 44 .29 2.99 3.03
Intercept Covariates .83 82 01 6.97
B2B markets 32 -1.36 1.68 6.86
services .20 1.90 -2.10 8.81
Obviously, the model fits with all three segments. The organizations assigned to
segment 1 are offering goods and services to Russian consumers rather than to busi-
ness customers. As expected, the score for TM is positively related to the dependent
variable (overall commitment towards transactional marketing), but the parameters
for DM and IM are positive as well. Thus, the organizations combine TM with these
relational marketing elements, but substitute for EM and NM. The organizations in
segment 2 are offering services to consumer markets. In contrast to Western-type
marketing folklore, the estimated parameter for TM is the highest positive parameter
for this segment. The organizations in segment 3 are selling industrial goods. In line
with conventional theory, the TM score is positive, but not substantial. Moreover,
IM appears to be most important for these organizations and they have the highest
parameter of all three segments for NM. So far, the results match the theory, but
interestingly, these organizations refrain from engaging in DM.
Table 3 provides a comparison of K-means clustering with the classification of
the response model. The number of three clusters in K-means clustering has been
chosen to achieve a grouping comparable to the finite-mixture approach, but is also
confirmed by the GAP-criterion.
Classifying Contemporary Marketing Practices 495
Table 3. Comparison with K-means clustering
Segment 1 Segment 2 Segment 3 Total
Cluster I 27 13 10 50
Cluster II 9 4 1 14
Cluster III 19 8 9 36
Total 552520100
Surprisingly, the grouping with respect to the response structure differs completely
from the grouping conventional K-means clustering. Particularly, cluster I, which
covers half of all observations, spreads over all segments and, inversely, the organi-
zations of segment 1 are matched to all three clusters. This result is confirmed by the
projection of the clustering solutions in a plane of two canonical discriminant axes
depicted in figure 1.
K-means finite-mixture
+ Cluster I, Sample 1 Cluster II, Sample 1 • Cluster III, Sample 1
× Cluster I, Sample 2 ✸ Cluster II, Sample 2 ◦ Cluster III, Sample 2
∗ Cluster I, Sample 3 Cluster II, Sample 3
#
Cluster III, Sample 3
Fig. 1. Canonical discriminant spaces of groupings
The horizontal axis in the left-hand figure accounts for 82.03 % of the data vari-
ance, the vertical axis for the remaining 17.97 % of this solution (Wilks’ / = .15,
F-statistic = 21.17). Here, the clusters are well separated and non-overlapping. Clus-
ter I and cluster III comprise observations from all three samples, while cluster II is
dominated by observations from the Lithuanian sample. In the right-hand figure, the
horizontal axis accounts for 89.63 % of the data variance, the vertical axis for the
remaining 17.97 % of this solution (Wilks’ / = .56, F-statistic= 4.40). The struc-
ture of segments is not reproduced by the canonical discriminant analysis, although
the same predictors and covariates were used. All segments are highly overlapping.
Thus, it is argued that the grouping, with respect to the response structure, offers
new insights into the structure underlying the data, which can not be revealed by the
clustering methods prevailing in current marketing research publications.
496 Ralf Wagner
5 Conclusions
The finite-mixture approach introduced in this paper facilitates the fitting of a re-
sponse model and the clustering of observations simultaneously. It reveals a struc-
ture underlying the data, which has been shown not to be feasible by conventional
clustering algorithms. Analyzing the relevance of the new relationship paradigm for
marketing in transition economies (Russia and Lithuania), this study clarifies that
the borderline is not simply described by distinguishing services vs. goods markets
or industrial vs. consumer markets.
The empirical results give reasons for rethinking the relevance of Western mar-
keting folklore for transition economies, because only the marketing practices of one
group of organizations targeting industrial customers fit the Western-type guidelines.
Thus, this study confirms conjectures drawn from previous studies, but takes advan-
tage of a more rigorous approach for an interpretation rather than a description of
classification of contemporary marketing practices in transition economies.
References
ANDERSON, J.A. (1984): Regression and Ordered Categorical Variables. Journal of the
Royal Statistical Society (Series B), 46, 1–30.
ANDREWS, R.L. and CURRIM, I.S. (2003): A Comparison of Segment Retention Criteria
for Finite Mixture Logit Models. Journal of Marketing Research, 40, 235–243.
BURGES, S.M. and STEENKAMP, J B.E.M. (2006): Marketing Renaissance: How Research
in Emerging Markets Advances Marketing Science and Practice. Internationals Journal
of Research in Marketing, 23, 337–356.
COVIELLO, N.E., BRODIE, R.J., DANAHER, P.J. and JOHNSTON, W.J. (2002): How Firms
Relate to Their Markets: An Empirical Examination of Contemporary Marketing Prac-
tices. Journal of Marketing, 66 (July), 33–46.
McCULLAGH, P. and NELDER, J.A. (1989): Generalized Linear Models.2
n
d ed., Chapmann
& Hall, Boca Raton.
PELS, J. and BRODIE, R.J. (2004): Profiling Marketing Practice in a Transition Economy:
The Argentine Case. Journal of Global Marketing, 17, 67–91.
VARGO, S.L. and LUSCH, R.F. (2004): Evolving to a New Dominant Logic for Marketing.
Journal of Marketing, 68, 1–17.
WAGNER, R. (2005): Contemporary Marketing Practices in Russia. European Journal of
Marketing, 39, 199–215.
WAGNER, R., SCHOLZ, S.W. and DECKER, R. (2005): The Number of Clusters in Market
Segmentation. In: D. Baier, R. Decker, and L. Schmidt-Thieme (Eds.): Data Analysis
and Decision Support. Springer, Berlin, 157–176.
Conjoint Analysis for Complex Services Using
Clusterwise Hierarchical Bayes Procedures
Michael Brusch and Daniel Baier
Institute of Business Administration and Economics,
Brandenburg University of Technology Cottbus,
Postbox 101344, 03013 Cottbus, Germany
{m.brusch, daniel.baier}@tu-cottbus.de
Abstract. Conjoint analysis is a widely used method in marketing research. Some problems
occur when conjoint analysis is used for complex services where the perception of and the
preference for attributes and levels considerably varies among individuals. Clustering and
clusterwise estimation procedures as well as Hierarchical Bayes (HB) estimation can help
to model this perceptual uncertainty and preference heterogeneity. In this paper we analyze
the advantages of clustering and clusterwise HB as well as combined estimation procedures
of collected preference data for complex services and therefore extend the analysis of Sentis
and Li (2002).
1 Introduction
Conjoint analysis is a “ method that estimates the structure of consumer’s pref-
erences ” (Green and Srinivasan (1978), p. 104). Typically, hypothetical concepts
for products or services (attribute-level-combinations) are presented to and rated by
a sample of consumers in order to estimate part worths for attribute-levels from a
consumer’s point of view and to develop acceptable products or services. Since its
introduction into marketing in the early 1970s conjoint analysis has become a favored
method within marketing research (see, e.g., Green et al. (2001)).
Consequently, conjoint analysis is nowadays a method for which a huge number
of applications are known as well as many specialized tools for data collection and
analysis have been developed. For part worth estimation, especially clusterwise esti-
mation procedures (see, e.g., Baier and Gaul (1999, 2003)) and Hierarchical Bayes
(HB) estimation (see, e.g., Allenby and Ginter (1995), Lenk et al. (1996)) seem to be
attractive newer developments.
After a short discussion of specific problems of conjoint analysis when applied
to preference measurement for (complex) services (section 2) we propose estimation
procedures basing on HB and clustering to reduce these problems (section 3). An
empirical investigation (section 4) shows the viability of this proposition.
432 Michael Brusch and Daniel Baier
2 Preference measurement for services
The concepts evaluated by consumers within a conjoint study can be hypothetical
products as well as – with an increasing importance during recent years – services.
However, services cause special demands on the research design due to their follow-
ing peculiarities (e.g., Zeithaml et al. (1985), pp. 33): immateriality, integration of an
external factor, non-standardization, and perishability.
The main peculiarity is that services cannot be taken into the hands – they are
immaterial. This leads to problems during the data collection phase, where hypothet-
ical services have to be presented to the consumer. It has been shown that the “right”
description and presentation influences the “right” perception of consumers and con-
sequently the validity of the estimated part worths from the collected data (see, e.g.,
Ernst and Sattler (2000), Brusch et al. (2002)).
Furthermore, as we all know, the quality of services depends on the producing
persons and objects as well as their interaction with persons and objects from the
demand side – the so-called external (production) factors. Their synergy, willingness,
and quality often cannot be evaluated before consumption. Perceptual uncertainty of
the usefulness of different attributes and levels as well as preference heterogeneity
is common among potential buyers. Part worth estimates for attribute levels have to
take this into account. Intra- and inter-individual variation has to be modelled.
3 Hierarchical Bayes procedures for conjoint analysis
Recently, for modelling this intra- and inter-individual variation, clustering and clus-
terwise part worth estimation as well as HB estimation have been proposed.
Clustering and clusterwise part worth estimation provide traditional ways to
model preference heterogeneity in conjoint analysis (see, e.g., Baier and Gaul (1999,
2003)). The population is assumed to fall into a number of (unknown) clusters or seg-
ments whose segment-specific part worths have to be estimated from the collected
data.
HB, on the other side, estimates individual part worth distributions by “borrow-
ing” information from other individuals (see, e.g., Baier and Polasek (2003) were
for a conjoint analysis setting this aspect of borrowing is described in detail). Prefer-
ence heterogeneity is not assumed via introducing segments. Instead, the deviation of
the individual part worth distributions from a mean part worth distribution is derived
from the collected individual data (for methodological details and new developments
see, e.g., Allenby et al. (1995), Lenk et al. (1996), Andrews et al. (2002), Liechty et
al. (2005)).
The main advantages and therefore the reasons for the attention of HB can be
summarized as follows (Orme 2000):
• HB estimation seems (at least) to outperform traditional models with respect to
predictive validity.
• HB estimation seems to be robust.
Conjoint Analysis for Complex Services Using Clusterwise HB Procedures 433
• HB permits – even with little data – individual part worth estimation and there-
fore allows to model heterogeneity across respondents.
• HB helps differentiating signal from noise.
• HB and its “draws” (replicates) model uncertainty and therefore provide a rich
source of information.
If facts and statements about HB are considered, it is not surprising, that the
impression results that – especially in case of standard products and services – “HB
methods achieve an ‘analytical alchemy’ by producing information where there is
very little data ” (Sentis and Li (2002), p. 167).
However, question 1: whether this is also true when complex services have to
be analyzed, and – in this case – question 2: whether instead of HB or clustering a
combination of these procedures should be used are still open.
Our investigation tries to close this gap: Clustering and clusterwise HB as well as
combined estimation procedures are applied to collected preference data for complex
services. The results are compared with respect to predictive validity. The investiga-
tion extends the analysis of Sentis and Li (2002) who observed in a simpler setting
that predictive validity (hit rates) were not improved by combining clustering and
HB estimation.
4 Empirical investigation
4.1 Research object
For our investigation a complex service is used: an university course of study with
new e-learning features, e.g., different possibilities to join the lecture (in a lecture hall
or at home using video conferencing) or different types of scripts (printed scripts or
multimedia scripts with interactive exercises). Here, complexity is used as term to
differentiate from simple aspects of services (e.g., price, opening hours, processing
time). Because of this complexity of the attributes and levels we expect perceptual
uncertainty (because of difficultly describable attributes and levels) as well as pref-
erence heterogeneity among consumers have to be considered.
The research object has four attributes, each with three or four levels (for the
structure see Table 1). In total, 15 part worth parameters have to be estimated in our
analyzes.
4.2 Research design
A conjoint study is carried out using the nowadays standard tool for conjoint data
collection, Sawtooth SoftwareŠs ACA system (Sawtooth Software (2002)), to be
precise ACA/Web within SSI/Web (Windows Version 2.0.1b). For our investigation
a five-step analysis is used to answer our focused questions.
434 Michael Brusch and Daniel Baier
Step 1 – Analyzing the quality
In our study we had 239 started and 213 finished questionnaires. Standard ACA
methodology was used for individual part worth estimation. Standard selection crite-
ria reduced the number of usable respondents to 162 with passably good R
2
-measures.
Step 2 – Calculating standardized part worths
The individual part worths were standardized. The attribute level with the lowest
(worst) part worth is becoming 0, the best attribute level combination (combination
of the best attribute levels of each attribute) 1. In the following, these standardized
individual part worths were used for clustering.
Step 3 – Clustering
The sample was divided into two segments (cluster 1 and cluster 2) by means of a
cluster analysis and an elbow criterion. The cluster analysis uses Euclidean distances
and Ward’s method and is based on the standardized individual part worths. From the
resulting dendrogram it could be seen that cluster 2 is far more heterogenous than
cluster 1.
As shown in Table 1 two clusters with a few differences were found. For example,
the different order of the relative importance of the attributes is noticeable. For cluster
1 the most relevant (important) attribute is attribute 3. For cluster 2 – where the
relative importance of the attributes is more uniformly distributed – the most relevant
attribute is instead attribute 2.
Step 4 – Computing HB utilities
The distribution of individual part worths were computed via aggregated HB as well
as via two clusterwise HB part worth estimations. For our analysis, the software
ACA/HB from Sawtooth Software, Inc. is used (Sawtooth Software (2006)), the ac-
tual most relevant standard tool for conjoint data analysis. Preprocessing in order to
segment the available individual data was done via SAS. The following parameters
are set:
• 5,000 iterations before using results (burn in),
• 10,000 draws to be used for each respondent,
• no constraints in use,
• fitting pairs & priors, and
• saving random draws.
Thus, 10,000 draws from the individual part worth distribution are available for
each respondent from aggregated HB as well as two clusterwise HB estimations
resulting in three samples (total sample, cluster 1, cluster 2). These HB utilities will
be used to answer our research questions.
Conjoint Analysis for Complex Services Using Clusterwise HB Procedures 435
Table 1. Conjoint results for the total sample and the clusters
Total sample Cluster 1 Cluster 2
(n=162) (n=80) (n=82)
Rel. Imp. PW Rel. Imp. PW Rel. Imp. PW
Attribute 1 Level 1 0.032 0.044 0.020
Level 2 18.2 % 0.117 14.4 % 0.080 21.8 % 0.154
Level 3 0.140 0.095 0.184
Attribute 2 Level 1 0.106 0.177 0.036
Level 2 0.157 0.183 0.132
Level 3
27.5 %
0.238
28.5 %
0.236
26.5 %
0.240
Level 4 0.081 0.036 0.124
Attribute 3 Level 1 0.256 0.317 0.196
Level 2 0.145 0.131 0.159
Level 3
29.2 %
0.163
33.1 %
0.165
25.4 %
0.161
Level 4 0.019 0.017 0.021
Attribute 4 Level 1 0.199 0.218 0.181
Level 2 0.122 0.068 0.174
Level 3
25.1 %
0.147
24.0 %
0.097
26.2 %
0.195
Level 4 0.043 0.050 0.035
Rel. Imp relativeimportance, PW partworths
Step 5 – Calculating values for predictive validity
The predictive validity was considered while questioning on the basis of the inte-
gration of a specific holdout task. This task included the evaluation of five service
concepts, similar to the “calibration concepts” of a usual ACA questionnaire. The re-
spondents were asked for the “likelihood of using”. This holdout task was separated
from the conjoint task of the ACA questionnaire.
Predictive validity will be measured using two values: the Spearman rank-order
correlation coefficient and the first-choice-hit-rate. The Spearman rank-order corre-
lation compares the predicted preference values with the corresponding observed or-
dinal scale response data from the holdout task. The first-choice-hit-rate is the share
of respondents where the stimulus with the highest predicted preference value is also
the one with the highest observed preference value.
4.3 Results
The results of our investigation are shown in Tables 2 and 3. Table 2 shows the va-
lidity values for the traditional ACA estimation for each partial sample. The validity
values are based on the averages of the traditional (standardized) ACA part worths.
As you can see in Table 2 the validity values for cluster 1 are higher than the
values for the total sample. Cluster 2 has instead the lowest (worst) validity results.
436 Michael Brusch and Daniel Baier
Table 2. Validity values for the total sample and for the clusters for traditional ACA estimation
(using standardized part worths from step 2 at the individual level)
Total sample Cluster 1 Cluster 2
(n=161)* (n=79)* (n=82)
First-choice-hit-rate
(using individual data)
62.11 % 73.42 % 51.22 %
Mean Spearman
(using individual data)
0.735 0.782 0.689
* . . . one respondent had missing holdout data and could not be considered
The validity values shown in Table 3 are based on the HB estimation and are
given for the total sample and for the two clusterwise estimations. The clusters are
separated after the membership during the estimation (total sample or segment). The
description “in total sample” means that the HB utilities of the respondents were
computed by “borrowing” information from the total sample (not only from mem-
bers of the own segment). Thus, the HB estimation happened for all respondents
together, but the validity values for the two clusters were computed later separately.
On the other hand, the description “in segment” means that the HB utilities of the
respondents were computed by “borrowing” information only from members of the
own segment (clusterwise HB estimation).
Furthermore, the results in Table 3 are distinguished according to the data basis.
The validity values are shown for the computation based on the 10,000 draws (10,000
HB utilities) for each respondent and for the computation based on the mean HB
utilities (one HB utility as mean of 10,000 draws (iterations)) for each individual.
From Table 3 it is identifiable that the validity values in cluster 1 are higher and
in cluster 2 lower than in the total sample. Further differences between the clusters
can be found when looking at the HB estimation basis (joint estimation in the total
sample (“in total sample”) or clusterwise estimation (“in segment”)). Here for cluster
1 the results in the case of a joint estimation are better in most cases than a clusterwise
estimation whereas the opposite can be seen in cluster 2.
When comparing the results of Table 3 with those of Table 2 it can be seen that
all validity values for the individual averages based HB estimation are higher than
for the ACA estimation, regardless which HB estimation basis (“in total sample” or
“in segment”) is used. In the case of HB estimation using individual draws, a mixed
result with respect to validity can be found.
5 Conclusion and outlook
The focused questions of our investigation can be answered. The first question was,
whether HB estimation can produce “better results” than traditional part worth es-
timation when complex services have to be analyzed. This can be affirmed for the
usage of individual means, regardless whether the total sample or the segments are