- Trang chủ >>
- Khoa Học Tự Nhiên >>
- Vật lý
Green Energy Technology, Economics and Policy Part 4 pptx
Bạn đang xem bản rút gọn của tài liệu. Xem và tải ngay bản đầy đủ của tài liệu tại đây (179.96 KB, 31 trang )
82 Green Energy Technology, Economics and Policy
Table 10.1 World nuclear power production
Operational Under Construction
Country No. of Units Total MW(e) No. of Units Total MW(e)
Argentina 2 935 1 692
Armenia 1 376
Belgium 7 5 863
Brazil 2 1 884
Bulgaria 2 1 906 2 1 906
Canada 18 12 573
China 11 8 438 21 20 920
Czech Republic 6 3 678
Finland 4 2 696 1 1 600
France 58 63 130 1 1 600
Germany 17 20 480
Hungary 4 1 889
Iran 1 915
India 18 3 984 5 2 708
Japan 54 46 823 1 1 325
Korea, Republic Of 20 17 705 6 6 520
Mexico 2 1 300
Netherlands 1 482
Pakistan 2 425 1 300
Romania 2 1 300
Russian Federation 31 21 743 9 6 894
Slovak Republic 4 1 762 2 810
Slovenia 1 666
South Africa 2 1 800
Spain 8 7 450
Sweden 10 8 992
Switzerland 5 3 238
Ukraine 15 13 107 2 1 900
United Kingdom 19 10 137
United States Of America 104 100 683 1 1 165
Total: 436 370 394 56 51 855
(Includes long term shutdown in Canada (4 units; 2530 Mwe) and Japan (1 unit; 246 MWe; Total includes Taiwan,
China which has 6 (4 949 MW(e)) operating reactors and 2 (2 600 MW(e)) reactors under construction.) (based
on IAEA – Power Reactor Information System)
major accidents involving nuclear reactors, Three Mile Island in USA and Chernobyl in
erstwhile USSR (presently Ukraine), economic pragmatism due to very low oil prices
prevailed over energy planners. Many countries took decisions to roll back nuclear
power and replace it other forms of energy in the late 80s and 90s (Cohen, 1990).
That the nuclear aversion was really short-sighted dawned up on the energy planners
during the last decade when three factors became apparent. The foremost was the fact
that fossil fuel such as oil and coal are being exhausted faster than it was ever imagined.
Their prices are no more very low nor their supply assured.
Secondly the reality of global warming and the fact that the planet has only very
limited capacity of accommodate more carbon was established by scientific studies.
Nuclear power 83
Thirdly emerging economies of China and India amongst few others are breaking out
into a phase high economic growth, which needs vast amounts of added energy supply.
The International Atomic Energy Agency (IAEA) projects that the global nuclear
power capacity will reach between 473 GWe (low projection) to 748 GWe (high pro-
jection) in 2030. The International Energy Agency (IEA) has a reference projection of
433 GWe in 2030 (IAEA, 2009a).
The IEA has published two climate-policy scenarios. The ‘550 policy scenario’,
which corresponds to long-term stabilization of the atmospheric greenhouse gas con-
centration at 550 parts per million of CO
2
, equates to an increase in global temperature
of approximately 3
◦
C. The ‘450’ policy scenario equates to a rise of around 2
◦
C. In the
550 policy scenario, installed nuclear capacity in 2030 is 533 GWe. In the 450 policy
scenario the nuclear share is 680 GWe.
The OECD Nuclear Energy Agency has projected 404–625 GWe in 2030 and
580–1400 GWe in 2050. The US Energy Information Administration has a reference
projection of 498 GWe of nuclear power in 2030.
All the above projections tend to be generally revised upward in the present scenario
of accelerated nuclear growth and heavy energy demand anticipated in some of the
emerging economies such as China and India.
10.1.2 Nuclear power and green energies
Considering the vast resources of uranium and thorium, the two fissionable materials
widely available on the surface of earth, and its energy content, nuclear energy could
be considered as a renewable source of energy. This could be multiplied many times if
extraction of uranium from sea water is also taken in to account.
Fast breeder reactors effectively utilize all the fissionable content of in uranium and
thorium fuel and therefore generate very little waste. It is 100 times more efficient
that current generation of light water and heavy water reactor technologies. This fact,
combined with negligible emission of carbon, makes nuclear power a renewable and
sustainable source of energy.
Apart from being a source of power, nuclear energy could also contribute to pro-
duction of hydrogen, desalination of seawater, thus compliment green energies. Small
nuclear reactor designs such as Pebble Bed Modular Reactors (PBMR) and Compact
High Temperature Reactors (CHTR) could support a decentralized model of power
generation and provide process heat for hydrogen production or desalination of water
(IAEA, 2008a).
Nuclear power was recognized as a reliable, safe, clean and cheap source of energy
since the mid 20thcentury when the first successful generation of electricity was demon-
strated on December 20, 1951 at Experimental Breeder Reactor (EBR-1), Arco, Idaho
(Michal, 2001). Before this reactor was shut down in 1964, it sufficiently laid the
sustainable roadmap for nuclear power to utilize not only the uranium resources of
the plant, but also the vast thorium resources, as well as the possibility of extracting
power out of the used fuel by burning most of the long-lived isotopes.
But the developments that dominated the first and second generation nuclearreactors
thereafter was only based on use of uranium and utilization of only about 1% of the
fissile and fissionable content of the fuel and discard the rest as waste to be stored and
ultimately disposed of in deep geological repositories.
84 Green Energy Technology, Economics and Policy
Third generation reactors today recycle part of the fissile content as Mixed Oxide
Fuel (MOX) and the Fourth Generation reactors to a large extent will follow up with
breeder design of EBR-1 to utilize thorium also in a fuel cycle, which will create or
breed more fuel than it actually burns and thus elevating nuclear power to the status
of renewable energy or green energy.
10.2 NUCLEAR FISSION
Radioactivity was discovered in 1896 by Henri Becquerel. Additional work by Marie
Curie, Pierre Curie, Ernest Rutherford and others proved that unstable atomic
nucleus spontaneously loses energy by emitting ionizing particles and radiation. It
was E. Rutherford who in 1917 demonstrated the possibility of splitting atom and
emission of particles with high energies.
Nuclear fission got its break-through when Otto Hahn and Fritz Strassmann in 1938
split the uranium atom by bombarding it with neutrons and proved that the elements
barium and krypton were formed. Importance of nuclear fission started gaining atten-
tion when it became apparent that fission of heavy elements is an exothermic (heat
emitting) reaction which can release large amounts of energy, both as electromagnetic
radiation and as kinetic energy of the fragments (DOE, 1993).
The amount of energy released by nuclear fission was found to be several orders of
magnitude higher than exothermic chemical reactions such as burning of wood, coal,
oil or gas. Typically a fission event releases about ∼200 MeV (million electron volt) of
energy. On the other hand, most chemical oxidation reactions such as burning coal or
wood, release a few eV per event. Fission of a kilogram of
235
U can produce 7.2 × 10
13
Joules of energy, whereas only 2.4 × 10
7
Joules is obtained by burning one kilogram
of coal.
Therefore nuclear fuel contains more than twenty million times energy, than does a
chemical fuel. The energy of nuclear fission is released as kinetic energy of the fission
products and fragments and as electromagnetic radiation in the form of gamma rays.
In a nuclear reactor this energy is converted to heat as the particles and gamma rays
collide with the atoms that make up the reactor and its coolant, such as light water,
heavy water or liquid metal.
When the isotope
235
U fissions into two nuclei fragments a total mean fission energy
202.5 MeV is released. Typically ∼169 MeV appears as the kinetic energy of the daugh-
ter nuclei. Additionally an average of 2.5 neutrons are emitted with a kinetic energy
of ∼2 MeV each (total of 4.8 MeV).
Many heavy isotopes are fissionable in the sense that they can undergo fission when
struck by free neutrons. But isotopes that sustain a fission chain reaction when struck
by low energy neutrons are also called fissile. A few particularly fissile and readily
obtainable isotopes, such as
235
U and
239
Pu, are called nuclear fuels (Bodansky, 2003).
10.2.1 Fission chain reaction
A nuclear chain reaction can occur when one nuclear reaction causes an average of one
or more nuclear reactions, thus leading to a self-propagating number of these reactions
(Fig 10.1). All fissionable and fissile isotopes undergo a small amount of spontaneous
fission (a form of radioactive decay) which releases a few free neutrons.
86 Green Energy Technology, Economics and Policy
1
2
3
4
2
Figure 10.2 Oklo natural fission reactors (1. Nuclear reactor zone; 2. Sandstone; 3. Uranium ore
zones; 4. Granite)
in light-water reactors. For that reason natural uranium fission chain reactions would
not be possible at present.
The
235
U abundance in Oklo uranium ore was found to be only 0.44%. This low
235
U abundance and presence of neodymium and other elements suggest that a natural
nuclear reactor existed in the past. It was apparent that considerable amount of
239
PU
was also produced. The approximated shape of the reactor zone and hydraulic gradient
allowed moderation and reflection of neutrons produced by spontaneous fission or
cosmic ray induced fission. These conditions allowed the reactor to achieve criticality
(Fig 10.2).
As the reactor power increased, the water moderator would heat, reducing its density
and its effectiveness as a moderator and reflector. The reactors thus could have operated
cyclically, operating for half hour until accumulated heat boiled away the water, then
shutting down for up to 2.5 hours until the rocks cooled sufficiently to allow water
saturation. Based on the amount of fission products generated, the Oklo reactors are
estimated to have operated for more than 150000 years.
It is estimated that the average operating power was about 100 KW, similar to that of
some modern research reactors. The reactors produced a total of 15GW yr of thermal
energy and consumed an estimated 5–6 tonnes of
235
U and produced an equal mass
of fission products. Majority of the fission products have remained in place for nearly
2 billion years, in spite of their location in fractured, porous, and water-saturated
sandstone for most of the time.
10.2.3 Nuclear reactors
A nuclear reactor is a device or system in which nuclear chain reactions are initiated,
controlled, and sustained. Nuclear reactors are usually used for many purposes, but
production of electrical power is the most dominant commercial application.
It can be also used for production radio-isotopes for medical use, to power ships,
submarines and ice-breakers, and for nuclear research. The production of electricity
by a nuclear reactor is accomplished by utilizing the heat from the fission reaction to
drive steam turbines.
Nuclear power 87
Current nuclear reactors technology is based on a sustained nuclear fission chain
reaction to induce in a fissile material fuel, releasing both energy and free neutrons. A
reactor encloses nuclear fuel or reactor core surrounded by a neutron moderator such
as light water, heavy water or graphite and control rods that control the rate of the
reaction (DOE, 1993).
In a nuclear reactor, the neutron flux at a given time is a function of the rate of fis-
sion neutron production and the rate of neutron losses due to non-fission absorption
and leakage from the system. When a reactor’s neutron population remains steady,
so that as many new neutrons are produced as lost, the fission chain reaction will
be self-sustaining and the reactor is referred as “critical’’. When the reactor’s neutron
production exceeds the loss is called “supercritical’’, and when losses dominate, it is
considered “subcritical’’.
For the sustained chain reaction to be possible the uranium-fueled reactors must
include a neutron moderator that interacts with newly produced fast neutrons from fis-
sion events to reduce their kinetic energy from several MeV to several eV, making them
more likely to induce fission. This is because
235
U is much more likely to undergo fis-
sion when struck by one of these thermal neutrons than by a freshly-produced neutron
from fission.
Any element that strongly absorbs neutrons is called a reactor poison, because it
tends to shut down an ongoing fission chain reaction. Some reactor poisons are delib-
erately inserted into fission reactor cores to control the reaction. Boron or cadmium
control rods are usually used for this purpose. Many reactor poisons are produced
by the fission process itself, and buildup of neutron-absorbing fission products affects
both the fuel economics and the controllability of nuclear reactors.
While many fissionable isotopes exist in nature, the useful fissile isotope found in
any sufficient quantity is
235
U. It is about 0.7% of the naturally occurring uranium ore.
The rest about 99.3% is the fissionable
238
U isotope. Therefore in most of the light-
water reactors uses
235
U must be enriched artificially up to 3–5%. Chemical properties
of
235
U and
238
U are identical, so physical processes such as gaseous diffusion, gas
centrifuge or mass spectrometry must be used for isotopic separation based on small
differences in mass.
Nuclear reactors with heavy water moderation can operate with natural uranium,
eliminating altogether the need for enrichment. The Pressurized Heavy Water Reactors
(PHWR) are an example of this type. Some graphite moderated reactor designs can
also use natural uranium as fuel (Table 10.2).
In the reactor core major part of the heat is generated due to conversion of the
kinetic energy of fission products to thermal energy, when the nuclei collide with
nearby atoms. Some of the gamma rays produced during fission are absorbed by the
reactor and their energy converted to heat. Heat is also produced by the radioac-
tive decay of fission products and materials that have been activated by neutron
absorption. This decay heat source will remain for some time even after the reactor is
shutdown.
A nuclear reactor coolant is circulated through the reactor core to absorb the heat
that it generates. Coolant is usually water but sometimes a gas or a liquid metal or
molten salt is also used. The heat is carried away from the reactor and is then used to
generate steam, which drives a turbine coupled with an electrical generator to produce
electricity.
Nuclear power 89
Table 10.3 Current world nuclear reactors
Operating Reactors Reactors Under Construction
Installed Capacity Installed Capacity
Reactor Type Units (MWe) Units (MWe)
Pressurized Water Reactor 265 244 337 47 44 689
Boiling Water Reactor (BWR) 92 83 690 3 3 925
Pressurized Heavy Water 45 22 639 3 1 096
Reactor (PHWR)
Gas Cooled Reactor (GCR) 18 8 949 – –
Light water cooled Graphite 45 22 639 1 925
Moderated Reactor (LWGR)
Fast Breeder Reactor (FBR) 1 560 2 1 220
Total 436 370 394 56 51 855
(Based on IAEA Power Reactor Information System)
In some reactors the coolant acts as a neutron moderator too. A moderator increases
the power of the reactor by causing the fast neutrons that are released from fission to
lose energy and become thermal neutrons. Thermal neutrons are more likely than fast
neutrons to cause fission, so more neutron moderation means more power output from
the reactors.
The power output of the reactor is controlled by controlling how many free neutrons
are able to create more fission. Control rods that are made of a nuclear poison are used
to absorb neutrons, so that there are fewer neutrons available to cause fission. Inserting
the control rod deeper into the reactor will reduce its power output, and extracting
the control rod will increase it.
Depending on the type of nuclear reaction, reactors are classified as thermal reactors
and fast reactors. Thermal reactors use slow or thermal neutrons. Almost all current
reactors are of this type. These contain neutron moderator materials that slow neu-
trons until their neutron temperature is thermalized, that is, until their kinetic energy
approaches the average kinetic energy of the surrounding particles.
Thermal neutrons have a far higher cross section or probability of fissioning the
fissile nuclei
235
U,
239
Pu and
241
Pu and relatively lower probability of capture by
238
U,
compared to the faster neutrons that originally result from fission. This allows the use
of low-enriched uranium or even natural uranium fuel in thermal reactors. The moder-
ator is often also the coolant, such as water under high pressure to increase the boiling
point.
Fast reactors use fast neutrons to cause fission in the fuel. Fast reactors do not
require a neutron moderator, and use less-moderating coolants. But maintaining a
chain reaction in a fast reactor requires the fuel to be enriched to about 20% or more
in fissile material. This is due to the relatively lower probability of fission versus capture
by
238
U. Fast reactors have the potential to produce less transuranic waste because all
actinides are fissionable with fast neutrons.
Pressurized Water Reactors, Boling Water Reactors and Pressurized Heavy Water
Reactors are the mainstay of world nuclear power programme as can be seen from
Table 10.3 (IAEA, 2010).
90 Green Energy Technology, Economics and Policy
Table 10.4 Nuclear fuel cycle stages and activities (Adapted from IAEA, 2009b)
Sub-cycle Stage Activity
FRONT END Uranium Mining and Milling Uranium Mining
Uranium Ore Processing
U Recovery from Phosphates
Conversion Conversion to UO
2
Conversion to UO
3
Conversion to UF
4
Conversion to UF
6
Re-Conversion to U
3
O
8
(Depleted U)
Conversion to U Metal
Enrichment Uranium Enrichment
Uranium Fuel Fabrication Re-conversion to UO
2
Powder
Fuel Fabrication (U Pellet-Pin)
Fuel Fabrication (U Assembly)
Fuel Fabrication (Burnable Poison Pellet-Pin)
Fuel Fabrication (Research Reactors)
Fuel Fabrication (Pebble)
IRRADIATION IN REACTORS
BACK END Spent Fuel Reprocessing and Spent Fuel Reprocessing
Recycling
Re-Conversion to U
3
O
8
(Rep U)
Co-conversion to MOX Powder
Fuel Fabrication (MOX Pellet-Pin)
Fuel Fabrication (MOX Assembly)
Fuel Fabrication (RepU-ERU(Enriched Recycled
uranium Pellet-Pin)
Fuel Fabrication (RepU-ERU Assembly)
Spent Fuel Storage AR Spent Fuel Storage
AFR Wet Spent Fuel Storage
AFR Dry Spent Fuel Storage
Spent Fuel Conditioning Spent Fuel Conditioning
Spent Fuel Disposal Spent Fuel Disposal
10.3 SUSTAINABLE NUCLEAR FUEL CYCLE OPTIONS
The nuclear fuel cycle may be broadly defined as the set of processes and opera-
tions needed to manufacture nuclear fuel, its irradiation in nuclear power reactors
and storage, reprocessing, recycling or disposal (Table 10.4). The nuclear fuel cycle
starts with uranium exploration and ends with disposal of the materials used and gen-
erated during the cycle. Several nuclear fuel cycles can be considered depending on
the type of reactor and the type of fuel used and whether or not the irradiated fuel is
reprocessed and recycled.
The Nuclear fuel cycle has been further subdivided into the front-end and the back-
end sub-cycles. The front-end of the fuel cycle occurs before irradiation and the back-
end begins with the discharge of spent fuel from the reactor (IAEA, 2009b).
Nuclear power 91
If spent fuel is not reprocessed, the fuel cycle is referred to as an open fuel cycle (or a
once-through fuel cycle); if the spent fuel is reprocessed, it is referred to as a closed fuel
cycle. Choosing the ‘closed’ or ‘open’ fuel cycle is a matter of national policy. Some
countries have adopted the ‘closed’ fuel cycle solution, and some others have chosen
the ‘open’ fuel cycle. Combination of solutions or on hold (wait and see) is a position
of other nuclear power countries. (IAEA, 2005a, b)
In the open fuel cycle nuclear material passes through the reactor just once. After
irradiation, the fuel is kept in at-reactor pools until it is sent to away from reactor
storage. It is planned that the fuel will be conditioned and put into a final repository in
this mode of operation. No final repositories for spent fuel have yet been established
anywhere in the world.
In the closed fuel cycle, the spent fuel is reprocessed to extract the remaining uranium
and plutonium from the fission products and other actinides. The reprocessed uranium
and plutonium is then reused in the reactors. This strategy has been adopted by some
countries mainly in light water reactors in the form of mixed oxide (MOX) fuel.
Another closed fuel cycle practice is the recycle of nuclear materials in fast reactors
in which, reprocessed uranium and plutonium are used for production of fast reactor
fuel. Such a reactor can produce more fissile plutonium than it consumes.
In reprocessing stage, the fission products, minor actinides, activation products, and
reprocessed uranium are separated from the reactor-grade plutonium, which can then
be fabricated into MOX fuel. The proportion of the non-fissile even-mass isotopes of
plutonium rises with recycle. So reuse plutonium from used MOX fuel beyond three
recycles is not usually done in thermal reactors. This is not a limitation in fast reactors.
10.3.1 Thorium fuel cycle
The most potential sustainable fuel cycle option for the future is that of thorium.
Abundance of uranium and its relative ease of handling was the reason much attention
was not paid in past in developing thorium fuel cycle. But the recent concerns about
constraints in uranium supply well into future have promoted renewed attention to
thorium. The historical thorium utilization details are given in Table 10.5.
In thorium fuel cycle, the naturally abundant isotope of thorium,
232
Th, is fertile
material which is transmuted into the fissile artificial uranium isotope
233
U which is the
nuclear fuel. The sustained fission chain reaction could be started with existing
233
Uor
some other fissile material such as
235
Uor
239
Pu. Subsequently a breeding cycle similar
to but more efficient than that with
238
U–
239
Pu can be created (IAEA, 2005b).
Thorium is at least 3–4 times more abundant in nature than all uranium isotopes
and is fairly evenly spread on the surface of Earth. Unlike uranium, naturally occurring
thorium consists of only a single isotope (
232
Th) in significant quantities. Consequently,
all mined thorium is useful in thermal reactors without the need for an enrichment
process.
Thorium based fuels exhibit several attractive nuclear properties relative to uranium-
based fuels such as:
• fertile conversion of thorium is more efficient in a thermal reactor.
• fewer non-fissile neutron absorptions and improved neutron economy.
• can be the basis for a thermal breeder reactor.
92 Green Energy Technology, Economics and Policy
Thorium-based fuels also display favorable physical and chemical properties which
improve reactor and repository performance. Compared to the predominant reactor
fuel, uranium dioxide (UO
2
), thorium dioxide (ThO
2
) has a higher melting point,
higher thermal conductivity, and lower coefficient of thermal expansion. Thorium
dioxide also exhibits greater chemical stability.
Because the
233
U produced in thorium fuels is inevitably contaminated with
232
U,
thorium-based used nuclear fuel possesses inherent proliferation resistance. Elimina-
tion of at least the transuranic portion of the nuclear waste problem is possible in
thorium fuel cycle. But there are some long-lived actinides that constitute a long term
radiological impact, especially
231
Pa.
If thorium is used in an open fuel cycle (i.e. utilizing
233
U in-situ), higher burnup is
necessary to achieve a favorable neutron economy. Although thorium dioxide has per-
formed well at burnups of 170 000 MWd/t and 150 000MWd/t, there are challenges
associated with achieving this burnup in light water reactors.
The challenge associated with a once-through thorium fuel cycle is the comparatively
long time scale over which
232
Th breeds to
233
U. The half-life of
233
Pa is about 27 days,
which is an order of magnitude longer than the half-life of
239
Np in the uranium fuel
cycle. As a result substantial
233
Pa builds into thorium-based fuels.
233
Pa is a significant
neutron absorber, and although it eventually breeds into fissile
235
U, this requires
two more neutron absorptions, which degrades neutron economy and increases the
likelihood of transuranic production.
If thorium is used in a closed fuel cycle in which
233
U is recycled, remote handling
is necessary because of the high radiation dose resulting from the decay products of
232
U. This is also true of recycled thorium because of the presence of
228
Th, which is
part of the
232
U decay sequence. Although there is substantial worldwide experience
recycling uranium fuels (e.g. PUREX), similar technology for thorium (e.g. THOREX)
is still under development.
Historical thorium utilization in various reactors is given in Table 10.5.
10.3.2 Uranium resources and production
Uranium is an element that is widely distributed within the earth’s crust. Its principal
use is as the primary fuel for nuclear power reactors. Naturally occurring uranium is
composed of about 99.3%
238
U, 0.7%
235
U and traces of
234
U. In order to use uranium
in the ground, it has to be extracted from the ore and converted into a form which can
be used in the nuclear fuel cycle.
A deposit of uranium discovered by various exploration techniques is evaluated to
determine the amounts of uranium materials that are extractable at specified costs.
Uranium resources are the amounts of ore that are estimated to be recoverable at
stated costs.
IAEA Uranium 2007 Resources, Production and Demand (Red Book) reports that
the total Identified Resources in 2007 is about 5 469 000 tonnes U in the <USD
130/kgU category (Table 10.6). Total Additionally Undiscovered Resources (Prog-
nosticated Resources and Speculative Resources) amounts to another 10 500 000 tU
(OECD/NEA-IAEA, 2008).
The reported Identified Resources (∼5.5 million tonnes natural uranium) can last
83 years at the current rate of consumption of about 70 000 tonnes per year. Moreover,
Table 10.5 Thorium utilization in different experimental and power reactors (Source IAEA, 2005b)
Name and Country Type Power Fuel Operation period
AVR, Germany HTGR, Experimental 15 MW(e) Th+
235
U Driver Fuel, Coated fuel particles, 1967–1988
(Pebble bed reactor) Oxide & dicarbides
THTR-300, Germany HTGR, Power (Pebble Type) 300 MW(e) Th+
235
U, Driver Fuel, Coated fuel particles, 1985–1989
Oxide & dicarbides
Lingen, Germany BWR Irradiation-testing 60 MW(e) Test Fuel (Th,Pu)O2 pellets Terminated in 1973
Dragon, UK OECD- HTGR, Experimental (Pin-in- 20 MWt Th+
235
U Driver Fuel, Coated fuel particles, 1966–1973
Euratom also Sweden, Block Design) Oxide & Dicarbides
Norway & Switzerland
Peach Bottom, USA HTGR, Experimental 40 MW(e) Th+
235
U Driver Fuel, Coated fuel particles, 1966–1972
(Prismatic Block) Oxide & dicarbides
Fort St Vrain, USA HTGR, Power (Prismatic Block) 330 MW(e) Th+
235
U Driver Fuel, Coated fuel particles, 1976–1989
Dicarbide
MSRE ORNL, USA MSBR 7.5 MWt
233
U Molten Fluorides 1964–1969
Shippingport & Indian LWBR PWR, (Pin Assemblies) 100 MW(e), Th+
233
U Driver Fuel, Oxide Pellets 1977–1982, 1962–1980
Point 1, USA 285 MW(e)
SUSPOP/KSTR KEMA, Aqueous Homogenous 1 MWt Th+HEU, Oxide Pellets 1974–1977
Netherlands Suspension
(Pin Assemblies)
NRU & NRX, Canada MTR (Pin Assemblies) Th+
235
U, Test Fuel Irradiation–testing of few
fuel elements
KAMINI; CIRUS; & MTR Thermal 30 kWt; 40 MWt; Al+
233
U Driver Fuel,‘J’ rod of Th & ThO
2
, All three research reactors
DHRUVA, India 100 MWt ‘J’ rod of ThO
2
in operation
KAPS 1&2; KGS 1&2; PHWR, (Pin Assemblies) 220 MW(e) ThO
2
Pellets (For neutron flux flattening of Continuing in all new
RAPS 2, 3&4, India initial core after start-up) PHWRs
FBTR, India LMFBR, (Pin Assemblies) 40 MWt ThO
2
blanket In operation
Nuclear power 95
Table 10.7 World uranium production
U Production in 2008
Country (tonnes U)
Canada 9 000
Kazakhstan 8 521
Australia 8 430
Namibia 4 366
Russia* 3 521
Niger 3 032
Uzbekistan 2 338
USA 1 430
Ukraine* 800
China* 769
South Africa 655
Brazil 330
India* 271
Czech Repub. 263
Romania (est) 77
Pakistan* 45
France 5
Total 43 853
*estimated
Mined uranium ores normally are processed by grinding the ore materials to a uni-
form particle size and then treating the ore to extract the uranium by chemical leaching.
The milling process commonly yields dry powder-form material consisting of natural
uranium, “yellowcake,’’ which is sold on the uranium market as U
3
O
8
.
In 2008, uranium production worldwide was 43 853 tonnes U. Canada, Kaza-
khstan and Australia accounted for almost 60% of world production in 2008. These
three together with Namibia, Niger, the Russian Federation, Uzbekistan and the USA
accounted for 93% of production (Table 10.7) (WNA, 2009)
Uranium production in 2008 covered only about 75% of the world’s reactor require-
ments of 58 685 tonnes U. The remainder was covered by secondary sources such as
stockpiles of natural uranium, stockpiles of enriched uranium, reprocessed uranium
from spent fuel, mixed oxide (MOX) fuel with
235
U partially replaced by
239
Pu from
reprocessed spent fuel, and re-enrichment of depleted uranium tails.
10.3.3 Thorium resources
Thorium, abundant and widely dispersed, could also be used as a nuclear fuel resource.
Most of the largest identified thorium resources were discovered during the exploration
of carbonatites and alkaline igneous bodies for uranium, rare earth elements, niobium,
phosphate, and titanium.
Today, thorium is recovered mainly from the mineral monazite as a by-product
of processing heavy-mineral sand deposits for titanium-, zirconium-, or tin-bearing
minerals. Worldwide thorium resources, which are listed by major deposit types in
96 Green Energy Technology, Economics and Policy
Table 10.8 World resources of thorium
Identified Prognosticated
Country Resources Th (tonnes) Resources Th (tonnes)
Brazil 302 000 330 000
Turkey 344 000 400 000–500 000
India 319 000 –
United States 400 000 274 000
Norway 132 000 132 000
Greenland 54 000 32 000
Canada 44 000 128 000
Australia 452 000 –
South Africa 18 000 130 000
Egypt 100 000 280 000
Other Countries 33 000 81 000
Russia 75 000 –
Venezuela 300 000 –
World Total 2 573 000 1 787–1 887
Table 10.8, are estimated to total about 4.4 million tonnes Th (OECD/NEA-IAEA,
2008).
The primary source of the world’s thorium is the rare-earth and thorium phosphate
mineral, monazite. Monazite itself is recovered as a by-product of processing heavy-
mineral sands for titanium and zirconium minerals.
10.3.4 Uranium conversion, enrichment and fuel fabrication
Milled uranium oxide, U
3
O
8
, must be converted to uranium hexafluoride, UF
6
, which
is the form required by most commercial uranium enrichment facilities currently in
use. A solid at room temperature, uranium hexafluoride can be changed to a gaseous
form at moderately higher temperature of 57
◦
C. The uranium hexafluoride conversion
product contains only natural, not enriched, uranium.
Triuranium octaoxide (U
3
O
8
) is also converted directly to ceramic grade uranium
dioxide (UO
2
) for use in reactors not requiring enriched fuel, such as PHWR. The
volumes of material converted directly to UO
2
are typically quite small compared to
the amounts converted to UF
6
.
Total global conversion capacity is about 75 000 tonnes of natural uranium per year
(tU/yr) for uranium hexafluoride (UF
6
) and 4 500tU/yr for uranium dioxide (UO
2
).
Current demand is about 70 000 tU/yr (IAEA, 2009a).
Natural UF
6
thus must be enriched in the fissionable isotope for it to be used as
nuclear fuel in most of the light water reactors. The different levels of enrichment
required for a particular nuclear fuel application are specified. Light water reactor fuel
normally is enriched to 3.5%
235
U, but uranium enriched to lower concentrations also
is required.
Enrichment is accomplished using some one or more methods of isotope separation.
Gaseous diffusion and gas centrifuge are the commonly used uranium enrichment
technologies. About 96% of the byproduct from enrichment is depleted uranium (DU),
which can be used for armor, kinetic energy penetrators, radiation shielding and ballast.
Nuclear power 97
Enrichment requirements are expressed in Separative Work Units (SWU). It is a
function of the concentrations of the feedstock, the enriched output, and the depleted
tailings; and is expressed in units which are so calculated as to be proportional to
the total input and to the mass processed. The same amount of separative work will
require different amounts of energy depending on the efficiency of the separation tech-
nology.Total global enrichment capacity is currently about 50 million separative work
units per year (SWU/yr) compared to a total demand of approximately 45 million
SWU/yr.
For use as nuclear fuel, enriched uranium hexafluoride is converted into uranium
dioxide (UO
2
) powder that is then processed into pellet form. The pellets are then
fired in a high temperature sintering furnace to create hard, ceramic pellets of enriched
uranium. The cylindrical pellets then undergo a grinding process to achieve a uniform
pellet size.
The pellets are stacked, according to each nuclear reactor core’s design specifications,
into tubes of corrosion-resistant metal alloy. The tubes are sealed to contain the fuel
pellets and these tubes are called fuel rods. The finished fuel rods are grouped in
special fuel assemblies that are then used to build up the nuclear fuel core of a power
reactor.
The metal used for the tubes depends on the design of the reactor. Stainless steel was
used in the past, but most reactors now use zirconium. For the most common types of
reactors, boiling water reactors (BWR) and pressurized water reactors (PWR), the tubes
are assembled into bundles with the tubes spaced precise distances apart. These bundles
are then given a unique identification number, which enables them to be tracked from
manufacture through use and into disposal.
Total global fuel fabrication capacity is currently about 11 500 tU/yr (enriched ura-
nium) for light water reactor (LWR) fuel and about 4 000 tU/yr (natural uranium) for
pressurized heavy water reactor (PHWR) fuel. Total demand is about 12 000 tU/yr.
10.3.5 Spent fuel management and reprocessing
After its operating cycle, the reactor is shut down for refuelling. The spent fuel or used
fuel discharged is stored either at the reactor site, commonly in a spent fuel pool or, in
a common facility away from reactor sites. If on-site pool storage capacity is exceeded,
it may be desirable to store the now cooled aged fuel in modular dry storage facilities
known as Independent Spent Fuel Storage Installations (ISFSI) at the reactor site or at
a facility away from the site.
The spent fuel rods are usually stored in water or boric acid, which provides both
cooling, the spent fuel continues to generate decay heat as a result of residual radioac-
tive decay, and shielding to protect the environment from residual ionizing radiation,
although after several years of cooling they may be moved to dry cask storage (IAEA,
2008b).
The total amount of spent fuel discharged globally was projected to reach 324000
tonnes heavy metal (tHM) by the end of 2008. Of this amount, about 95 000 tHM
have already been reprocessed, 16 000 tHM are currently stored to be reprocessed and
213 000 tHM are stored in spent fuel storage pools at reactors or in away-from-reactor
(AFR) storage facilities. AFR storage facilities are being regularly expanded both by
adding modules to existing dry storage facilities and by building new facilities.
98 Green Energy Technology, Economics and Policy
Spent fuel discharged from reactors contains appreciable quantities of fissile
(
235
U and
239
Pu), fertile (
238
U), and other radioactive materials, including reaction
poisons, which is why the fuel had to be removed. These fissile and fertile materials
can be chemically separated and recovered from the spent fuel. The recovered uranium
and plutonium can, if economic and institutional conditions permit, be recycled for
use as nuclear fuel. This is currently not done for civilian spent nuclear fuel in the US.
Mixed oxide, or MOX fuel, is a blend of reprocessed uranium and plutonium and
depleted uranium which behavessimilarly, although not identically, to the enriched ura-
nium feed for which most nuclear reactors were designed. MOX fuel is an alternative
to low-enriched uranium (LEU) fuel used in the light water reactors which predominate
nuclear power generation. Total global reprocessing capacity is about 6 000 tHM/yr.
10.4 ADVANCED AND NEXT GENER ATION RE ACTOR S
About a dozen advanced reactors are in various stages of development. Some are
evolutionary from the PWR, BWR and PHWR designs and others some are more
radical departures. The former include the Advanced Boiling Water Reactor (ABWR),
two of which are now operating with others under construction, and the planned
passively safe ESBWR and AP1000 units.
Advanced Heavy Water Reactor is proposed with heavy water moderator, that will
be the next generation design of the PHWR type in India. Thorium utilization and
breeding is planned in this reactor. The design includes a number of passive safety
systems. India is also planning to build fast breeder reactors using the
232
Th –
233
U
fuel cycle.
10.4.1 Generation IV reactors
Generation IV reactors are a set of theoretical nuclear reactor designs currently being
researched. These designs are generally not expected to be available for commercial
construction before 2030. Current reactors in operation around the world are gener-
ally considered second- or third-generation systems, with the first-generation systems
having been retired some time ago.
Research into these reactor types was officially started by the Generation IV Interna-
tional Forum (GIF) based on eight technology goals. The primary goals are to improve
nuclear safety, improve proliferation resistance, minimize waste and natural resource
utilization, and to decrease the cost to build and run such plants (DOE, 2002).
The designs being researched are:
1. Very-high-temperature reactor (VHTR): The reactor concept utilizes a graphite-
moderated core with a once-through uranium fuel cycle. This reactor design
envisions an outlet temperature of 1 000
◦
C. The reactor core can be either a
prismatic-block or a pebble bed reactor design. The high temperatures enable
applications such as process heat or hydrogen production via the thermochemical
iodine-sulfur process. It would also be passively safe.
2. Supercritical-water-cooled reactor (SCWR): A concept that uses supercritical
water as the working fluid. SCWRs are basically light water reactors (LWR)
Nuclear power 99
operating at higher pressure and temperatures with a direct, once-through cycle.
It could operate at much higher temperatures than both current PWRs and BWRs.
3. Molten-salt reactor (MSR): A reactor design where the coolant is a molten salt.
The nuclear fuel dissolved in the molten fluoride salt as uranium tetrafluoride
(UF
4
), the fluid would reach criticality by flowing into a graphite core which
would also serve as the moderator. Many current concepts rely on fuel that is
dispersed in a graphite matrix with the molten salt providing low pressure, high
temperature cooling.
4. Gas-cooled fast reactor (GFR): This system features a fast-neutron spectrum and
closed fuel cycle for efficient conversion of fertile uranium and management of
actinides. The reactor is helium-cooled, with an outlet temperature of 850
◦
C and
using a direct Brayton cycle gas turbine for high thermal efficiency.
5. Sodium-cooled fast reactor (SFR): This design builds on two closely related exist-
ing projects, the liquid metal fast breeder reactor and the Integral Fast Reactor.
The goals are to increase the efficiency of uranium usage by breeding plutonium
and eliminating the need for transuranic isotopes ever to leave the site.
6. Lead-cooled fast reactor (LFR): This design features a fast-neutron-spectrum
lead or lead/bismuth eutectic (LBE) liquid-metal-cooled reactor with a closed
fuel cycle. Options include a range of plant ratings, including a “battery’’ of 50
to 150 MW of electricity that features a very long refueling interval, a modular
system rated at 300 to 400MW, and a large monolithic plant option at 1200 MW.
10.4.2 Generation V reactors
Generation V and V+ reactors are defined as designs which are theoretically possible,
but which are not being actively considered or researched at present. Though such
reactors could be built with current or near term technology, they trigger little interest
for reasons of economics, practicality, or safety:
• Liquid Core reactor where the fissile material is molten uranium cooled by a
working gas pumped in through holes in the base of the containment vessel.
• Gas core reactor where the fissile material is gaseous uranium-hexafluoride con-
tained in a fused silica vessel. A working gas such as hydrogen would flow around
this vessel and absorb the UV light produced by the reaction.
• Gas core EM reactor with photovoltaic arrays converting the UV light directly to
electricity.
• Fission fragment reactor that generates electricity by decelerating an ion beam of
fission byproducts instead of using nuclear reactions to generate heat.
10.4.3 Fusion reactors
Fusion power is the power generated by nuclear fusion reactions. Two light atomic
nuclei fuse together to form a heavier nucleus and in doing so, release a large amount
of energy. Most design studies for fusion power plants involve using the fusion reactions
to create heat, which is then used to operate a steam turbine, which drives generators
to produce electricity (Atzeni and Meyer-ter-Vehn, 2004).
100 Green Energy Technology, Economics and Policy
Several fusion reactors have been built, but as yet none has ’produced’ more thermal
energy than electrical energy consumed. Despite research having started in the 1950s,
no commercial fusion reactor is expected before 2050. The ITER project is currently
leading the effort to commercialize fusion power (Nuttall, 2008).
In 1997 Joint European Torus (JET) produced a peak of 16.1 MW of fusion power
(65% of input power), with fusion power of over 10 MW sustained for over 0.5 sec.
The High Power laser Energy Research facility (HiPER) is undergoing preliminary
design for possible construction in the European Union starting around 2010.
10.4.4 Accelerator Driven System
A subcritical reactor is a nuclear fission reactor that produces fission without achieving
criticality. Instead of a sustaining chain reaction, a subcritical reactor uses additional
neutrons from an outside source. The neutron source can be a nuclear fusion machine
or a particle accelerator producing neutrons by spallation. Such a device with a reactor
coupled to an accelerator is called an Accelerator Driven System (ADS).
The long-lived transuranic elements in nuclear waste can in principle be fissioned,
releasing energy in the process and leaving behind the fission products which are
shorter-lived. This would shorten considerably the time for disposal of radioac-
tive waste. The three most important long-term radioactive isotopes that could
advantageously be handled that way are
237
Np,
241
Am and
243
Am (IAEA, 2003).
ADS design propose a high-intensity proton accelerator with an energy of about
1 GeV, directed towards a spallation target made of thorium that is cooled by liquid
lead-bismuth in the core of the reactor. In that way, for each proton interacting in
the target, an average 20 neutrons are created to irradiate the surrounding fuel. Thus,
the neutron balance can be regulated such as the reactor would be below criticality
if the additional neutrons by the accelerator were not provided. Whenever the neutron
source is turned off, the reaction ceases.
There are technical difficulties to overcome before ADS can become economical and
eventually be integrated into future nuclear waste management. The accelerator must
provide a high intensity and be highly reliable. There are concerns about the window
separating the protons from the spallation target, which is expected to be exposed to
stress under extreme conditions.
The chemical separation of the transuranic elements and the fuel manufacturing, as
well as the structure materials, are important issues. Finally, the lack of nuclear data
at high neutron energies limits the efficiency of the design.
Some laboratory experiments and many theoretical studies have demonstrated the
theoretical possibility of such a plant. CERN, was one of the first to conceive a
design of a subcritical reactor, the so-called “energy amplifier’’. In 2005, several large-
scale projects are going on in Europe and Japan to further develop subcritical reactor
technology.
10.5 NUCLEAR ECONOMICS
Nuclear power plants have a ‘front-loaded’ cost structure, i.e. they are relatively expen-
sive to build but relatively inexpensive to operate. Thus existing well-run operating
nuclear power plants continue to be a competitive and profitable source of electricity.
Nuclear power 101
0510
Euro cent/kWh
Nuclear
Coal
Natural gas
Oil
Hydropower
Onshore wind
Offshore wind
Solar PV
145
15 20
Figure 10.3 Ranges of levelized costs associated with new nuclear reactor construction
For new construction, however, the economic competitiveness of nuclear power
depends on the alternatives available, on the overall electricity demand in a country
and how fast it is growing, on the market structure and investment environment,
on environmental constraints, and on investment risks due to possible political and
regulatory delays or changes. Thus economic competitiveness is different in different
countries and situations.
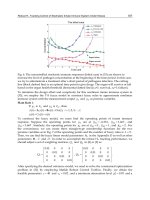
Figure 10.3 summarize estimates from seven recent studies of electricity costs for new
power plants withdifferent fuels. The ranges incorporate only internalized costs. If high
enough priority is given to improving national energy self-sufficiency, for example, the
preferred choice in a specific situation might not be the least expensive (IAEA, 2006).
Different technologies have different costs. Proven designs may cost less than first-
of-a kind reactors, and building a first-of-a-kind reactor will likely cost more than
building subsequent reactors of the same design. Different estimates also incorporate
different learning rates in anticipating how costs will decrease with experience.
Different perspectives can also lead to different estimates. A 2006 report by the UK
Sustainable Development Commission stated that vendors of reactor systems had a
clear market incentive, especially ahead of contractual commitments, to underestimate
costs. Utilities may have a tendency to be more conservative.
Another contributor to higher overall cost estimates may be the fact that the greater
share of those estimates come from Europe and especially North America, where the
lack of recent construction experience relative to Asia and new reactor designs likely
contribute to the higher estimates.
Construction delays can add significantly to the cost of a plant. Because a power
plant does not yield profits during construction, longer construction times translate
directly into higher finance charges.
102 Green Energy Technology, Economics and Policy
In some countries in the past unexpected changes in licensing, inspection and cer-
tification of nuclear power plants added delays and increased construction costs.
However, the regulatory processes for siting, licensing, and constructing have been
standardized, streamlining the construction of newer and safer designs.
At the end of a nuclear plant’s lifetime (estimated at between 40 and 60 years), the
plant must be decommissioned. Operators are usually required to build up a fund to
cover the decommissioning costs while the plant is operating, to limit the financial risk
from operator bankruptcy.
The cost per unit of electricity produced (kWh) will vary according to country,
depending on costs in the area, the regulatory regime and consequent financial and
other risks, and the availability and cost of finance. Costs will also depend on geo-
graphic factors such as availability of cooling water, earthquake likelihood, and
availability of suitable power grid connections. So it is not possible to accurately
estimate costs on a global basis (NEI, 2007).
In 2003, the Massachusetts Institute of Technology (MIT) issued a report entitled,
“The Future of Nuclear Power’’. They estimated that new nuclear power in the US
would cost 6.7 centsper kWh. However, the Energy Policy Act of 2005 includes a tax
credit that should reduce that cost slightly. In 2009, MIT updated its 2003 study,
concluding that inflation and rising construction costs had increased the overnight
cost of nuclear power plants to about $4 000/kWe, and thus increased the power cost
to 8.4 cents/kWh.
The lifetime cost of new generating capacity in the United States was estimated
in 2006 by the U.S. government at 5.93cents per kWh. A 2008 study based on his-
torical outcomes in the U.S. said costs for nuclear power can be expected to run
$0.25–0.30 per kWh. A 2008 study concluded that if carbon capture and storage
was required then nuclear power would be the cheapest source of electricity even
at $4 038/kW in overnight capital cost (WNA, 2010).
10.6 NUCLEAR SAFETY
Nuclear safety covers the actions taken to prevent nuclear and radiation accidents
or to limit their consequences. This covers nuclear power plants as well as all other
nuclear facilities, the transportation of nuclear materials, the use and storage of nuclear
materials for medical, power, industry, and military uses.
Modern nuclear power plants have a defense-in-depth plan for safety. First layer of
defense is the inert, ceramic quality of the uranium oxide itself. Second layer is the
airtight zirconium alloy of the fuel rod. Third layer is the reactor pressure vessel made
of steel more than a dozen centimeters thick. Fourth layer is the pressure resistant,
airtight containment building. The fifth layer is the reactor building or in newer power
plants a second outer containment building (IAEA, 2009c).
Two major accidents involving nuclear reactors are the Three Mile Island accident
in USA and the Chernobyl accident in the then USSR (now in Ukraine). These two
accidents contributed to slowing the growth of nuclear energy since 1990s.
The Three Mile Island accident was a partial core meltdown in Unit 2, a pressurized
water reactor, in Dauphin County, Pennsylvania near Harrisburg. It was the most
significant accident in USA, resulting in the release of up to 481 PBq (13 million
Nuclear power 103
curies) of radioactive gases, but less than 740 GBq (20 curies) of the particularly
dangerous
131
I.
The accident began at 4:00 a.m. on Wednesday, March 28, 1979, with failures
in the non-nuclear secondary system, followed by a stuck-open pilot-operated relief
valve (PORV) in the primary system, which allowed large amounts of reactor coolant
to escape. The mechanical failures were compounded by the initial failure of plant
operators to recognize the situation as a loss of coolant accident due to inadequate
training and human factors industrial design errors relating to ambiguous control
room indicators in the power plant’s user interface (Walker, 2004).
There were no human fatalities in this accident.
Chernobyl nuclear accident occurred on 26 April 1986 at the Chernobyl Nuclear
Power Plant in the Ukrainian Soviet Socialist Republic (then part of the Soviet Union),
now in Ukraine. It is considered to be the worst nuclear power plant disaster in history
and resulted in a severe release of radioactivity following a massive power excursion
that destroyed the reactor. The accident raised concerns about the safety of the Soviet
nuclear power industry as well as nuclear power in general, slowing its expansion for
a number of years while forcing the Soviet government to become less secretive.
On 26 April 1986 at 1:23 a.m., reactor 4 suffered a massive, catastrophic power
excursion. This caused a steam explosion, followed by a second (chemical, not nuclear)
explosion from the ignition of generated hydrogen mixed with air, which tore the
top from the reactor and its building, and exposed the reactor core. This dispersed
large amounts of radioactive particulate and gaseous debris containing fission products
including
137
Cs and
90
Sr and other highly radioactive reactor waste products (IAEA,
1992).
The open core also allowed atmospheric oxygen to contact the super-hot core
containing 1 700 tonnes of combustible graphite moderator. The burning graphite
moderator increased the emission of radioactive particles, carried by the smoke. The
reactor was not contained by any kind of hard containment vessel.
The radioactive plume drifted over large parts of the western Soviet Union, Eastern
Europe, Western Europe, and Northern Europe, with some nuclear rain falling as far
away as Ireland. Large areas in Ukraine, Belarus, and Russia were badly contaminated,
resulting in the evacuation and resettlement of over 336 000 people.
Most fatalities from the accident were caused by radiation poisoning. The 2005
report prepared by the Chernobyl Forum, led by the IAEA and World Health Organi-
zation (WHO), attributed 56 direct deaths (47 accident workers, and nine children with
thyroid cancer), and estimated that there may be 4 000 extra cancer deaths among the
approximately 600 000 most highly exposed people. Although the Chernobyl Exclu-
sion Zone and certain limited areas remain off limits, the majority of affected areas
are now considered safe for settlement and economic activity.
Safety indicators, such as those published by World Association of Nuclear Opera-
tors (WANO) improved dramatically in the 1990s (Figs. 10.4 and 10.5) (IAEA, 2009a).
However, in some areas improvement has stalled in recent years, as in the case of
unplanned scrams shown in Fig. 10.4.
The gap between the best and worst performers is still large, providing substantial
room for continuing improvement. Since the 1986 accident at Chernobyl, enormous
efforts have been made in upgrading reactor safety features, but facilities still exist at
which nuclear safety assistance should be made a priority.
Nuclear power 105
0
Dose
Reactors
0
20
40
60
80
100
120
140
160
180
200
220
240
260
280
300
320
340
360
380
400
420
Number of operating reactors Total annual collective dose
440
460
1957
1960
1965
1970
1975
1980
1985
Year
1990
1995
2000
2005
50
100
150
200
250
300
350
400
450
500
550
600
650
700
750
800
850
900
950
1000
1050
Figure 10.6 Evolution of the total annual collective dose (man Sv) and number of operating reactors
put into practice, the probability of a serious accident occurring can be significantly
reduced.
In general, occupational radiation protection in nuclear installations around the
world is well managed and few workers in these installations receive significant radi-
ation doses. Figure 10.6 shows the trend for total annual collective dose received by
NPP workers. It should be noted that the recent levelling off of the collective dose
over the past three years is mainly the result of the completion of earlier successful
and significant efforts at optimization of radiation protection over the past ten years
(IAEA, 2009c).
Contrary to other exposures to ionizing radiation, which have remained constant or
decreased over the past decade, medical exposures have increased at a remarkable rate.
After natural background radiation, medical uses constitute the next largest source of
ionizing radiation to the world’s population (Fig 10.7).
10.7 DISPOSAL OF NUCLEAR WASTES
Storing high level nuclear waste above ground for a century or so is considered appro-
priate. This allows the material to be more easily observed and any problems detected
Nuclear power 107
Another approach termed “Remix and Return’’ would blend high-level waste with
uranium mine and mill tailings down to the level of the original radioactivity of the
uranium ore, then replace it in inactive uranium mines. This approach has the merits
of providing jobs for miners who would double as disposal staff, and of facilitating a
cradle-to-grave cycle for radioactive materials.
There have been proposals for reactors that consume nuclear waste and transmute
it to other, less-harmful nuclear waste. In particular, the Integral Fast Reactor was a
proposed nuclear reactor with a nuclear fuel cycle that produced no transuranic waste
and in fact, could consume transuranic waste.
Another option is to find applications of the isotopes in nuclear waste so as to re-use
them. Already,
137
Cs,
90
Sr and a few other isotopes are extracted for certain indus-
trial applications such as food irradiation and radioisotope thermoelectric generators.
While re-use does not eliminate the need to manage radioisotopes, it may reduce the
quantity of waste produced.
Space disposal is an attractive notion because it permanently removes nuclear waste
from the environment. However, it has significant disadvantages, not least of which
is the potential for catastrophic failure of a launch vehicle. Furthermore, the high
number of launches that would be required, due to the fact that no individual rocket
would be able to carry very much of the material relative to the material needed to be
disposed of.
In the future, alternative, non-rocket space launch technologies may provide a solu-
tion. It has been suggested that through the use of a stationary launch system many of
the risks of catastrophic launch failure could be avoided. A promising concept is the
use of high power lasers to launch “indestructible’’ containers from the ground into
space.
Chapter 11
Next generation green technologies
T. Harikrishnan (IAEA)
11.1 INTRODUCTION
Renewable energy technologies are essential contributors to sustainable energy as they
contribute to world energy security by reducing dependence on fossil fuel resources,
and providing opportunities for mitigating greenhouse gases. The three generations of
renewable technologies, reaching back more than 100 years are:
• First-generation technologies include hydropower, biomass combustion, and
geothermal power and heat.
• Second-generation technologies include solar heating and cooling, wind power,
modern forms of bioenergy, and solar photovoltaics.
• Third-generation technologies are still under development and include advanced
biomass gasification, enhanced geothermal system, and marine energy.
First- and second-generation technologies have entered the markets. Third-
generation technologies are not yet widely demonstrated or commercialized. They
may have potential comparable to other renewable energy technologies (IEA, 2007).
Bioenergy or biofuel technologies being developed today, notably cellulosic ethanol
biorefineries, could allow biofuels to play a much bigger role in the future. Crop
residues, such as corn stalks, wheat straw and rice straw and wood waste and municipal
solid waste are potential sources of cellulosic biomass. Dedicated energy crops, such
as switchgrass, are also promising cellulose sources that can be sustainably produced
in many regions of the United States.
Biomass gasification is potentially more efficient than direct combustion of the
original fuel. Syngas can be burned directly in internal combustion engines, used to
110 Green Energy Technology, Economics and Policy
produce methanol and hydrogen. It can be converted by the Fischer-Tropsch process
into synthetic fuel.
There is an increased interest in alga-culture or farming algae for making vegetable
oil, biodiesel, bioethanol, biogasoline, biomethanol, biobutanol and other biofuels,
using land that is not suitable for agriculture. Algal fuels do not affect fresh water
resources. They can be produced using ocean and wastewater, and are biodegradable
and relatively harmless to the environment.
Department of Energy, USA estimates that if algae fuel replaced all the petroleum
fuel in the United States, it would require an area of 40 000km
2
. This is less than 15%
the area of corn harvested.
Marine energy encompasses wave energy and tidal energy obtained from oceans,
seas, and other large bodies of water. Portugal has the world’s first commercial wave
farm, the Aguçadora Wave Park. The farm will initially generate 2.25 MW of power.
Funding for a wave farm in Scotland was announced in 2007 at a cost of over 4 million
pounds. The farm will be the world’s largest with a capacity of 3MW.
In 2007, the world’s first turbine to create commercial amounts of energy using
tidal power was installed in the narrows of Strangford Lough in Ireland. The 1.2 MW
underwater tidal electricity generators take advantage of the fast tidal flow, which can
be up to 4 m/s.
Enhanced Geothermal Systems (EGS) systems are currently being developed and
tested in France, Australia, Japan, Germany, the U.S. and Switzerland. EGS do not
require natural convective hydrothermal resources. The largest EGS project in the
world is a 25 megawatt demonstration plant currently being developed in the Cooper
Basin, Australia. The Cooper Basin has the potential to generate 5 000–10 000MW.
11.2 BIOMASS GASIFICATION
Biomass has been a major energy source, prior to the discovery of fossil fuels like coal
and petroleum. Even though its role is presently diminished in developed countries,
it is still widely used in rural communities of the developing countries. There are five
accepted technologies for converting biomass fuels into electrical energy:
• Conventional steam cycle – biomass is burned to produce steam which is then used
to drive a turbine
• Gasification – biomass is converted to a gas using a high temperature oxygen
starved environment
• Pyrolysis – biomass is converted to a liquid rather than a gas
• Anaerobic digestion – typically sewage sludge is digested to produce methane
• Landfill gas – collection of gas from landfill sites
Gasification is the most attractive of the technologies, but also one of the least devel-
oped. Gasification is the process of converting solid fuels to gaseous fuel. There are
a number of practical and engineering issues with gasification which, until now, have
been a barrier to full commercial roll out of this technology.
The biomass integrated gasifier/gas turbine combined cycle (BIG/GTCC) is not yet
commercially employed. Substantial demonstration and commercialisation efforts are
Next generation green technologies 111
ongoing worldwide. Overall economics of biomass-based power generation should
improve considerably with BIG/GTCC systems.
Biomass gasification is a process that converts biomass into carbon monoxide and
hydrogen at high temperatures with a controlled amount of oxygen. The resulting gas
mixture is called synthesis gas or syngas and is itself a fuel. Gasification relies on chem-
ical processes at elevated temperatures >700
◦
C, which distinguishes it from biological
processes such as anaerobic digestion that produce biogas.
Pyrolysis is only one of the steps in the conversion process. The other steps are
combustion with air and reduction of the product of combustion, water vapour and
carbon dioxide into combustible gases, carbon monoxide, hydrogen, methane, some
higher hydrocarbons and inert gases, carbon dioxide and nitrogen.
Using the syngas is potentially more efficient than direct combustion of the original
fuel. Syngas can be burned directly in internal combustion engines, used to produce
methanol and hydrogen. It can be converted by the Fischer-Tropsch process into
synthetic fuel.
Any type of organic material can be used as the raw material for gasification, such
as wood, biomass, or even plastic waste. High-temperature combustion refines out
corrosive ash elements such as chloride and potassium, allowing clean gas production
from otherwise problematic fuels. Gasification of fossil fuels is currently widely used
on industrial scales to generate electricity.
11.2.1 Biomass
Biomass, a renewable energy source, is biological material derived from living, or
recently living organisms, such as wood, waste, and alcohol fuels. Biomass is com-
monly plant matter grown to generate electricity or produce heat. Forest residues such
as dead trees, branches and tree stumps, as well as yard clippings, wood chips and
garbage may be used as biomass.
Biomass also includes plant or animal matter used for production of fibers or
chemicals. Biomass may also include biodegradable wastes that can be burnt as fuel.
It excludes organic materials such as fossil fuels which have been transformed by
geological processes into substances such as coal or petroleum.
Although fossil fuels have their origin in ancient biomass, they are not considered
biomass because they contain carbon that has been excluded of the carbon cycle for a
very long time. Their combustion therefore disturbs the carbon dioxide content in the
atmosphere.
Biomass is a natural substance available, which stores solar energy by the process of
photosynthesis in the presence of sunlight. It chiefly contains cellulose, hemicellulose
and lignin, with an average composition of CH
6
H
10
O
5
.
Industrial biomass can be grown from numerous types of plants, including miscant-
hus, switchgrass, hemp, corn, poplar, willow, sorghum and sugarcane. It can come
from a variety of tree species, ranging from eucalyptus to oil palm. The particular plant
used is usually not important to the end products, but it does affect the processing of
the raw material (Volk et al, 2000).
There are five basic categories of material:
• Virgin wood: from forestry, arboriculture activities or from wood processing;
• Energy crops: high yield crops grown specifically for energy applications;